


惯性聚合 高效追踪和阅读你感兴趣的博客、新闻、科技资讯
阅读原文 在惯性聚合中打开

推荐订阅源

酷 壳 – CoolShell
酷 壳 – CoolShell
D
DataBreaches.Net
C
Check Point Blog
雷峰网
雷峰网
小众软件
小众软件
GbyAI
GbyAI
美团技术团队
P
Proofpoint News Feed
让小产品的独立变现更简单 - ezindie.com
罗磊的独立博客
大猫的无限游戏
大猫的无限游戏
WordPress大学
WordPress大学
MyScale Blog
MyScale Blog
The Cloudflare Blog
阮一峰的网络日志
阮一峰的网络日志
Apple Machine Learning Research
Y
Y Combinator Blog
Jina AI
Jina AI
爱范儿
爱范儿
Last Week in AI
Last Week in AI
MongoDB | Blog
MongoDB | Blog
I
InfoQ
钛媒体:引领未来商业与生活新知
钛媒体:引领未来商业与生活新知
博客园 - 司徒正美

Buttondown's blog

Email could have been X.400 times better The physicists who convinced Fermilab to send Brazil's emails Slack webhooks Better in-app previews Analytics 3.0 Subscriber ID variables Comments! Send latest premium action Automation filtering Free API subscribers Surveys in automations Reply to replies Labels for RSS feeds How Jeremy Singer-Vine curates curious datasets for readers 2023 (and what's next) Email vs web content Sort by engagement Better gift subscriptions How Andy Dehnart built a career reviewing television New email template Email-based automations Opt-in reply tracking Automatic alt text More social network integrations Sort by metadata Overlarge image warnings Automation tag actions Pause emails mid-flight Search tags and automations Gift via automations
Tag statistics
Justin Duke · 2023-08-09 · via Buttondown's blog

If you're using tags to segment your users — either by ingress (where they're coming from) or by content (what language they prefer, what genre of content they're interested in), you can now get analytics on how those tags are performing — specifically the "core four", a term I just made up: open rate, click rate, retention rate, and overall count.
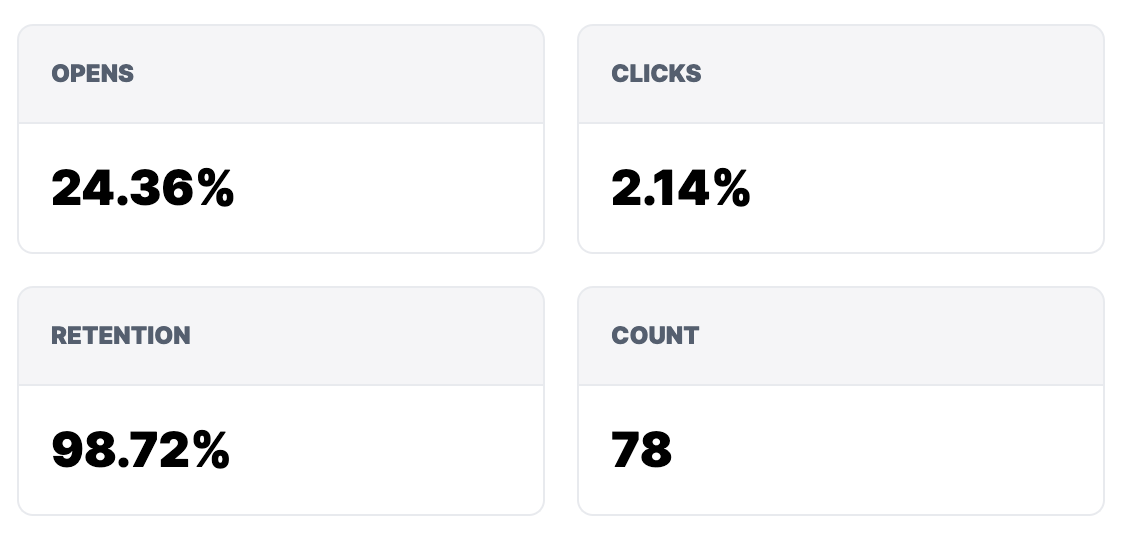
An example table of how tag analytics look.

This is, admittedly, not a very fancy view at the moment. This is for boring reasons — I'm working on some underlying architectural changes to not just tag analytics but automation analytics and survey analytics to make them all unified. But at the very least, you get high-level information about how your cohorts are performing without having to bust out the abacus (or, more likely, a Google Sheet).