





This is the eighth edition of the SRE Report. Eight years of tracing reliability's arc, from uptime obsession to experience, from toil to intelligence, from systems to people.
This year's report is also the first since Catchpoint joined LogicMonitor. We want to acknowledge their support in keeping this work going. They get what this report means to the reliability community, and that matters.
We made a deliberate choice this year to say less. With so much being written so easily, we felt it was right to pare it back. The result is a leaner, quieter report, one that lets the data do the talking.
As in past years, the data revealed a mix of progress and persistent gaps – some expected, some not. In almost every case, the gaps widen when visibility thins out. Here’s what we largely anticipated, what genuinely caught us off guard.
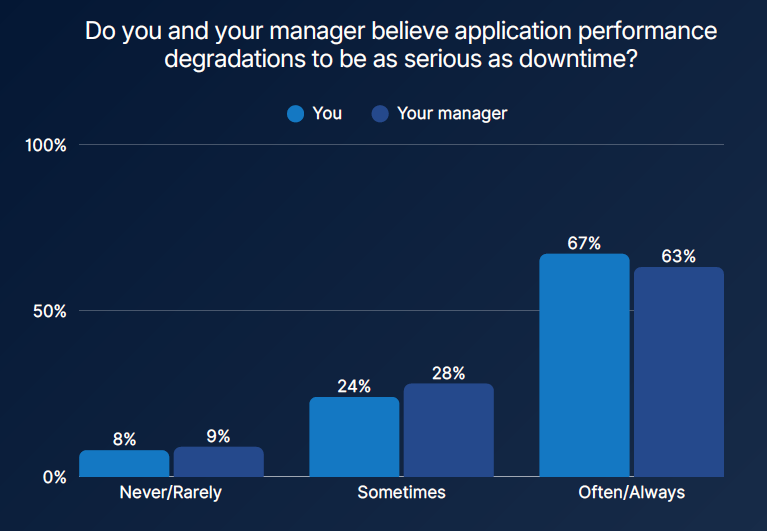
For the second year running, 67% of respondents agree that performance degradations are as serious as downtime.
This one feels settled now. Slow is down. Users experience both as failure. The business measures both as lost opportunity, and this belief seems stable. The harder part is keeping pace with that belief. If you are not monitoring from where users actually are, your view of reliability is incomplete.
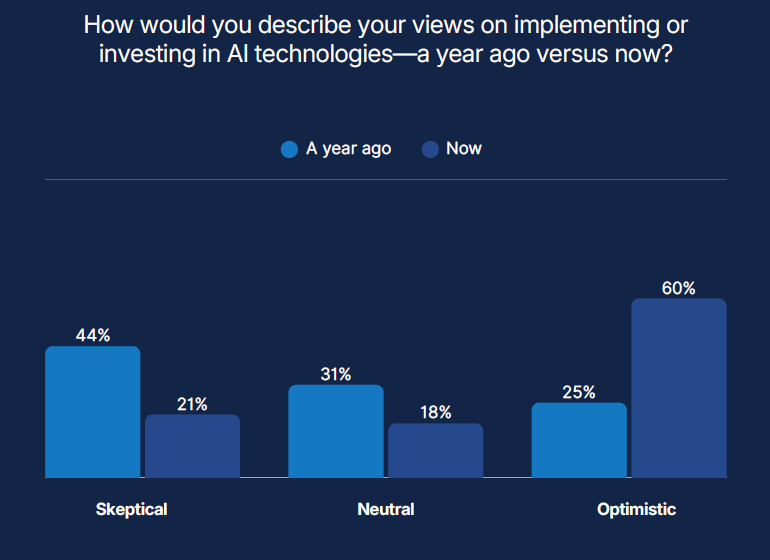
AI sentiment shifted dramatically in 2025. A year ago, 44% of respondents reported skepticism, and only 25% described themselves as optimistic; today, skepticism has dropped to 21%, while optimism has climbed to 60%.
That swing matches what many teams, and many of us personally, experienced. Over the past year, AI tools matured, use cases moved from experiments to daily practice, and organizations started to see tangible wins in triage, anomaly detection, and incident routing. The enthusiasm felt earned. The real surprise would come later, in how little day‑to‑day toil actually shifted
We expected to see progress here.
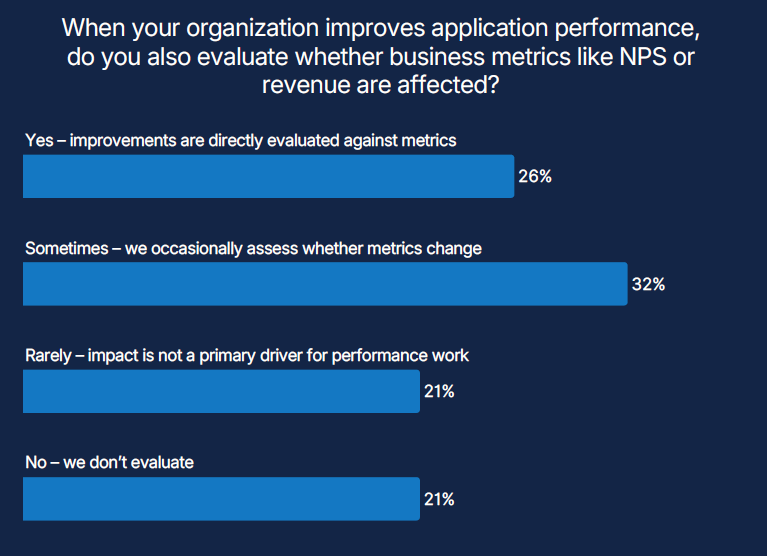
There was an expectation that, after years of urging teams to link reliability to business outcomes, more organizations would be closing that gap. Instead, the data shows how stubborn it remains (and this wasn’t the only data set indicating as such).
Only 26% of organizations directly evaluate whether performance improvements affect business metrics like NPS or revenue. Just 22% financially model the cost of downtime or degradation in ways that inform decisions.
That means three-quarters of teams improve reliability without checking whether the business noticed. Half either skip financial modeling entirely or rely on rough, informal estimates.
This raises a key question: how do you justify investment in reliability work if you can't connect it to what the business measures?
The findings also reveal a pattern. Many organizations treat slow performance as seriously as downtime (67% agree), yet most stop short of modeling the business cost of either. The belief is there. The measurement is not.
Maybe your organization has figured this out. Maybe you've found ways to tie performance work directly to revenue, churn, or customer satisfaction. If so, you're in the minority. And we’d be curious to know how you got there.
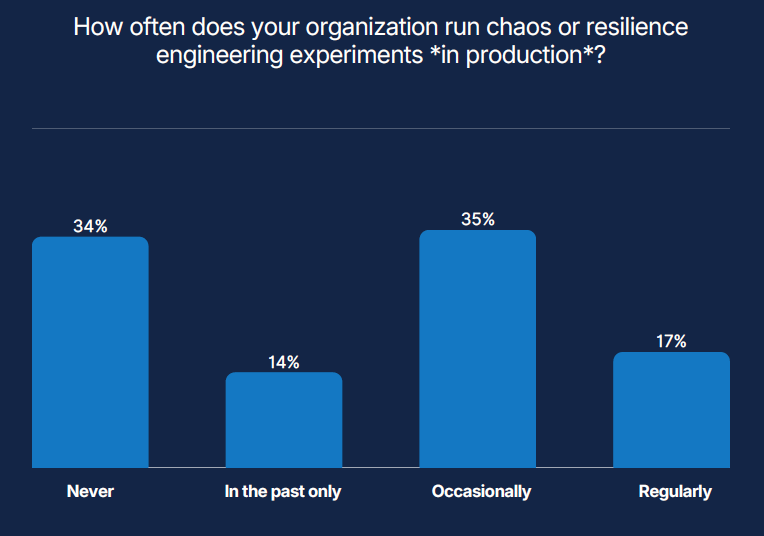
17% of organizations run chaos experiments regularly. 34% have never tested failure in production.
This one surprised us more than it probably should have.
The logic seems straightforward: test failure before failure tests you. Find weak points in controlled conditions rather than during an incident. Build confidence through practice.
Yet most organizations stop short. Some cite risk. Others point to organizational culture or lack of executive support. The reasons vary, but the result is the same: resilience remains theoretical rather than proven.
The data also shows something interesting. Among teams that do run chaos experiments regularly, tolerance for planned failure is higher. Among those that don't, tolerance is lower. Which comes first? Hard to say. Maybe both reinforce each other.
Interestingly, terminology appears to matter. When we asked respondents to choose a more relatable term for chaos engineering, 41% picked "Resilience Engineering" and 40% chose "Resilience Testing." Only 29% stuck with "Chaos Engineering."
Does renaming it make adoption easier? Or does the hesitation run deeper than terminology?
Whatever we call it, if teams cannot observe the effect of disruption on real user experience, there is little value in intentionally breaking or slowing systems.
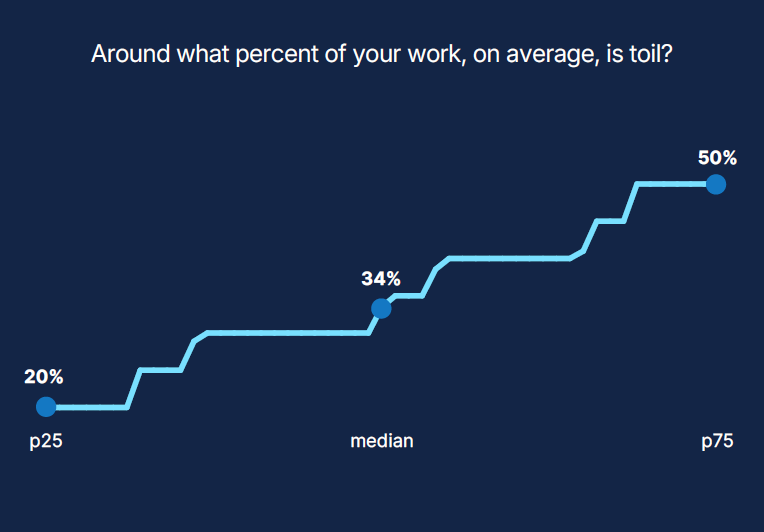
As hinted at earlier, the surprise was not the rise in AI optimism; that part tracked with the stories shared across the community. The surprise was how little that optimism, and those tools, moved the needle on toil.
Despite high AI adoption, half indicated spending 34% of their time on repetitive, low-value work. That's roughly the same as last year, maybe slightly higher even.
AI reduced some toil. Nearly half (49%) of respondents said it decreased their workload. But 35% saw no change, and 16% said it increased toil.
What gives?
One explanation is that AI has redistributed toil rather than removed it. It automated some tasks but introduced new ones. Prompt engineering. Model monitoring. Explaining AI-generated recommendations. Managing incidents caused by AI itself.
The work changed shape. The load didn't necessarily lighten.
The data also reveals a gap between ranks. 60% of directors said AI reduced toil, compared to 38% of individual contributors. Management sees efficiency at scale. Practitioners feel the friction at the keyboard.
Both perspectives are probably true.
These are snapshots, not verdicts. The data reflects 418 responses from practitioners across industries, company sizes, and geographies. Your mileage may vary.
Over the coming weeks, we'll revisit the report findings in more detail. For now, read the full report and see where your organization sits relative to the community. Compare notes. Question assumptions.
Reliability grows stronger when we examine it from every angle, not just when we agree.
If you want the story behind the report, the numbers, decisions and data-care that made the reserch defensible, read “The SRE Report 2026: Defensible Ns
This is the eighth edition of the SRE Report. Eight years of tracing reliability's arc, from uptime obsession to experience, from toil to intelligence, from systems to people.
This year's report is also the first since Catchpoint joined LogicMonitor. We want to acknowledge their support in keeping this work going. They get what this report means to the reliability community, and that matters.
We made a deliberate choice this year to say less. With so much being written so easily, we felt it was right to pare it back. The result is a leaner, quieter report, one that lets the data do the talking.
As in past years, the data revealed a mix of progress and persistent gaps – some expected, some not. In almost every case, the gaps widen when visibility thins out. Here’s what we largely anticipated, what genuinely caught us off guard.
For the second year running, 67% of respondents agree that performance degradations are as serious as downtime.
This one feels settled now. Slow is down. Users experience both as failure. The business measures both as lost opportunity, and this belief seems stable. The harder part is keeping pace with that belief. If you are not monitoring from where users actually are, your view of reliability is incomplete.
AI sentiment shifted dramatically in 2025. A year ago, 44% of respondents reported skepticism, and only 25% described themselves as optimistic; today, skepticism has dropped to 21%, while optimism has climbed to 60%.
That swing matches what many teams, and many of us personally, experienced. Over the past year, AI tools matured, use cases moved from experiments to daily practice, and organizations started to see tangible wins in triage, anomaly detection, and incident routing. The enthusiasm felt earned. The real surprise would come later, in how little day‑to‑day toil actually shifted
We expected to see progress here.
There was an expectation that, after years of urging teams to link reliability to business outcomes, more organizations would be closing that gap. Instead, the data shows how stubborn it remains (and this wasn’t the only data set indicating as such).
Only 26% of organizations directly evaluate whether performance improvements affect business metrics like NPS or revenue. Just 22% financially model the cost of downtime or degradation in ways that inform decisions.
That means three-quarters of teams improve reliability without checking whether the business noticed. Half either skip financial modeling entirely or rely on rough, informal estimates.
This raises a key question: how do you justify investment in reliability work if you can't connect it to what the business measures?
The findings also reveal a pattern. Many organizations treat slow performance as seriously as downtime (67% agree), yet most stop short of modeling the business cost of either. The belief is there. The measurement is not.
Maybe your organization has figured this out. Maybe you've found ways to tie performance work directly to revenue, churn, or customer satisfaction. If so, you're in the minority. And we’d be curious to know how you got there.
17% of organizations run chaos experiments regularly. 34% have never tested failure in production.
This one surprised us more than it probably should have.
The logic seems straightforward: test failure before failure tests you. Find weak points in controlled conditions rather than during an incident. Build confidence through practice.
Yet most organizations stop short. Some cite risk. Others point to organizational culture or lack of executive support. The reasons vary, but the result is the same: resilience remains theoretical rather than proven.
The data also shows something interesting. Among teams that do run chaos experiments regularly, tolerance for planned failure is higher. Among those that don't, tolerance is lower. Which comes first? Hard to say. Maybe both reinforce each other.
Interestingly, terminology appears to matter. When we asked respondents to choose a more relatable term for chaos engineering, 41% picked "Resilience Engineering" and 40% chose "Resilience Testing." Only 29% stuck with "Chaos Engineering."
Does renaming it make adoption easier? Or does the hesitation run deeper than terminology?
Whatever we call it, if teams cannot observe the effect of disruption on real user experience, there is little value in intentionally breaking or slowing systems.
As hinted at earlier, the surprise was not the rise in AI optimism; that part tracked with the stories shared across the community. The surprise was how little that optimism, and those tools, moved the needle on toil.
Despite high AI adoption, half indicated spending 34% of their time on repetitive, low-value work. That's roughly the same as last year, maybe slightly higher even.
AI reduced some toil. Nearly half (49%) of respondents said it decreased their workload. But 35% saw no change, and 16% said it increased toil.
What gives?
One explanation is that AI has redistributed toil rather than removed it. It automated some tasks but introduced new ones. Prompt engineering. Model monitoring. Explaining AI-generated recommendations. Managing incidents caused by AI itself.
The work changed shape. The load didn't necessarily lighten.
The data also reveals a gap between ranks. 60% of directors said AI reduced toil, compared to 38% of individual contributors. Management sees efficiency at scale. Practitioners feel the friction at the keyboard.
Both perspectives are probably true.
These are snapshots, not verdicts. The data reflects 418 responses from practitioners across industries, company sizes, and geographies. Your mileage may vary.
Over the coming weeks, we'll revisit the report findings in more detail. For now, read the full report and see where your organization sits relative to the community. Compare notes. Question assumptions.
Reliability grows stronger when we examine it from every angle, not just when we agree.
If you want the story behind the report, the numbers, decisions and data-care that made the reserch defensible, read “The SRE Report 2026: Defensible Ns
此内容由惯性聚合(RSS阅读器)自动聚合整理,仅供阅读参考。 原文来自 — 版权归原作者所有。