



在哪些情况下,必须祭出一些复杂的调试器呢?大概有以下:
内存泄露有.Net Memory Profiler神器情况下,能比windbg更容易找到问题(当然限于托管代码内存泄露,许多非托管的还是比较难搞). 参考 使用.Net Memory Profiler 分析.Net程序内存泄露
同样CPU监控工具也有ANT Profiler 之类工具.
但总有一些BUG难以重现,特别是在非开发机器出现,此时抓个dump,可能更为方便.
下面就以一个demo为例简单使用windbg 分析程序崩溃和挂起这两种情况.
异常的最佳实践
按照我的经验,很多代码反映出的是---不知道什么是异常,什么时候抛异常,什么地方捕获异常,或有日志,连个堆栈信息都看不到.
如何编写正确的代码才是,这应当才是问题的根源.再方便的调试的工具,耗费的时间也依然很多.
我很长时间用不上windbg是因为.NET程序调试太为简单了.
关于使用异常推荐一篇文章
http://www.codeproject.com/Articles/9538/Exception-Handling-Best-Practices-in-NET
下载安装后要配置symbol path

程序崩溃时弹出错误对话框之类.只要进程还没退出,也就是我们说”没飞”
使用Windows任务管理器创建转储文件
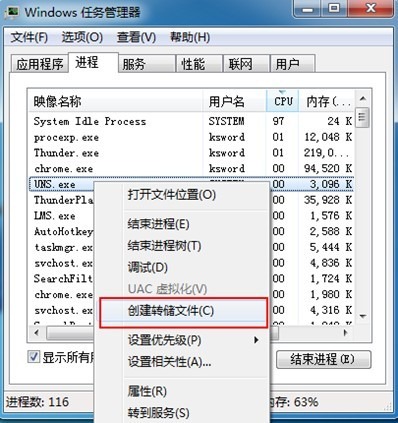
Windows xp 好像没这功能,不过也没关系,可以使用Process Explorer
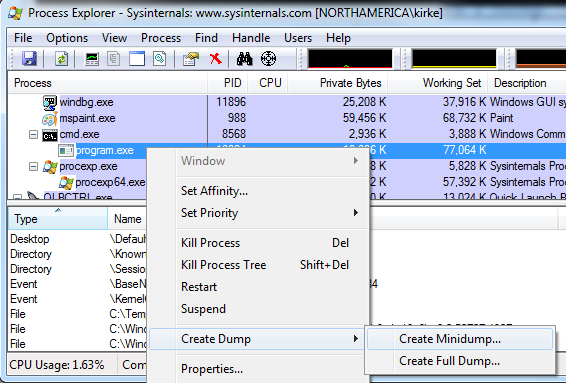
如何程序会”飞”,就得使用Windbg下的 ADPlus,监视某个进程,该进程崩溃时自动保存dump.
如:
adplus –quiet –crash –p 432 –o d:\debug
还有一种方法是,程序调用windows api自己生成dump.
以下以一个简单的Winform 程序演示:
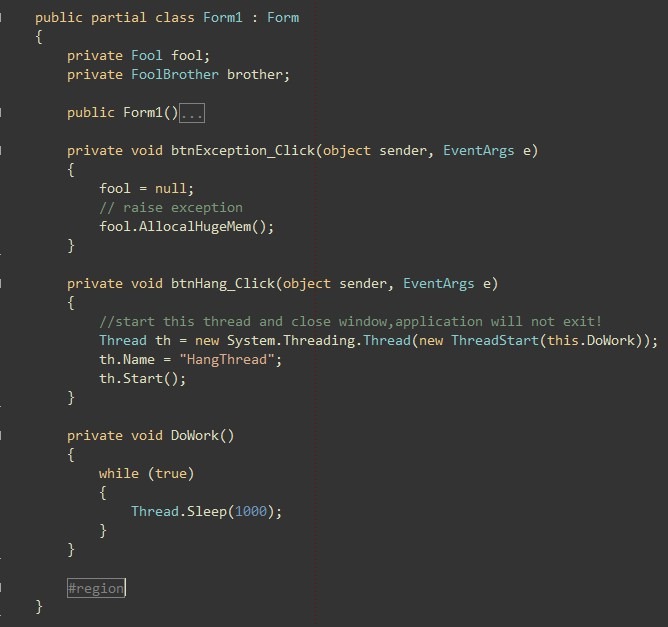
试验1: 查找异常源
点击button 触发 btnException_Click 产生异常,抓dump
首先加载组件扩展,如果客户机器和你的机器不一样要copy 客户机器的.net framework 文件:
如:
>>.load "E:\dmp\v4.0.30319\SOS.dll"
用!pe印详细异常信息:
0:000> !pe
Exception object: 017ed918
Exception type: System.NullReferenceException
Message: Object reference not set to an instance of an object.
InnerException: <none>
StackTrace (generated):
SP IP Function
0012EC78 002A0680 MemLeakProfileDemo!MemLeakProfileDemo.Form1.btnException_Click(System.Object, System.EventArgs)+0x10
0012EC80 592A4507 System_Windows_Forms_ni!System.Windows.Forms.Control.OnClick(System.EventArgs)+0x7f
0012EC94 592A6CA2 System_Windows_Forms_ni!System.Windows.Forms.Button.OnClick(System.EventArgs)+0xa2
0012ECAC 5988A4E0 System_Windows_Forms_ni!System.Windows.Forms.Button.OnMouseUp(System.Windows.Forms.MouseEventArgs)+0xac
0012ECC8 59853E11 System_Windows_Forms_ni!System.Windows.Forms.Control.WmMouseUp(System.Windows.Forms.Message ByRef, System.Windows.Forms.MouseButtons, Int32)+0x2d1
0012ED5C 59BF6A8F System_Windows_Forms_ni!System.Windows.Forms.Control.WndProc(System.Windows.Forms.Message ByRef)+0x8fc6ef
0012EDB4 59BFE3F1 System_Windows_Forms_ni!System.Windows.Forms.ButtonBase.WndProc(System.Windows.Forms.Message ByRef)+0x8ec9dd
0012EDF8 593119F8 System_Windows_Forms_ni!System.Windows.Forms.Button.WndProc(System.Windows.Forms.Message ByRef)+0x20
0012EE04 592FA393 System_Windows_Forms_ni!System.Windows.Forms.Control+ControlNativeWindow.OnMessage(System.Windows.Forms.Message ByRef)+0x13
0012EE0C 592FA311 System_Windows_Forms_ni!System.Windows.Forms.Control+ControlNativeWindow.WndProc(System.Windows.Forms.Message ByRef)+0x31
0012EE20 592FA256 System_Windows_Forms_ni!System.Windows.Forms.NativeWindow.Callback(IntPtr, Int32, IntPtr, IntPtr)+0x96StackTraceString: <none>
HResult: 80004003
或者使用 !analyze -v 查看异常.有了堆栈信息很明了.
或者我们再使用 !dumpheap看了托管堆里有哪些信息,此时我只关心 MemLeakProfileDemo 命名空间的对象,也就是我自己代码使用的.或者使用!dso 打印当前堆栈的对象
0:000> !dumpheap -type MemLeakProfileDemo
Address MT Size
017cd058 00226410 352
017d30e8 00226ba4 12
017d310c 00226c34 12
total 0 objects
Statistics:
MT Count TotalSize Class Name
00226c34 1 12 MemLeakProfileDemo.FoolBrother
00226ba4 1 12 MemLeakProfileDemo.Fool
00226410 1 352 MemLeakProfileDemo.Form1
Total 3 objects
Fool 对象只有一个. MT (Method Table)是00226ba4 ,在上面可以看到它的地址是017d30e8
再用do 命令查看该地址的信息:
0:000> !do 017d30e8
Name: MemLeakProfileDemo.Fool
MethodTable: 00226ba4
EEClass: 002b054c
Size: 12(0xc) bytes
File: C:\Users\jhwang\Documents\Visual Studio 2010\Projects\MemLeakProfileDemo\MemLeakProfileDemo\bin\Release\MemLeakProfileDemo.exe
Fields:
MT Field Offset Type VT Attr Value Name
00212990 400000c 4 ...yte[], mscorlib]] 0 instance 017d30f4 list
再顺藤摸瓜查看 它的fields, list 需要用 !dumpvc来看
0:000> !dumpvc 00212990 400000c
Name: System.Collections.Generic.IList`1[[System.Byte[], mscorlib]]
MethodTable: 00212990
EEClass: 631323c4
Size: 0(0x0) bytes
File: C:\Windows\Microsoft.Net\assembly\GAC_32\mscorlib\v4.0_4.0.0.0__b77a5c561934e089\mscorlib.dll
Fields:
这个列表是个空的.
试验2:查找线程挂起原因
点击另一个按钮触发btnHang_Click,然后关闭窗口,由于这个线程没有正确退出,进程不会退出,僵死在那里.抓dump然后打开.load sos后.
查看当前的线程:
0:000> !threads
ThreadCount: 3
UnstartedThread: 0
BackgroundThread: 2
PendingThread: 0
DeadThread: 0
Hosted Runtime: no
PreEmptive GC Alloc Lock
ID OSID ThreadOBJ State GC Context Domain Count APT Exception
0 1 1e68 003fe898 2016220 Enabled 019dd3f0:019ddfe8 003f8410 0 STA
2 2 11e4 00409cc8 b220 Enabled 00000000:00000000 003f8410 0 MTA (Finalizer)
5 3 14b4 00445430 200b020 Enabled 019c2014:019c3fe8 003f8410 0 MTA
STA 和MTA是个啥,我也不清楚.正常 program.cs 里常有这个
[STAThread] static void Main()
这个估计不是我们想看的,第二个MTA线程,看样子是GC之类的,那肯定是第三个了.切换到这个线程并看堆栈
0:003> ~5s
eax=001363c8 ebx=00000001 ecx=000003e8 edx=019c1458 esi=0455ef50 edi=00000000
eip=776b7094 esp=0455ef0c ebp=0455ef74 iopl=0 nv up ei pl nz na pe nc
cs=001b ss=0023 ds=0023 es=0023 fs=003b gs=0000 efl=00000206
ntdll!KiFastSystemCallRet:
776b7094 c3 ret
0:005> !clrstack
OS Thread Id: 0x14b4 (5)
Child SP IP Call Site
0455f034 776b7094 [HelperMethodFrame: 0455f034] System.Threading.Thread.SleepInternal(Int32)
0455f080 001a06ed MemLeakProfileDemo.Form1.DoWork() [C:\Users\jhwang\Documents\Visual Studio 2010\Projects\MemLeakProfileDemo\MemLeakProfileDemo\Form1.cs @ 80]
0455f088 6338b30b System.Threading.ThreadHelper.ThreadStart_Context(System.Object)
0455f098 63318004 System.Threading.ExecutionContext.Run(System.Threading.ExecutionContext, System.Threading.ContextCallback, System.Object, Boolean)
0455f0bc 63317f44 System.Threading.ExecutionContext.Run(System.Threading.ExecutionContext, System.Threading.ContextCallback, System.Object)
0455f0d8 6338b298 System.Threading.ThreadHelper.ThreadStart()
0455f2fc 69a1219b [GCFrame: 0455f2fc]
0455f5c0 69a1219b [DebuggerU2MCatchHandlerFrame: 0455f5c0]
对照代码.一切了然.
小结: sos本身的命令很多,用过的也不多,除了sos.dll 这个扩展以外,网上还有sosex,PssCor4 等调试扩展.稍微了解一点windbg也能给我们的生活easy一点.
source code: downoad
此内容由惯性聚合(RSS阅读器)自动聚合整理,仅供阅读参考。 原文来自 — 版权归原作者所有。