惯性聚合 高效追踪和阅读你感兴趣的博客、新闻、科技资讯
阅读原文 在惯性聚合中打开

推荐订阅源

Y
Y Combinator Blog
宝玉的分享
宝玉的分享
月光博客
月光博客
小众软件
小众软件
Jina AI
Jina AI
WordPress大学
WordPress大学
奇客Solidot–传递最新科技情报
奇客Solidot–传递最新科技情报
T
Tailwind CSS Blog
钛媒体:引领未来商业与生活新知
钛媒体:引领未来商业与生活新知
博客园 - 【当耐特】
博客园 - 三生石上(FineUI控件)
博客园 - 司徒正美
大猫的无限游戏
大猫的无限游戏
The Cloudflare Blog
G
Google Developers Blog
M
MIT News - Artificial intelligence
N
Netflix TechBlog - Medium
云风的 BLOG
云风的 BLOG
MyScale Blog
MyScale Blog
让小产品的独立变现更简单 - ezindie.com
爱范儿
爱范儿
U
Unit 42
freeCodeCamp Programming Tutorials: Python, JavaScript, Git & More
Blog — PlanetScale
Blog — PlanetScale

Sanity.io

A Board Game agent built using Sanity Context and Vercel's AI SDK | Sanity Build a prototype with Claude Code that your whole team can edit | Sanity What’s New - May 2026 | Sanity I built a London pub guide with v0 and the Sanity MCP in six hours. Here's what I learned. | Sanity Build a conference concierge with Agent Context and Anthropic | Sanity Build a content-aware Telegram agent with Vercel AI SDK and Chat SDK | Sanity How I used Agent API to generate photos for my family’s recipes | Sanity What’s New April - 2026 | Sanity Better context, better matches: An AI love story (for dogs) | Sanity How to write for an agent | Sanity Content Agent, meet Slack: AI content operations in your workflow | Sanity Structure powers intelligence | Sanity Your agent needs better content. Here's how to give it. | Sanity How to serve content to agents (a field guide) | Sanity Sanity TypeGen GA: Automatic TypeScript types for content and GROQ | Sanity Sanity is now available on the Vercel Marketplace | Sanity The logo soup problem (and how to solve it) | Sanity Content Releases: From scattered updates to coordinated publishing | Sanity What's New - February 2026 | Sanity How we solved the agent memory problem | Sanity v0 Builder Challenge: The winners | Sanity Introducing: Sanity Agent Skills | Sanity Content Agent: Days of work in one conversation | Sanity Our Sanity Values | Sanity Open Source Pledge 2025: Stepping up when it matters | Sanity v0 builder challenge: $3000 in prizes | Sanity Why AI Breaks Without Structured Content Operations | Sanity What’s New January - 2026 | Sanity BFCM 2025: What teams built when infrastructure stopped being the problem | Sanity How AI shaped holiday shopping and what it means for content in 2026 | Sanity
Visualize your content graph | Sanity
Alexander Staubo · 2020-11-18 · via Sanity.io

What is Graph View and where did it come from?

Recently Sanity had a distributed, virtual all-hands. As part of this, we held an internal hackathon where everyone came up with ideas for short projects that could be completed in a week. Graph View is the first of these projects we are releasing. The team behind it is Alexander Staubo, Marius Lundgård, Christian Flaaten, Bryan Robinson, Ørjan Ommundsen, and Will Luna.

When using Sanity, the collection of documents can grow quickly. Good modeling and organization requires that we understand how our data is connected. Without a holistic way to visualize how our dataset is shaped, there may be a lot of connections that go unnoticed, resulting in structures and decisions made with less intentionality than we like.

Graph View provides that perspective. It shows all documents in a dataset as nodes and the references running between them as vertices. For a larger dataset, like the sanity.io dataset, we could see a graph like this:
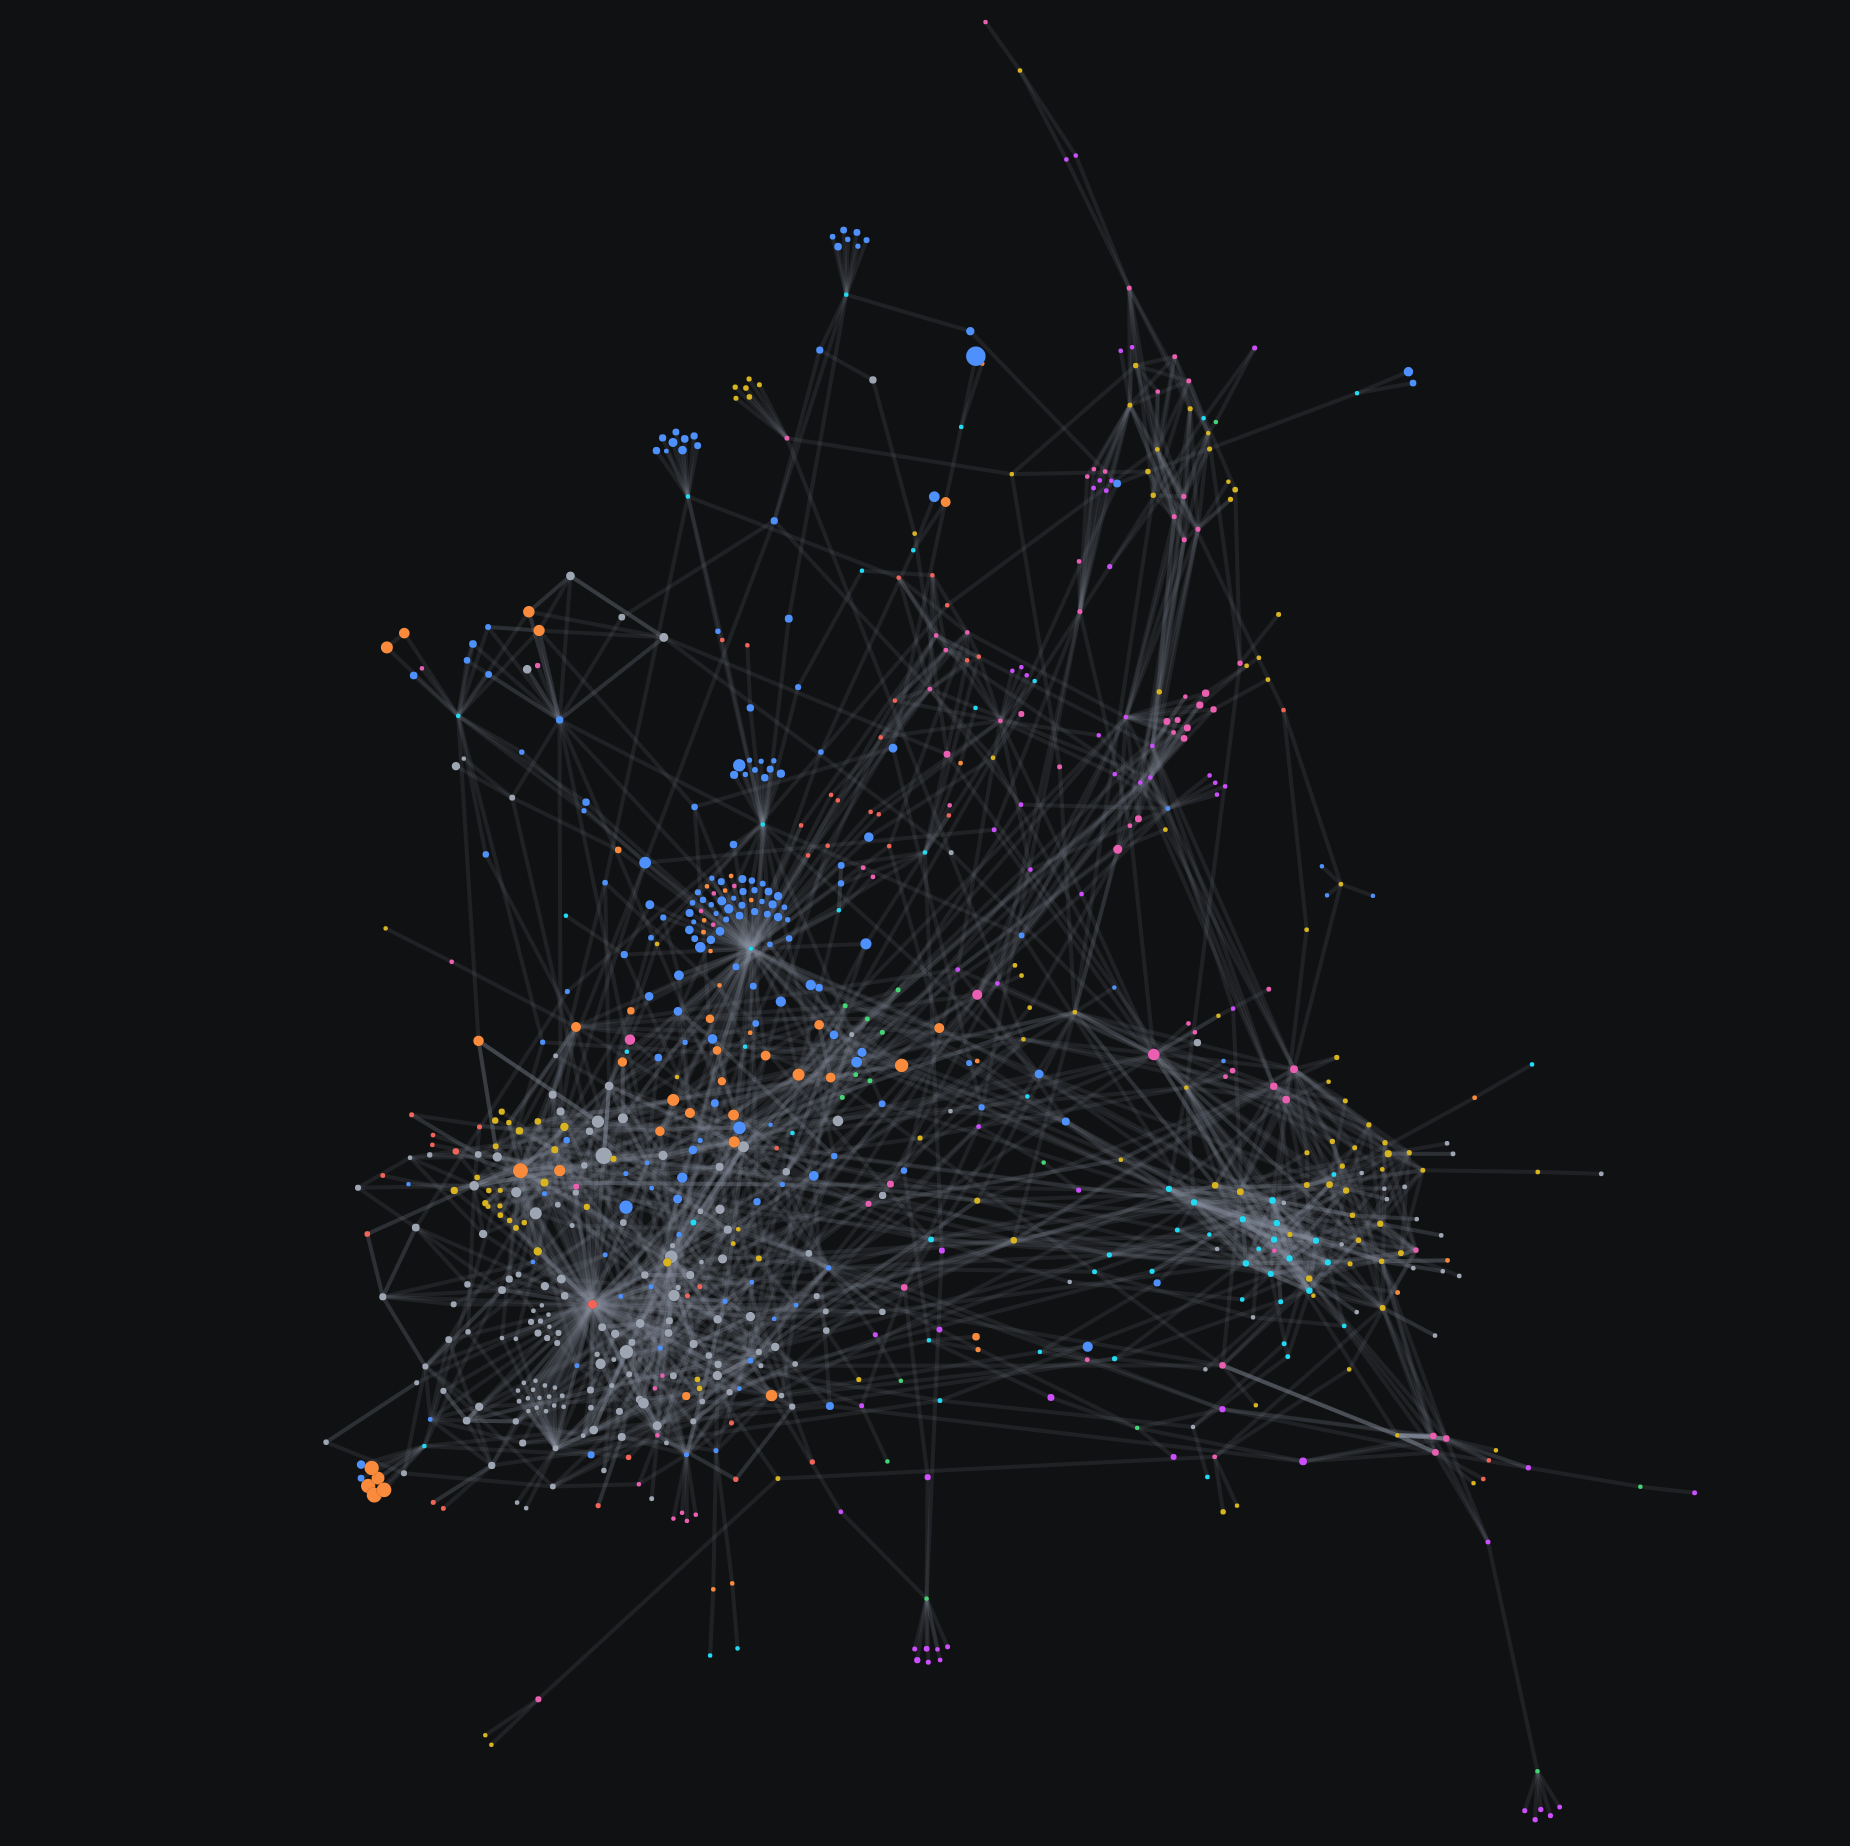
Web of data using Graph Tool plugin

The graph is implemented using the browser's 2D canvas, with the help of a JavaScript library called react-force-graph.

When you open the view for the first time, it grabs a snapshot of the entire document set (this takes time with huge datasets, since everything has to be downloaded first), and then listens to changes. Whenever someone edits documents or adds references between them, the graph updates with new vertices and edges.

A hovering marker, or avatar, appears next to a document when it's edited, indicating who on your team is editing it right now. This avatar isn't yet displayed for logged-in users who are viewing the document, but this is something we want to add in the future.

The GitHub repo for this plugin can be found here.

If you want to watch a video of Bryan and Kap running through this new feature, you can check that out here:

How to add it to the Studio

The plugin can be added to your current Sanity Studio by running the following command:

sanity install graph-view

Top bar of Sanity Studio with {} Graph added

Once added, you will see {} Graph added to the top bar of the Studio. The full npm package can be found here.

Benefits of Graph View

This graph is real-time. When documents are added or updated, the connection will grow or change accordingly.

While using this graph, you will notice patterns emerging which can tell you a lot about your data:
  1. Islands of information - An island of dots may mean that data isn’t being used to its full potential and adding a connection could help.
  2. Connections between data - You could discover structures in the data that were never realized initially. This could open up ideas for other connections.
  3. Important points in the data - There may be one dot that a lot of other documents rely on heavily. You can use this information to prioritize updating and maintaining these documents.
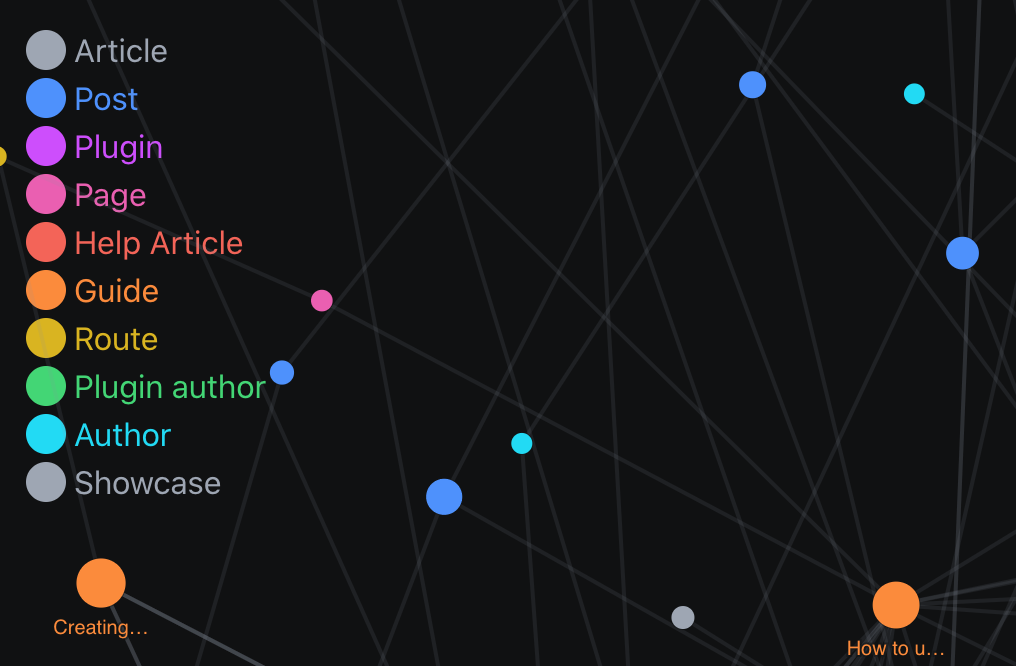
Key for the meaning of each dot in the Graph Tool

Real-time

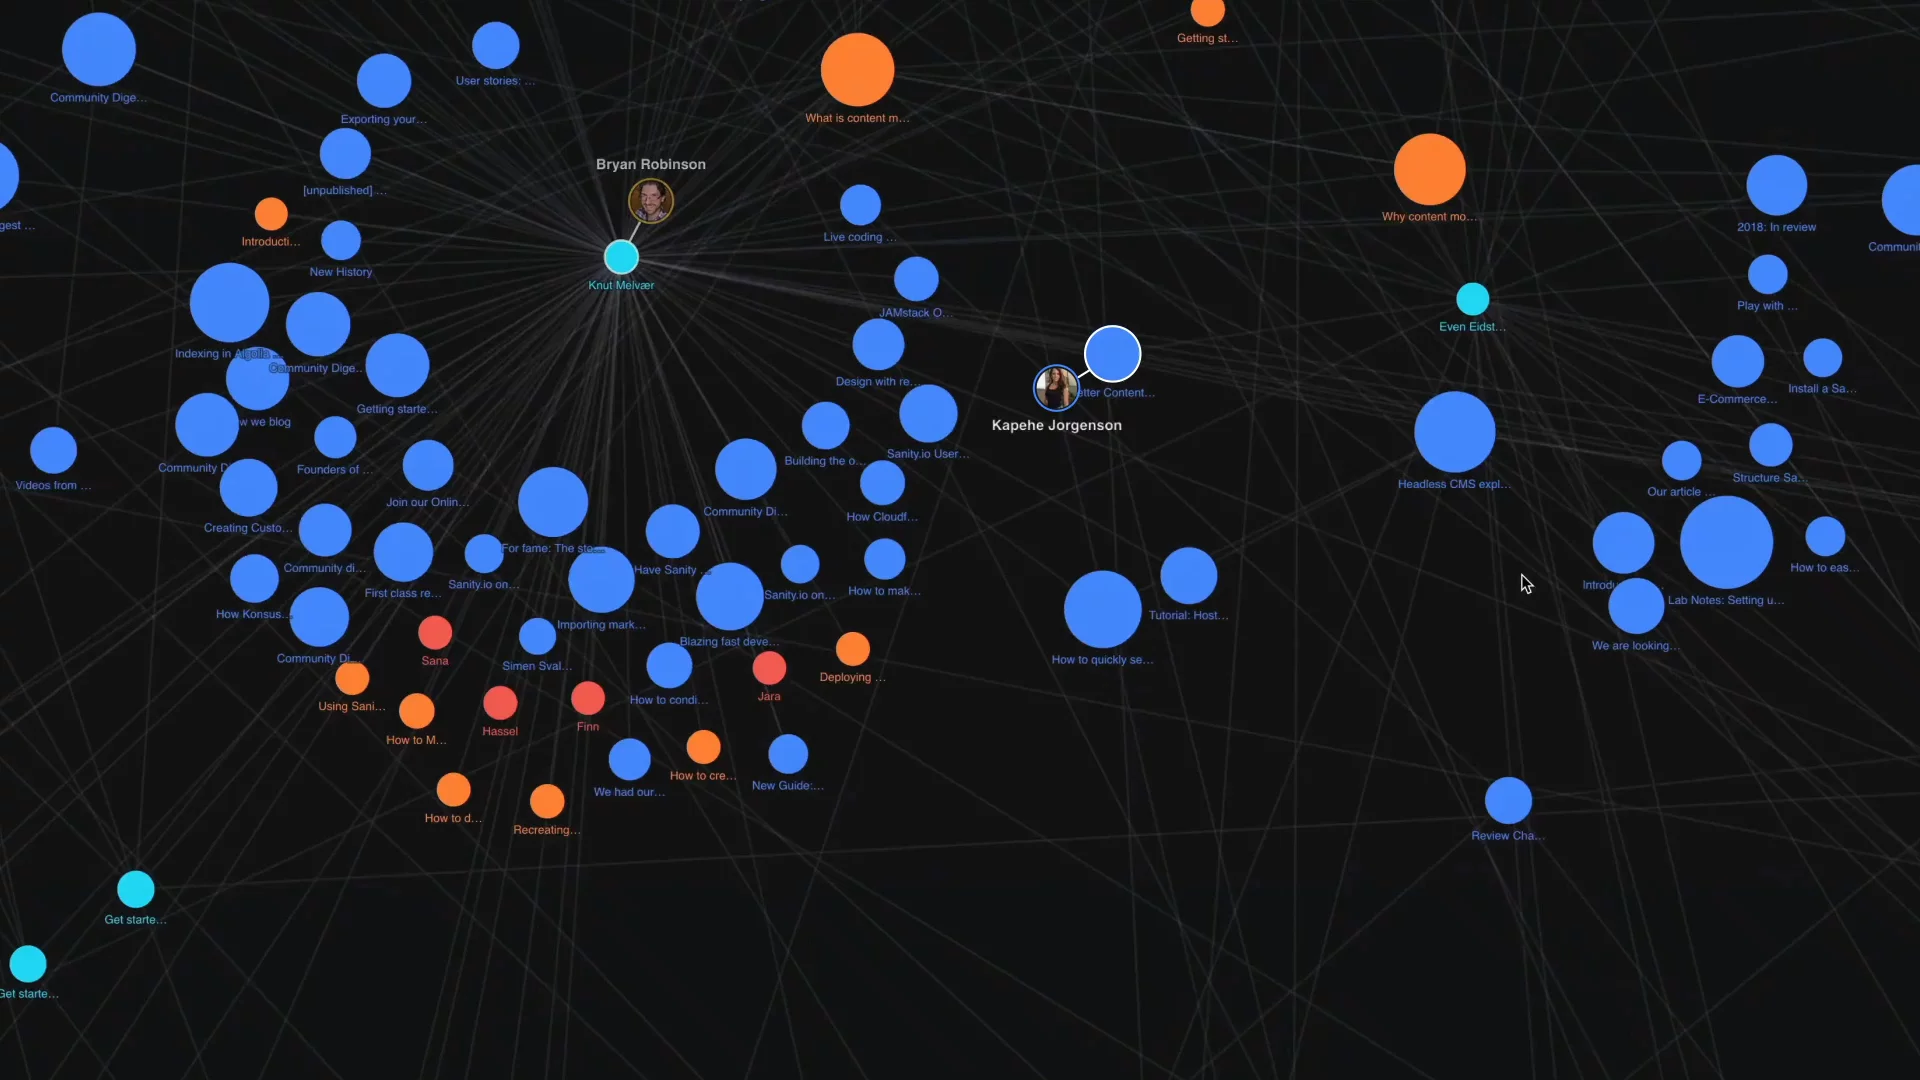
When someone is adding or editing data in the Studio, their avatar will show up and you will see exactly where they are in the Studio. The avatar moves as they move around the Studio. This is our collaborative Presence feature, shown in the graph view.
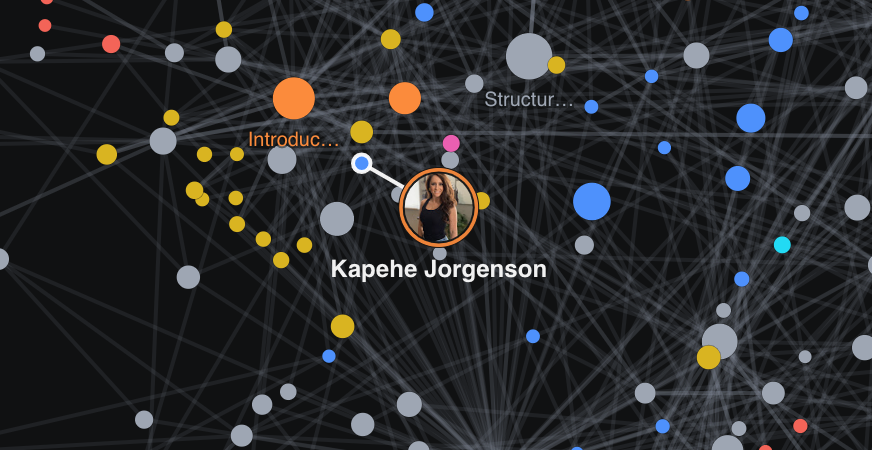
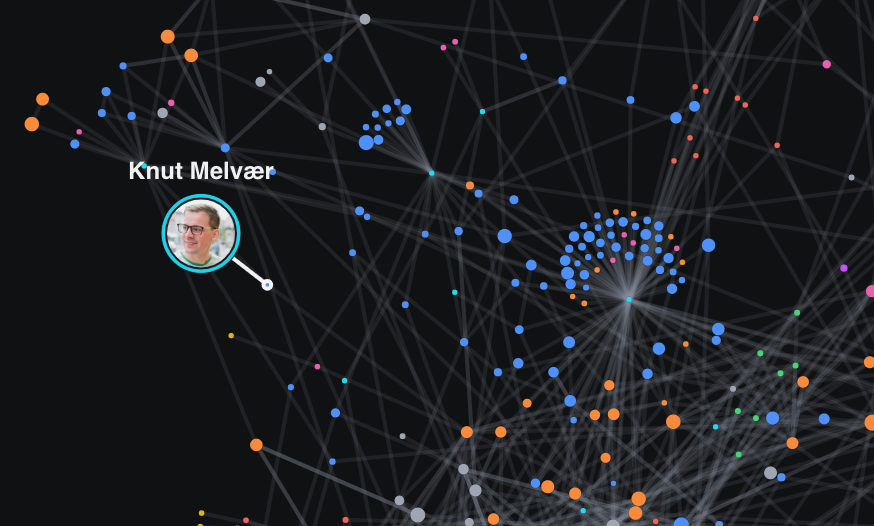
Graph Tool showing the avatar of person in studio
View of avatar in Graph Tool web

Available now

We are thrilled about this new plugin and are excited to see how beautiful your dataset graphs turn out. If you would like to share yours, post in the #i-made-this channel in the community where you can share your own instances of Graph View.

Run the command sanity install graph-view to get it up and running and check out just how interconnected your dataset is.