






Web analytics helps teams decide what to fix, where to invest and which channels deserve more attention. But those decisions are only as strong as the data behind them.
In Matomo’s Future of Web Analytics report, we surveyed web analytics professionals across multiple countries to understand how they assess the quality of their analytics data and the decisions they make with it. The results reveal an interesting contradiction: 92.3% of web analytics experts say they trust their current analytics data. Only 1.7% say they distrust it. At the same time, 84.3% say they’ve made a business decision based on analytics data they later questioned or found incomplete.
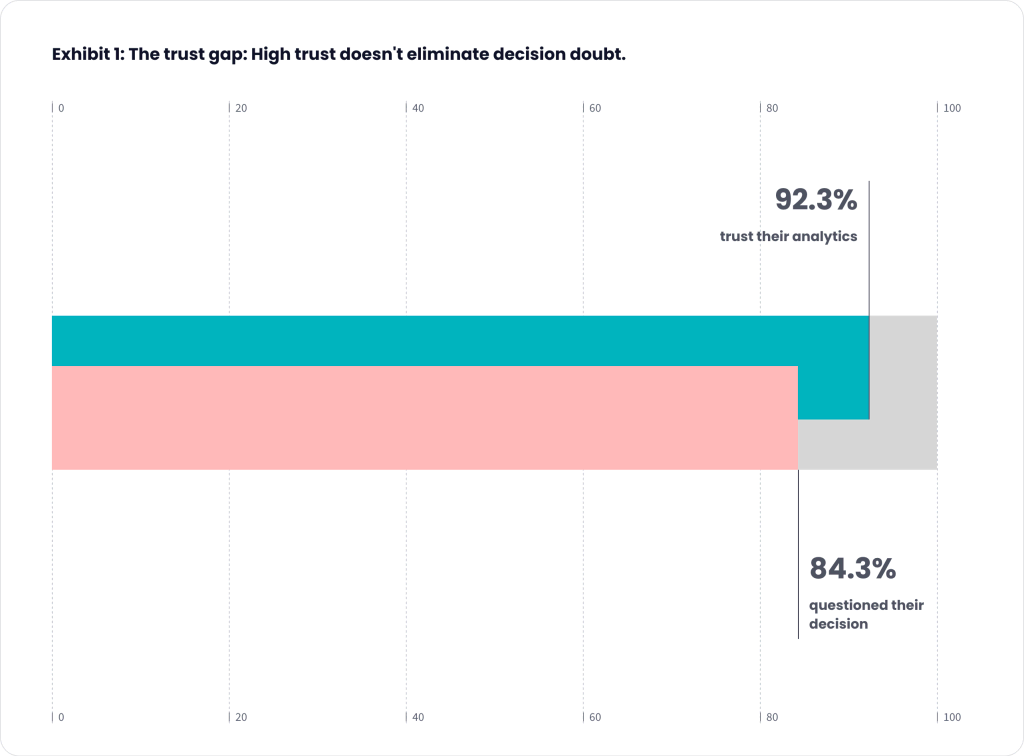
The issue usually appears at the point of decision. A team trusts the setup overall, then has to judge whether the data is strong enough for a specific choice like shifting budget, changing a campaign or redesigning a page.
Analytics data often looks solid at first glance. One channel looks stronger than the rest, or a landing page looks like it’s underperforming. But if tracking changed recently, consent settings reduced visibility, campaign tags are inconsistent or bot traffic affected the numbers, the decision rests on a partial picture.
Decision-ready analytics data doesn’t need to be perfect. It needs to be accurate, current and complete enough for the decision in front of you.
Data is decision-ready when it helps your team act with confidence and understand the limits before they become a problem.
In practice, your team should know:
One of the strongest themes emerging from the Future of Web Analytics report was that analytics maturity isn’t determined by how much data an organisation collects, but by how confidently teams understand its limitations. More data doesn’t automatically produce better decisions. Mature organisations recognise when data is reliable enough to act on, and when additional validation is needed.
When a team trusts its analytics setup overall but still lacks confidence in a specific decision, the problem often comes down to using broad metrics to answer questions that need more detailed context.
When that happens, the first report rarely gives the full answer. The team needs to check what sits behind the number: whether tracking changed, campaign tags were applied consistently, consent settings affected visibility or automated traffic skewed the results.
For example, a channel report might show which source brought in the most conversions. Before increasing spend, the team still needs to check whether campaign tags were applied consistently, whether the same conversion goal was used across the period and whether any tracking or consent changes affected the numbers.
The same logic applies when conversions drop after a landing page update. The page might be the issue, but the team should also check whether the form setup, traffic mix, tracking or consent layer changed around the same time.
Decision-ready data helps teams make those checks before the numbers turn into action.
Beyond marketing reporting, analytics data shapes budget allocation, campaign optimisation, conversion work, product priorities, executive dashboards and customer journey analysis. It also feeds into BI tools, CRM reporting and AI-assisted workflows.
If analytics data is used to shift budget, change campaigns or guide AI-assisted workflows, teams need to know what sits behind the numbers before they act. Otherwise, a tracking issue or missing context can quickly lead teams in the wrong direction.
For example, they might put more budget behind the wrong channel, change pages for the wrong reason or feed partial data into wider reporting and AI-assisted analysis.
The survey suggests that organisations increasingly view analytics quality as a strategic business capability rather than simply a reporting feature. Data accuracy and reliability were the strongest factors respondents considered when choosing a web analytics solution, selected by 55.3% overall. Accuracy led in every market: 61.0% in the US, 57.0% in Germany and 48.0% in France.
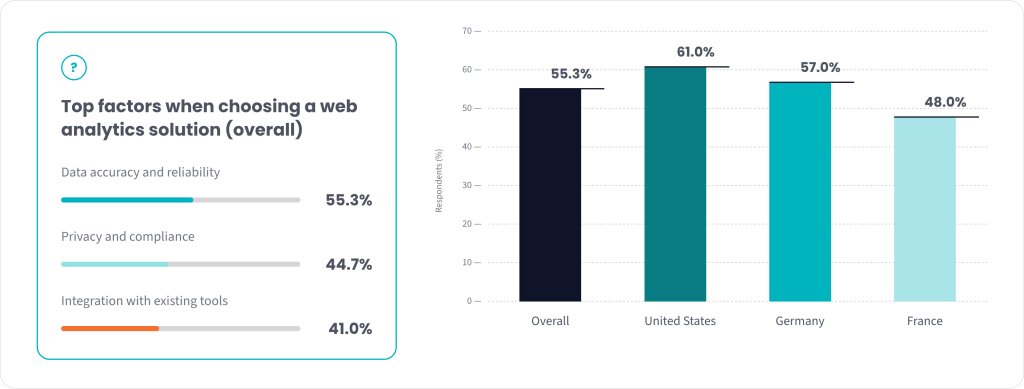
The survey also showed that confidence alone isn’t enough. Although almost every respondent trusted their analytics platform, the overwhelming majority had still questioned decisions after discovering missing or incomplete data.
That suggests teams need practical processes, not just good tools, to validate whether analytics is fit for the decision in front of them.
Before teams act on analytics data, they need to judge whether the numbers are strong enough for the decision. The level of checking should match the size and risk of the decision. A quick content update doesn’t need the same level of validation as a major budget shift or website redesign.
Use the following checks before analytics data turns into action.
Websites change, and analytics setups need to keep up. When new pages, forms, campaigns, consent settings, tags or ecommerce journeys are added or updated, tracking that worked a few months ago may no longer reflect what visitors experience today.
Before using analytics data for a meaningful decision, check whether the tracking behind that decision still behaves as expected. Look for missing events, duplicate tracking, unusual drops or spikes, and changes that line up with website releases, form updates, consent changes or campaign launches.
This check protects teams from treating a measurement issue as a performance issue. A drop in conversions might point to a real user problem, but it might also point to a changed form, missing event or broken tag.
If you use Matomo and want to review common causes of data quality issues and how to investigate them, Matomo’s data quality guide is a useful reference.
A metric only supports better decision-making when people understand what it means. In practice, the same word can mean different things across teams: “conversion” might refer to a form submission in one report, a trial signup in another and a qualified lead in a sales dashboard.
When definitions are unclear, people may agree on the number while disagreeing on what the number proves. Before making a decision based on analytics data, clarify:
Analytics data doesn’t have to answer every possible question, but it does need to answer the question your team is using it for. Before acting on the data, check whether any important context is missing for that specific decision, such as a key channel, a conversion step, a user segment, a consent-related gap or a recent tracking change. This is particularly important because the survey found that many analytics professionals discover data limitations only after decisions have already been made.
Ask yourself:
After answering these questions, the team should know whether the data is strong enough to use, or whether it needs another check before anyone acts on it.
Tracking issues are one common reason the data behind a decision looks more complete than it really is. Our “6 common Google Analytics tracking issues” article explains common tracking problems that can affect analytics decisions.
Traffic source reporting often influences budget and campaign decisions, which makes source classification especially important.
A source report can be misleading when campaigns are untagged, UTM parameters are inconsistent, referrals are misclassified or direct traffic includes visits from apps, documents, private browsers or other untracked paths. AI platforms add another layer because they change how people discover websites and move between sources.
Before acting on channel data, check:
A traffic source report should help teams understand where meaningful visits came from. If the classification is unclear, the investment decision built on top of it becomes weaker.
Not every visit represents a person with intent. Bots, spam, crawlers, AI agents and other automated activity distort analytics data when teams interpret all traffic as meaningful visitor behaviour. The effect varies by website and setup, but the risk grows when automated activity influences traffic trends, engagement rates or conversion analysis.
Signs worth investigating include:
Before using the data, check whether the traffic reflects real visitor behaviour or activity that should be filtered or reviewed separately.
For bigger decisions, the report should show more than the final number. It should also show what might affect how that number is read: recent tracking changes, consent limitations, attribution logic, segment definitions or anything else that changes how much confidence people should place in it.
Also check for:
The Future of Web Analytics report connects this to governance. Teams need a shared way to label the data behind important decisions: solid enough to act on, useful as a directional signal, or worth checking again before the decision moves forward.
Analytics data usually doesn’t stay in one tool. A campaign result might be checked in web analytics, compared with ad platform data, matched against CRM activity and pulled into a BI dashboard. Each system has its own rules and reporting limits, so teams need to understand why the numbers differ before they use them to make a decision.
Numbers won’t always match exactly across tools. Small differences are common and often harmless. But if web analytics, CRM, ad platforms or BI dashboards tell very different stories, teams need to understand why before they act.
Check whether:
When tools disagree, don’t start by trying to force one perfect number. Start by asking why the numbers differ, which system is closest to the action you’re measuring, and which source is most appropriate for the decision.
After these checks, the team should have a clearer view of what the data can safely support. Decision-ready analytics reduces the chance that missing context only becomes visible after the decision has already been made.
The findings from Matomo’s Future of Web Analytics Report suggest that trustworthy analytics is about understanding what your data represents, where its limitations lie and whether it’s reliable enough for the decision you’re about to make.
Every organisation wants confident decision-making. The teams that achieve it combine accurate measurement, clear governance and shared understanding of how their analytics should be interpreted.
Want to explore the full research? Download Matomo’s Future of Web Analytics Report to discover how analytics professionals across multiple markets evaluate data quality, privacy, AI, governance and the future of digital measurement.
Or, if you’re ready to improve the quality of your analytics data, start a free Matomo trial.
此内容由惯性聚合(RSS阅读器)自动聚合整理,仅供阅读参考。 原文来自 — 版权归原作者所有。