






Google Workspace (formerly G Suite) is a collection of cloud-based productivity and collaboration tools developed by Google. Today, millions of teams use Google Workspace (e.g., Gmail, Drive, Hangouts) to streamline their workflows. Monitoring Google Workspace activity is an essential part of security monitoring and audits, especially if these applications have become tightly integrated with your organization’s data. To help administrators monitor activity across their organizations, Google Workspace provides audit logs that you can now search, analyze, and alert on with Datadog, just like your other system and application logs.
Once you enable Datadog’s integration, you can monitor key events from Google Workspace’s audit logs, including:
Administrative access to Google Workspace (i.e., who is accessing the Admin console, creating new users, and suspending accounts)
Activity in Google Drive (e.g., file changes, shared files)
User login activity (e.g., successful and failed login attempts, suspicious logins)
Changes to a user’s account (e.g., password changes, account recovery changes)
You can search your Google Workspace audit logs for specific events like successful logins and correlate that activity with other key attributes like a user’s IP address or email address. Datadog lets you create facets on log attributes, so you can immediately begin analyzing trends in Google Workspace activity and create targeted alerts that automatically notify you of potential problems. And with Datadog’s Alert Center integration, you can automatically capture real-time security events generated by Google and monitor them alongside Workspace audit logs in Datadog’s Security Platform.
The Admin console gives administrators the ability to manage settings for all of your organization’s Google Workspace applications and user accounts. You can use Datadog to monitor key administrative activity, such as creating new user accounts or deleting users from your organization. For example, you can view all created users with the following search in the Log Explorer:
source:gsuite service:admin @evt.name:CREATE_USER
Audit logs provide details about the user as well as the administrator who created (or deleted) the user. This enables you to track critical processes like onboarding (or offboarding) a user. Having the right policies in place for offboarding a user, for example, can protect your data once someone leaves your organization.
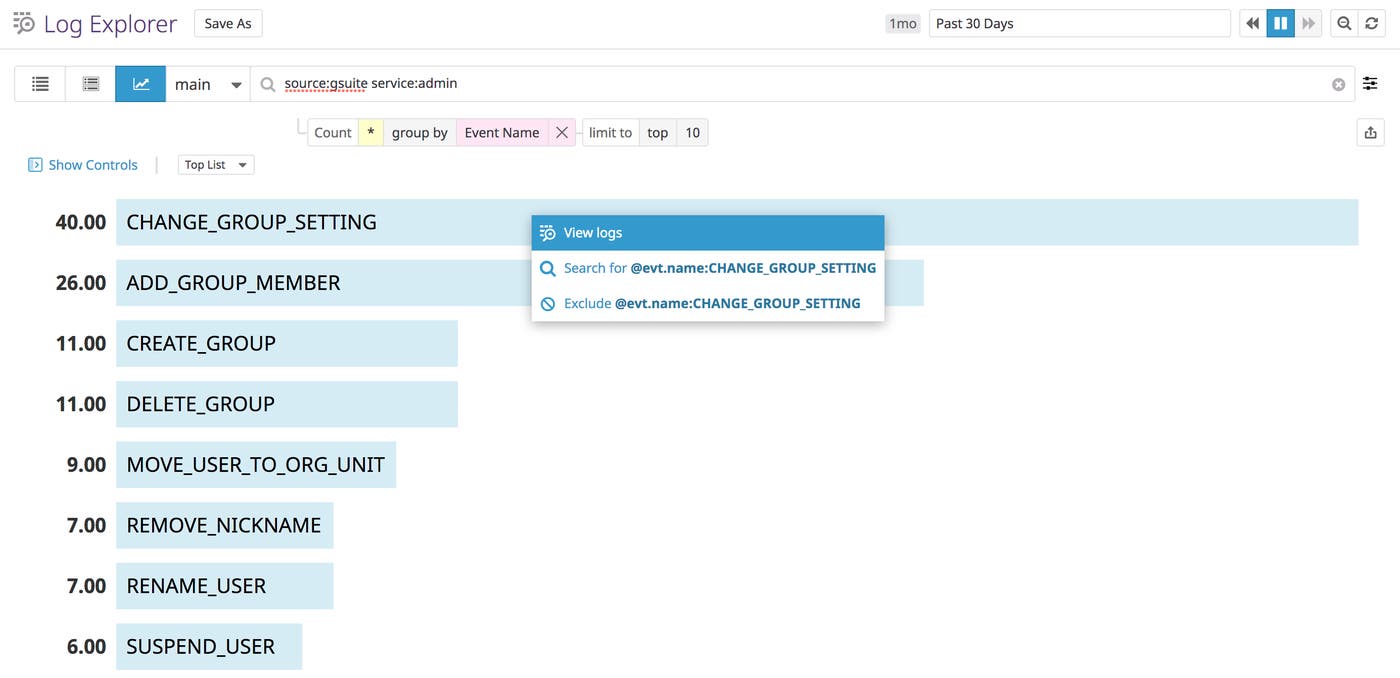
You can also analyze your Admin audit logs to track key trends. For example, you can track the most common types of Admin console activity in a toplist, then drill down to view individual logs for more details about a specific activity.
If your organization uses Google Drive, Datadog can help you track events such as when users create new files or share them with others. For example, you can see a Live Tail of all newly created files with this search:
source:gsuite service:drive @evt.name:create
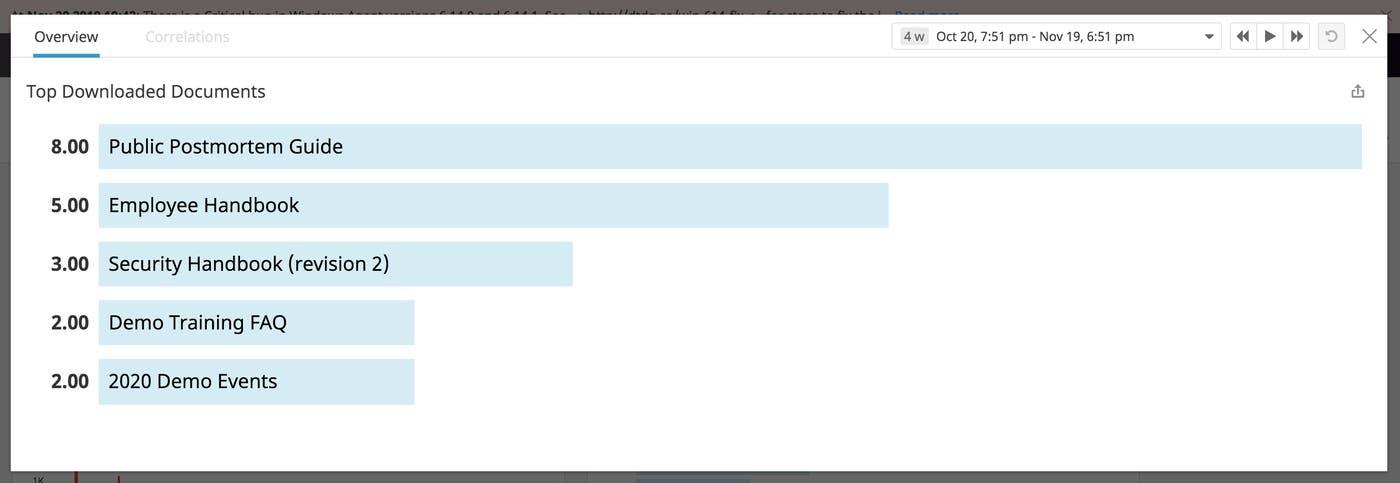
When you select an individual log, you can quickly see more information about the associated file, including its title, type (e.g., document, drawing, spreadsheet), visibility (e.g., public, shared via link), and owner. You can use this information to analyze Drive activity for all of your users. For example, you can monitor sharing activity by creating an alert for all files that are shared outside your domain, or you can create a toplist in Log Analytics to view the top downloaded documents.
In addition to capturing administrative and Drive activity, Google Workspace audit logs track login activity across your organization, such as successful (and failed) login attempts. For any login event, you can view information about how the user attempted to log in, the type of failure, and the email address used to log in.
This type of information is useful for troubleshooting login-related issues. For example, you can search for all successful login attempts:
source:gsuite service:login @evt.name:login_success
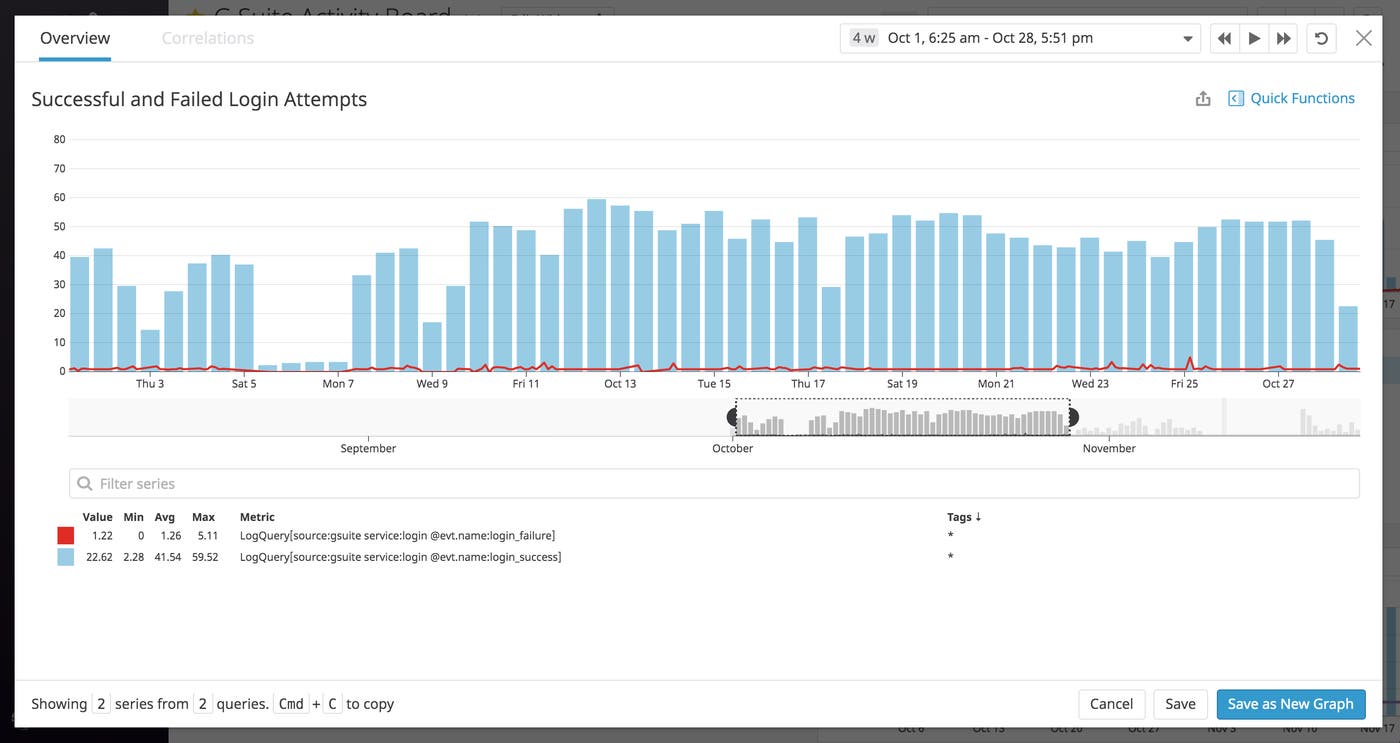
And, with Log Analytics, you can easily compare all successful logins (shown in blue) and failed attempts (shown in red), as seen in the example timeseries below.
Google Workspace marks a successful login attempt as suspicious if it detects that a user logged in from an unfamiliar IP address, and will include an attribute for it in its audit logs. You can create a facet on this attribute and easily search for all login attempts that are marked as suspicious.
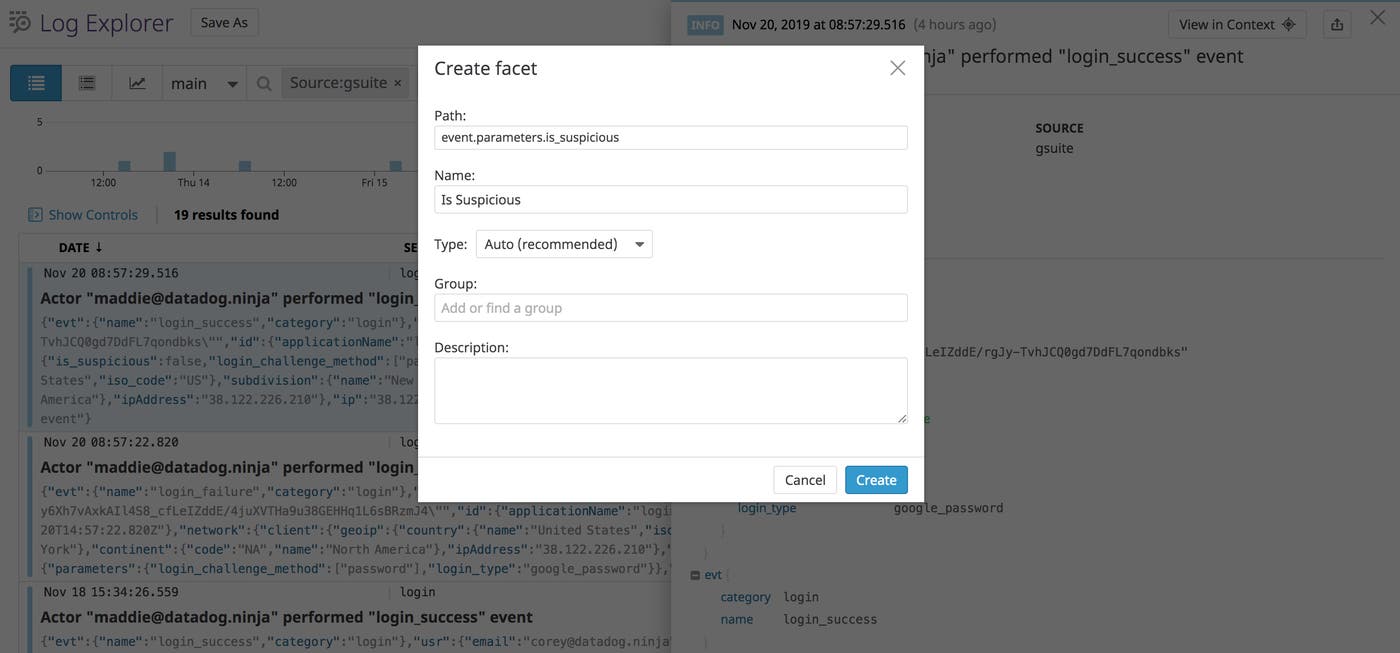
Or you can use this facet to create an alert that will automatically notify you if a suspicious login occurs, so you can follow up with the user to ensure that their account hasn’t been compromised.
Datadog also enables you to generate metrics from any log attribute. This means that you can create a metric for failed login attempts, and use anomaly detection to detect any unusual trends, as shown below.
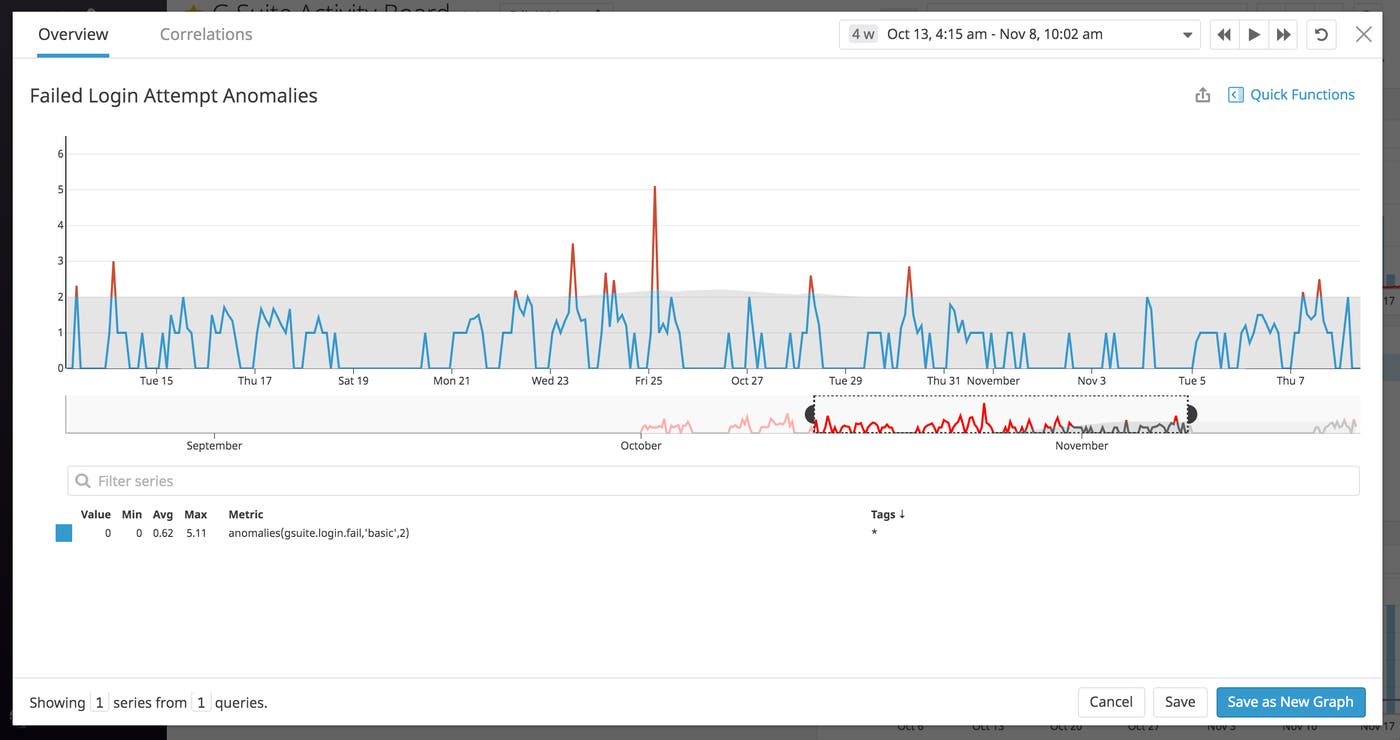
If you notice an abnormal spike in failed login attempts, you can click the graph to inspect the logs. Since each log contains key attributes such as a user’s email address, you can easily search on an attribute and correlate failed login attempts with other Google Workspace activity (e.g., changes to a user’s account).
Google Workspace audit logs can also help you track account activity, including when a user changes a password or updates their account recovery information (i.e., an email address, a phone number, and a secret question). As with any Google Workspace audit log, you can search for a subset of logs based on the type of user activity you’re interested in monitoring. For example, the following search helps you quickly find all logs related to changing an account password:
source:gsuite service:user_accounts @evt.name:password_edit
If you notice this activity in your logs for a specific user, you can follow up and take the appropriate action. Additionally, you can track if users have disabled 2-Step Verification (2SV) for their accounts by using the query below to create an alert:
source:gsuite service:user_accounts @evt.name:2sv_disable
If you get notified, you can quickly start troubleshooting and investigate if the change was unintentional or due to incorrect permissions.
For even greater visibility into Google Workspace activity, you can create Detection Rules on your audit logs and use them to quickly triage possible attacks or issues with a user’s account. For example, you can create a rule to detect when a user tries to log into their account with a leaked password and automatically notify your team with Slack, PagerDuty, or one of Datadog’s other collaboration integrations.
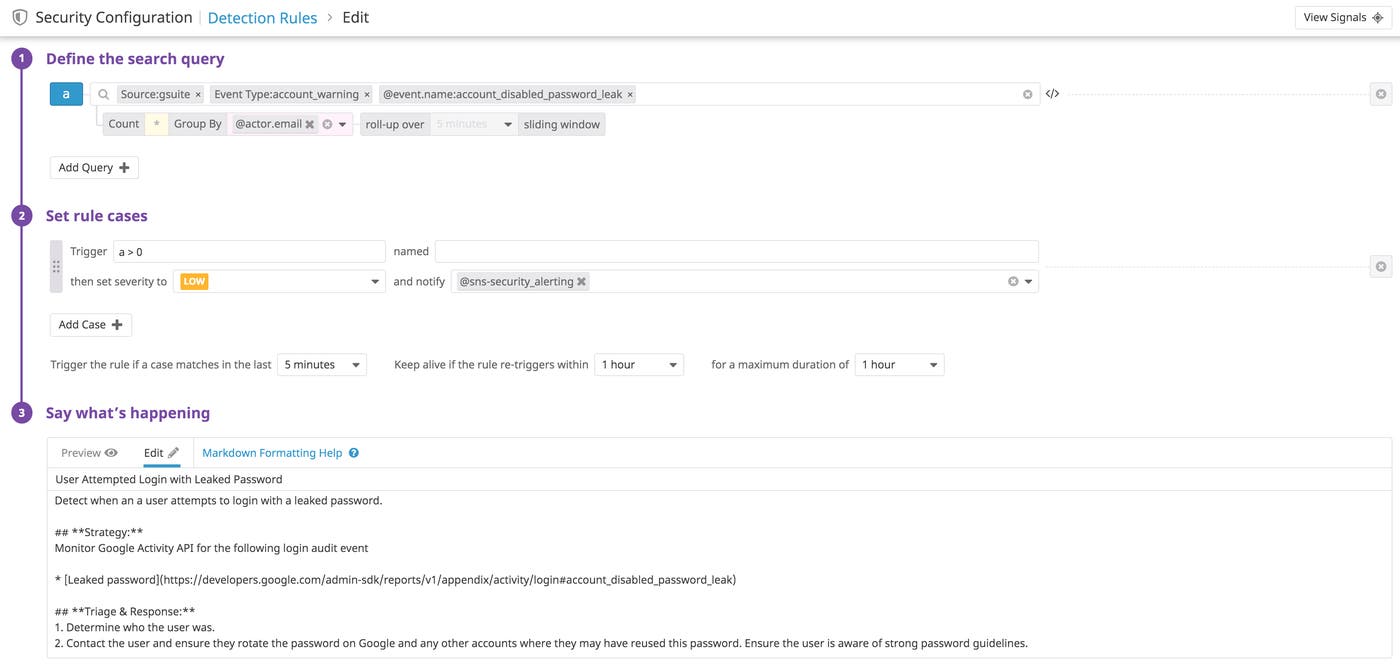
If this rule triggers, Datadog will create a security signal that you can search and filter on, so you can immediately begin investigating. All of your signals are aggregated in the Security Signals explorer, and each signal provides more context around the incident such as a timeline of events and information about the users who attempted to log in. This enables you to easily follow up with users and ensure they update their passwords for each affected account. You can read more about creating Detection Rules in our documentation.
Google Workspace also generates actionable security alerts with the Alert Center, notifying you of any threats to your workspace as soon as they happen. You can export alerts as logs to Datadog and automatically generate relevant security signals in the Security Platform, giving you instant visibility into any activity that Google has flagged as suspicious. This includes phishing and spoofing attacks, upticks in user-reported spam, account changes, and more.
Datadog’s Google Workspace and Alert Center integrations enable you to centralize audit logs and security events, so you can view activity across your entire workspace, be alerted to threats, and customize rules to match security policies in one place.
Google Workspace audit logs provide extensive information about administrative- and user-related activity across your organization, so you can gather all the context you need to troubleshoot issues, conduct audits, and detect suspicious activity. With Datadog, you can easily analyze and alert on these logs alongside your other infrastructure, security, and application logs—and archive them in cloud storage for security, technical, or business audits. And, if you need to access archived Google Workspace logs for any reason, you can retrieve them on demand.
Check out our documentation to learn more about collecting Google Workspace audit logs. Or, if you don’t already have a Datadog account, get started with a free 14-day trial.
此内容由惯性聚合(RSS阅读器)自动聚合整理,仅供阅读参考。 原文来自 — 版权归原作者所有。