







As teams adopt OpenTelemetry (OTel) to instrument their systems in a vendor-neutral way, they often face a challenge in effectively tracing activity throughout their entire stack, from frontend user interactions to backend services and databases. While OTel enables basic tracing, teams still need a way to access advanced capabilities like continuous profiling to adequately optimize performance and troubleshoot issues in their applications. Additionally, for these same OTel-instrumented applications, teams often struggle to connect backend traces with frontend performance data, making it difficult to see how backend issues affect user experience. This type of end-to-end monitoring that is integrated with tracing data typically requires more advanced tooling.
We are excited to announce that the Datadog platform’s SDKs now fully support OTel Tracing APIs, enabling the collection, processing, and visualization of unbroken end-to-end traces in Datadog through OTel. This means that you can now maintain vendor-neutral instrumentation and still get access to powerful Datadog products, like Continuous Profiler and Data Streams Monitoring, that draw upon tracing data—as well as frontend-focused products like Real User Monitoring that can map user activity to spans within traces. Additionally, Datadog’s support for OTel allows customers to draw upon OTel integrations to access tracing frameworks not yet natively supported by Datadog.
In this blog post, we’ll explain how you can integrate vendor-neutral tracing with the broader capabilities of the Datadog platform. Specifically, we’ll show you how to connect Datadog’s Real User Monitoring (RUM) with your OTel-instrumented backends, trace mobile applications within Datadog in a vendor-neutral way, and leverage OTel data via Datadog’s native backend tracing features. We’ll also cover how to use OTel-compatible frameworks for expanded distributed trace coverage.
A popular feature of Datadog RUM is that it allows you to link frontend user activity to backend traces, and now this functionality extends to OpenTelemetry-instrumented applications. That is, by drawing on the OTel-compatible W3C trace context propagation provided by the Datadog RUM SDKs, you can now access APM traces for OTel-instrumented apps from within the Datadog RUM UI.
Here’s how this RUM functionality works. Datadog’s latest RUM SDKs for web, iOS, Android, React Native, and Flutter applications automatically inject OTel-compatible trace context into network requests made by your frontend application. This enables the spans from your OTel-instrumented backend services to be tied to the original frontend interaction. Datadog connects the RUM resource event for the original network request back to APM trace data collected from its associated backend services, allowing you to easily switch between OTel-based tracing data and RUM.
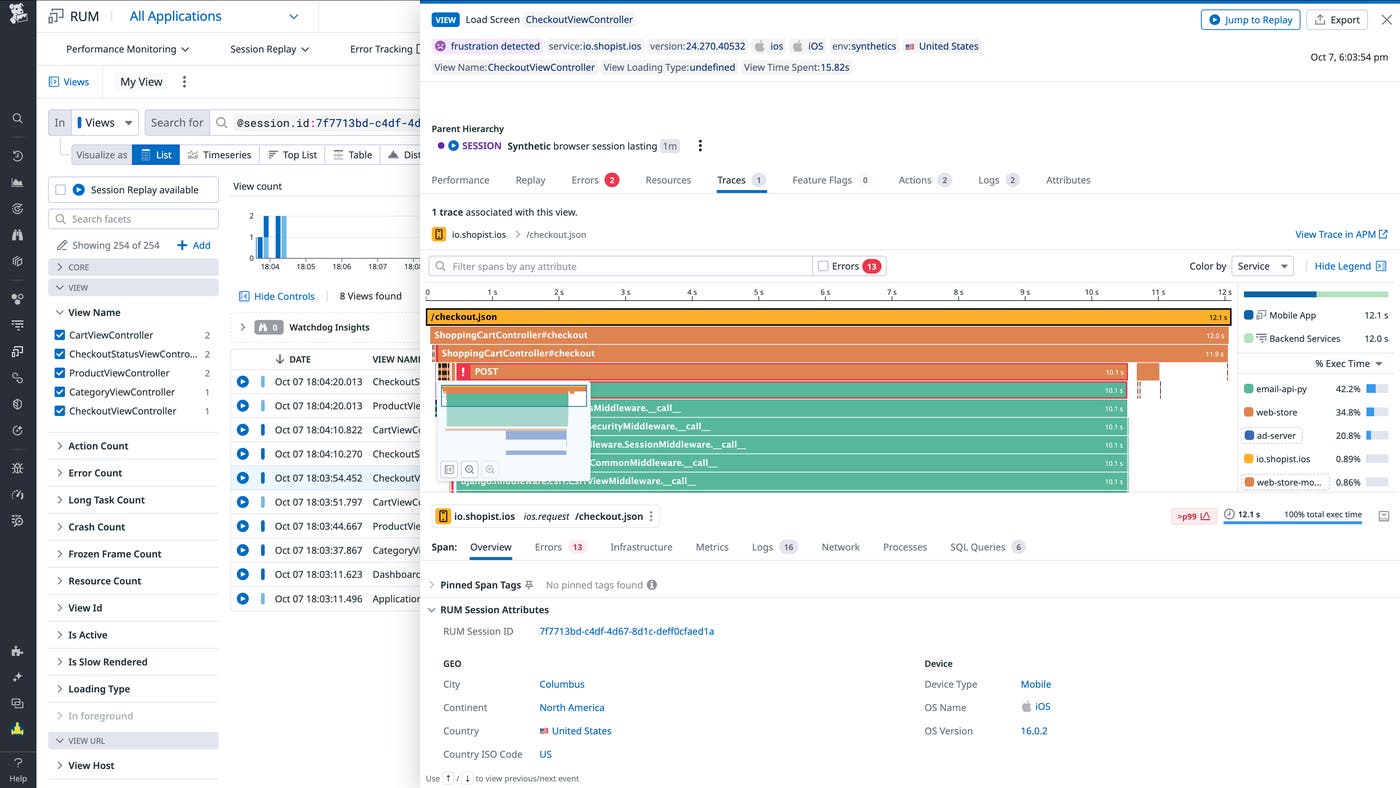
After ingesting OTel-generated traces, Datadog can associate those traces with user activity to help you investigate reported issues more thoroughly. For example, you can follow a link from a trace in APM to an associated session replay in RUM, allowing you to discover the steps users took before and after an issue. You can also view OTel traces alongside product analytics and performance metrics to gain more context about those traces.
This end-to-end correlation between user actions and backend traces enables faster troubleshooting of your OTel-instrumented applications. For example, if frustration signals spike on a login page, you can trace the issue from RUM data to the backend service causing the delay. By correlating RUM and OTel data, you can quickly pinpoint and resolve issues across your entire stack, from frontend performance problems to backend errors.
To get started correlating vendor-neutral tracing with RUM user interactions, follow the instrumentation steps described here.
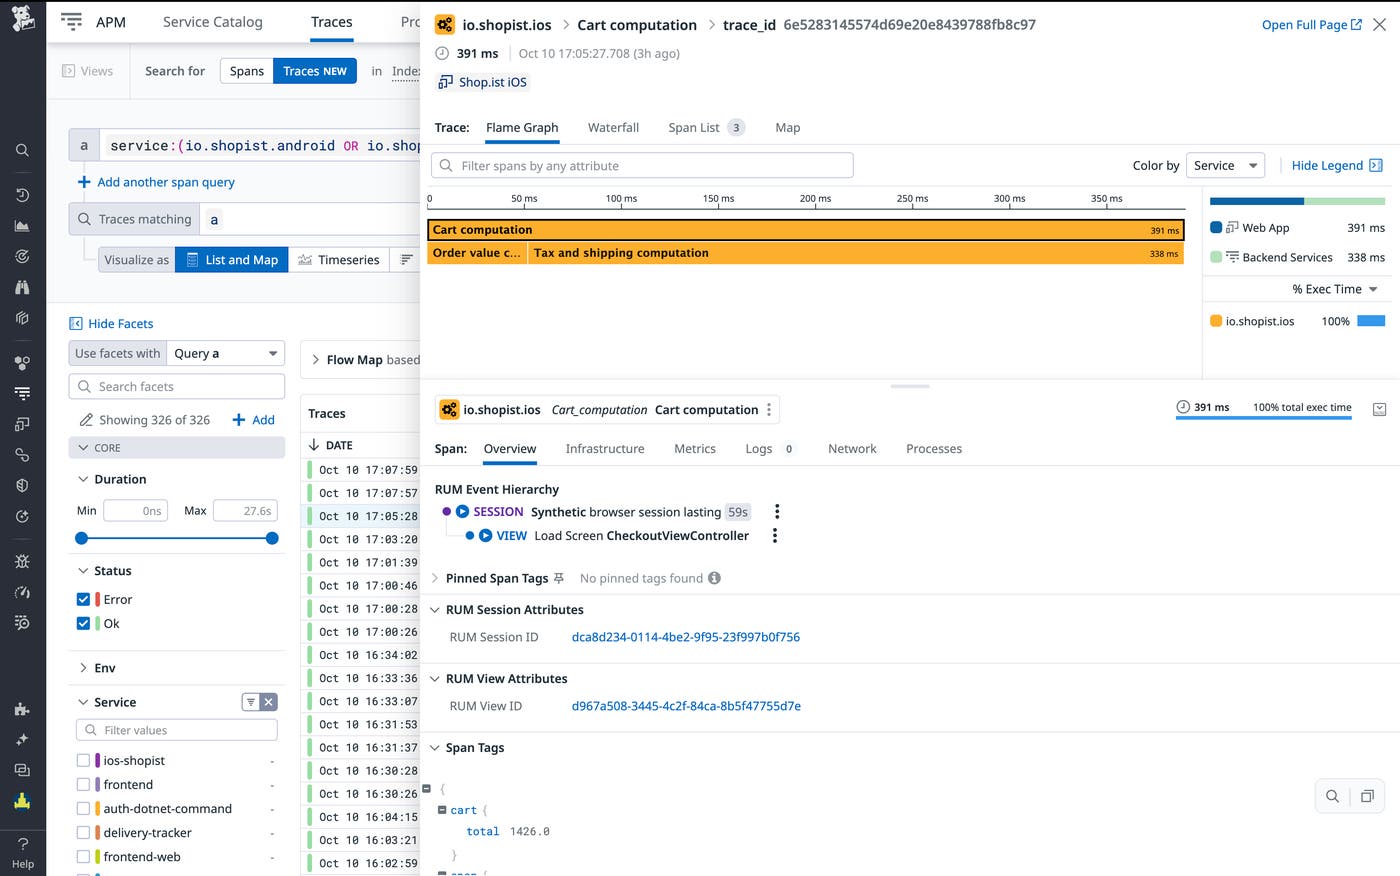
A powerful benefit of application tracing is that it allows you to correlate frontend user activity with backend performance and resource consumption. However, tracing frontend activity in mobile apps requires its own dedicated tracing support.
Datadog’s mobile SDKs for iOS and Android now support OpenTelemetry APIs, allowing you to use OTel with APM to trace frontend interactions that are specific to your mobile apps. With these capabilities, you can monitor an OTel-instrumented mobile application’s performance and user behavior in much the same way that you would with a web application. Additionally, with mobile tracing and RUM enabled in parallel, your frontend spans based on OTel tracing will be enriched with RUM data. This allows you to get a complete story, within Datadog, of the performance of your mobile UI by easily pivoting between APM and RUM in the same window—without switching contexts.
Datadog’s support for OpenTelemetry API in language SDKs allows you to add advanced functionality to OTel-based tracing. While OTel provides a strong foundation for vendor-neutral instrumentation, Datadog’s language SDKs make it possible to draw upon additional, feature-rich products in the Datadog platform.
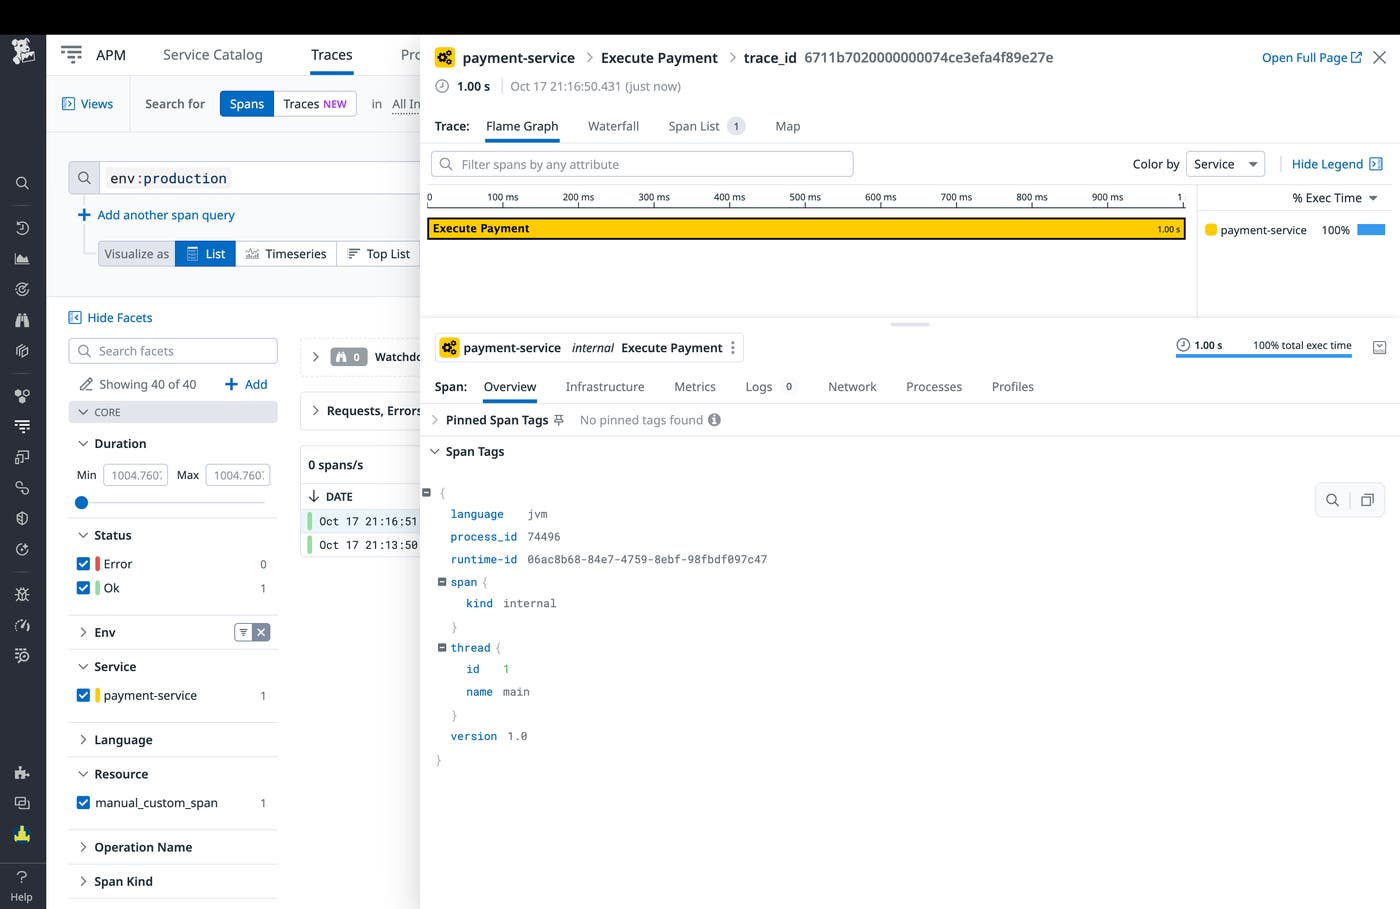
To demonstrate how you can access these two different levels of tracing features, let’s say you’ve already instrumented a Java-based payment service by using OTel, as shown in the following code snippet:
package com.example;
import io.opentelemetry.api.GlobalOpenTelemetry;
import io.opentelemetry.api.trace.Span;
import io.opentelemetry.api.trace.Tracer;
public class JavaExample {
public static void main(String[] args) {
// Get the global tracer instance from the OpenTelemetry API
Tracer tracer = GlobalOpenTelemetry.getTracer("java-example-service");
// Start a custom span
Span span = tracer.spanBuilder("manual_custom_span").startSpan();
// Simulate some work
try {
System.out.println("Working inside the custom span...");
} catch (InterruptedException e) {
e.printStackTrace();
} finally {
// End the span
span.end();
}
System.out.println("Span has been created and closed.");
}
}
Using OTel’s zero-code instrumentation, you can generate traces by starting the service with the following command, and then later analyze them in Datadog APM:
java -javaagent:path/to/opentelemetry-javaagent.jar \
-Dotel.service.name=payment-service \
-jar myapp.jar
This setup is great for capturing vendor-neutral traces, but if you want to gain deeper insights—for example, by monitoring resource consumption over time with profiling—you can easily switch to Datadog’s Java auto-instrumentation JAR. What makes this transition seamless is that you don’t need to manually alter your code to take advantage of Datadog’s features. By simply swapping the OTel JAR with the Datadog Java JAR, you unlock Datadog’s advanced observability features.
To use Datadog’s Java auto-instrumentation JAR to generate Datadog-compatible traces, you can start the service with the following command:
java -javaagent:path/to/dd-java-agent.jar \
-Ddd.trace.otel.enabled=true \
-jar myapp.jar
After you run this command, Datadog acts as a translation layer for your app, automatically converting OTel spans into Datadog spans. This flexibility ensures that you can avoid vendor lock-in while still gaining the ability to profile your services, monitor errors in real time, and visualize data streams—all within the Datadog platform. By making this simple switch, you move from basic OTel-based trace collection to comprehensive observability powered by Datadog. Datadog’s more advanced tracing features enable you to quickly identify performance bottlenecks, catch errors before they escalate, and gain deeper insights into the overall performance of your backend services.
For more information about how to configure your backend services for this type of vendor-neutral tracing that is compatible with Datadog, view the documentation about custom instrumentation with the OTel API.
Many organizations use a variety of technologies and frameworks in their applications—and not all of them necessarily have native support in Datadog’s SDKs. To ensure full tracing for these components, Datadog now supports OTel tracing APIs, allowing you to leverage OTel-compatible instrumentations across the board. You can extend Datadog’s tracing capabilities to these frameworks, which allows you to perform end-to-end tracing of your tech stack in a vendor-neutral way.
Consider the following step-by-step example, which uses R2DBC in Java to illustrate how you can drop OTel instrumentation into your service and begin sending data to Datadog. Datadog’s Java SDK does not provide out-of-the-box instrumentation for R2DBC queries, but this method helps ensure that you can capture any previously missing spans.
To extend Datadog’s tracing capabilities to R2DBC, first download the OTel R2DBC extension:
curl -L -O \
https://repo1.maven.org/maven2/io/opentelemetry/javaagent/instrumentation/opentelemetry-javaagent-r2dbc-1.0/2.5.0-alpha/opentelemetry-javaagent-r2dbc-1.0-2.5.0-alpha.jar
Next, run your Spring Boot application with both the Datadog Java SDK and the OTel R2DBC extension:
mvn spring-boot:run \
-Dstart-class=com.example.MyApplication \
-Dspring-boot.run.jvmArguments="-javaagent:path/to/dd-java-agent.jar -Ddd.trace.otel.enabled=true -Dotel.javaagent.extensions=opentelemetry-javaagent-r2dbc-1.0-2.5.0-alpha.jar"
With this setup, you’re now using OTel’s instrumentation to ensure full tracing capabilities for R2DBC queries.
Keep in mind that tracing R2DBC queries in Datadog only hints at what is now possible, as Datadog supports a wide range of OTel-compatible frameworks across multiple languages. To learn more, check out our documentation.
With Datadog’s comprehensive support for OpenTelemetry, you can now achieve end-to-end tracing across your OTel-instrumented stack, from frontend user interactions to backend services. Whether you’re tracing web or mobile applications, instrumenting backend services, or using community-built OTel libraries, Datadog provides enriched tracing capabilities for your OTel-instrumented apps.
Ready to get started? Explore more about how Datadog supports OTel by visiting our documentation or sign up for a free trial.
此内容由惯性聚合(RSS阅读器)自动聚合整理,仅供阅读参考。 原文来自 — 版权归原作者所有。