





In Part 1 of this series, we looked at the key EFS metrics you should monitor, and in Part 2 we showed you how you can use tools from AWS and Linux to collect and alert on EFS metrics and logs. Monitoring EFS in isolation, however, can lead to visibility gaps as you try to understand the full context of your application’s health and performance. To meet the challenge of monitoring this dynamic storage system and its heterogeneous clients, you need to explore and alert on metrics and logs from EFS alongside data from your clients, related AWS services, and other key technologies.
Datadog provides complete EFS visibility, allowing you to monitor the size of your file systems and the behavior of the many different clients—EC2 instances, EKS pods, Lambda functions, and more—that access your data. In this post, we’ll show you how to:
- Integrate EFS with Datadog - Visualize EFS metrics - Alert on EFS activity and performance - Collect EFS logs
Datadog’s AWS integration gives you deep visibility into EFS and the other AWS services you’re using, all in a single platform. In this section, we’ll show you how to add EFS to your AWS monitoring—or how to enable the AWS integration if you’re just getting started—so you can visualize, analyze, and alert on the performance of the AWS services you rely on.
If you’re already monitoring some AWS services, you can add EFS to the mix by clicking the Configuration tab on the AWS Integration tile. Check the “EFS” box under the “Limit metric collection by AWS Service” list, as well as the boxes for any other AWS services you want to add to your monitoring. If you’re using Lambda with EFS, check the “Lambda” box and follow the steps for enabling EFS for Lambda.
Once you’ve checked the boxes for all the AWS services you want to monitor, click the “Update Configuration” button. Metrics will begin flowing into your Datadog account within a few minutes so you can quickly get started using EFS dashboards, tags, and alerts.
If you’re not yet monitoring AWS services with Datadog, you can start by installing the AWS integration with our 1-click installation process. The 1-click process is based on CloudFormation, and you’ll need to create an IAM role and an associated policy. Once you’ve completed the installation steps described in our blog post, Datadog will begin automatically collecting EFS metrics, as well as metrics from the other AWS services in your stack.
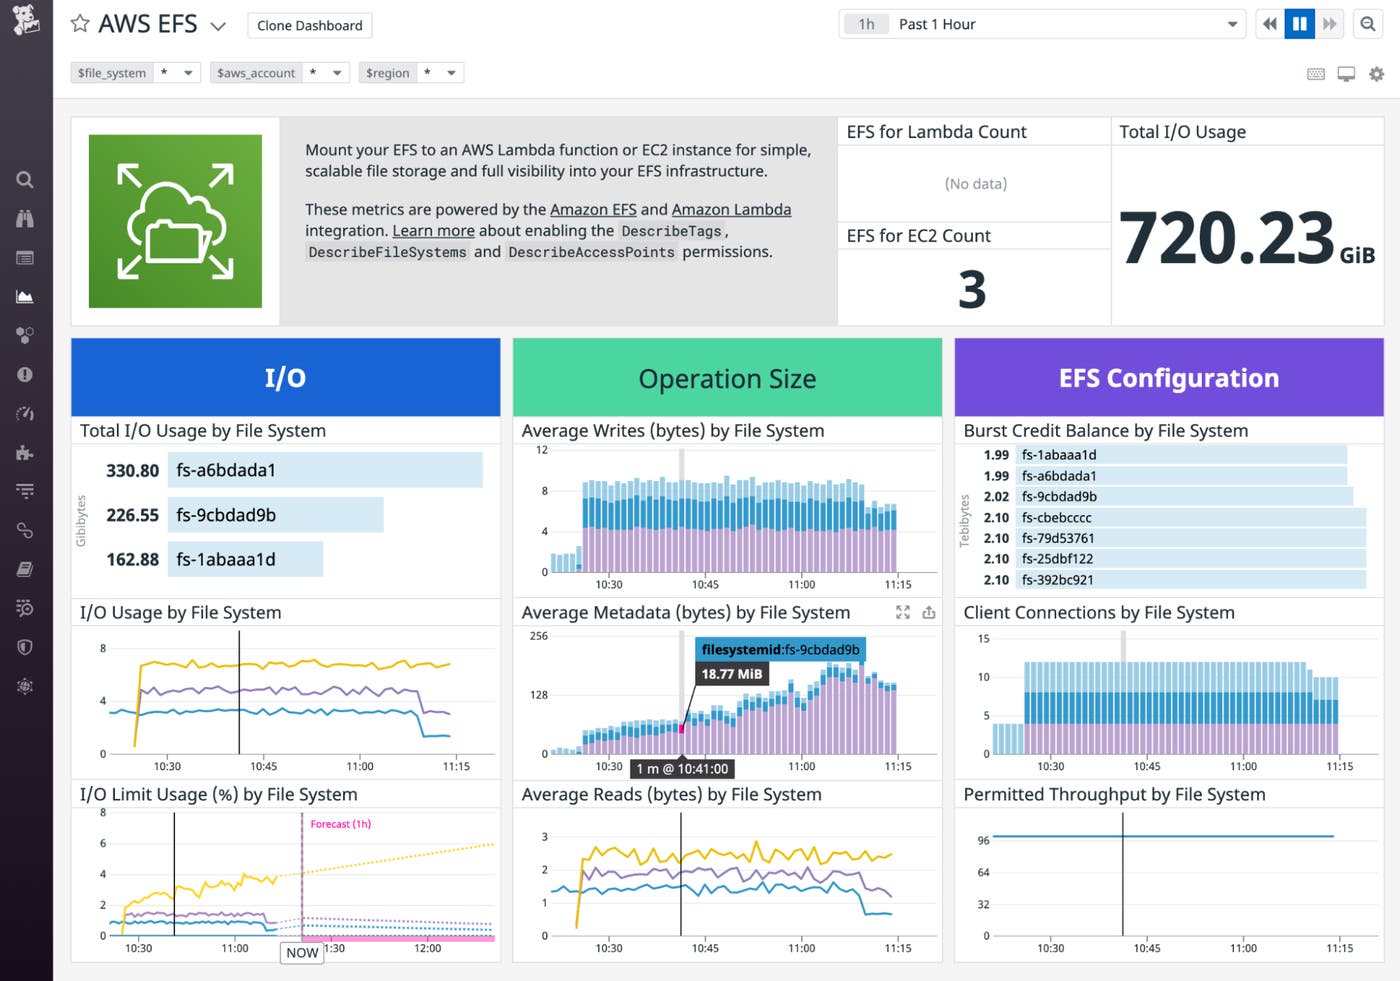
The built-in EFS dashboard—shown in the screenshot at the beginning of this post—brings together I/O metrics, throughput metrics, and burst credit balance data for all of the file systems in your account, so you can understand each file system’s health and performance at a glance.
You can easily customize the dashboard to graph EFS metrics alongside metrics from other AWS services. For example, Amazon ECS Auto Scaling metrics could explain changes in the number of clients connecting to your file system and Amazon SQS metrics might reveal a backlog of work your clients need to process. And you can add even more context to your EFS metrics by correlating them with data from any of Datadog’s more than 1,000 other integrations.
You can also leverage Datadog’s tagging system to organize, filter, and explore specific subsets of your data, such as the performance of an individual file system or even a specific client. Datadog automatically tags your EFS metrics to show the AWS account, file system, and region where they came from, and you can also add custom tags (for example, to identify the application for which a file system provides storage) from within the EFS console or by including them in a CloudFormation template.
You can even create common tags across your metrics, logs, and traces so you can correlate them to understand the context of what you see on your dashboards. For example, if EFS metrics show that a file system’s burst credits are exhausted, you can seamlessly navigate to APM to see if any of your application’s services shows a corresponding increase in latency.
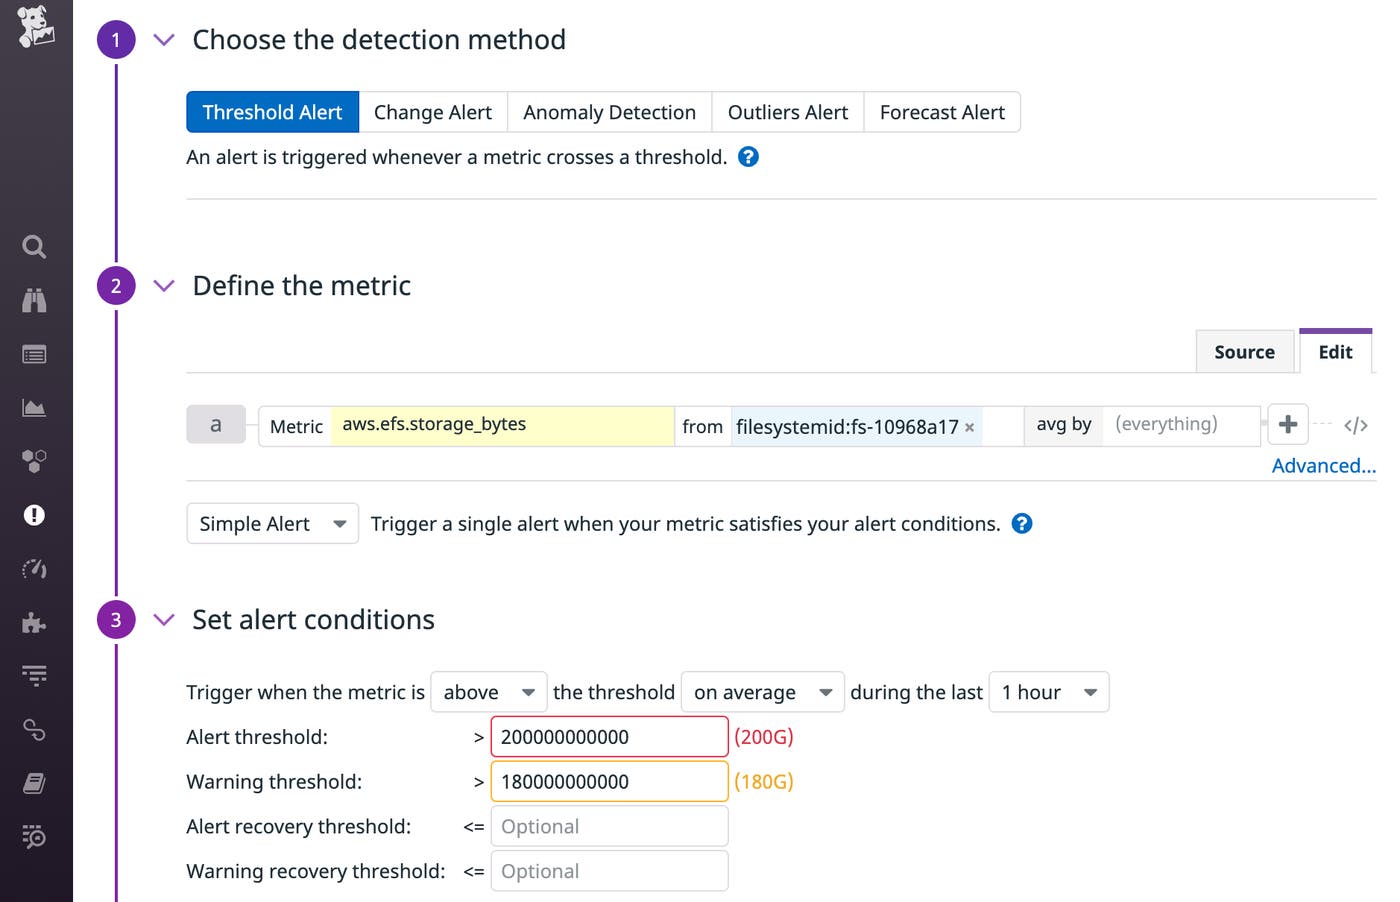
Dashboards let you visualize real-time metrics, but you can also create alerts to automatically notify you if the value of a metric crosses a threshold that could affect your file systems’ performance and your EFS costs.
For example, you may want to be notified if your file system is running out of IOPS (by creating an alert on the aws.efs.percent_iolimit metric) or burst credits (aws.efs.burst_credit_balance) so you can proactively address an issue before it causes your application to slow down. And if you want to watch your file system for changes that could indicate cost anomalies or security concerns, you can create alerts to notify you of any unusual changes in metrics like aws.efs.data_write_iobytes* or aws.efs.storage_bytes, as shown in the screenshot below.
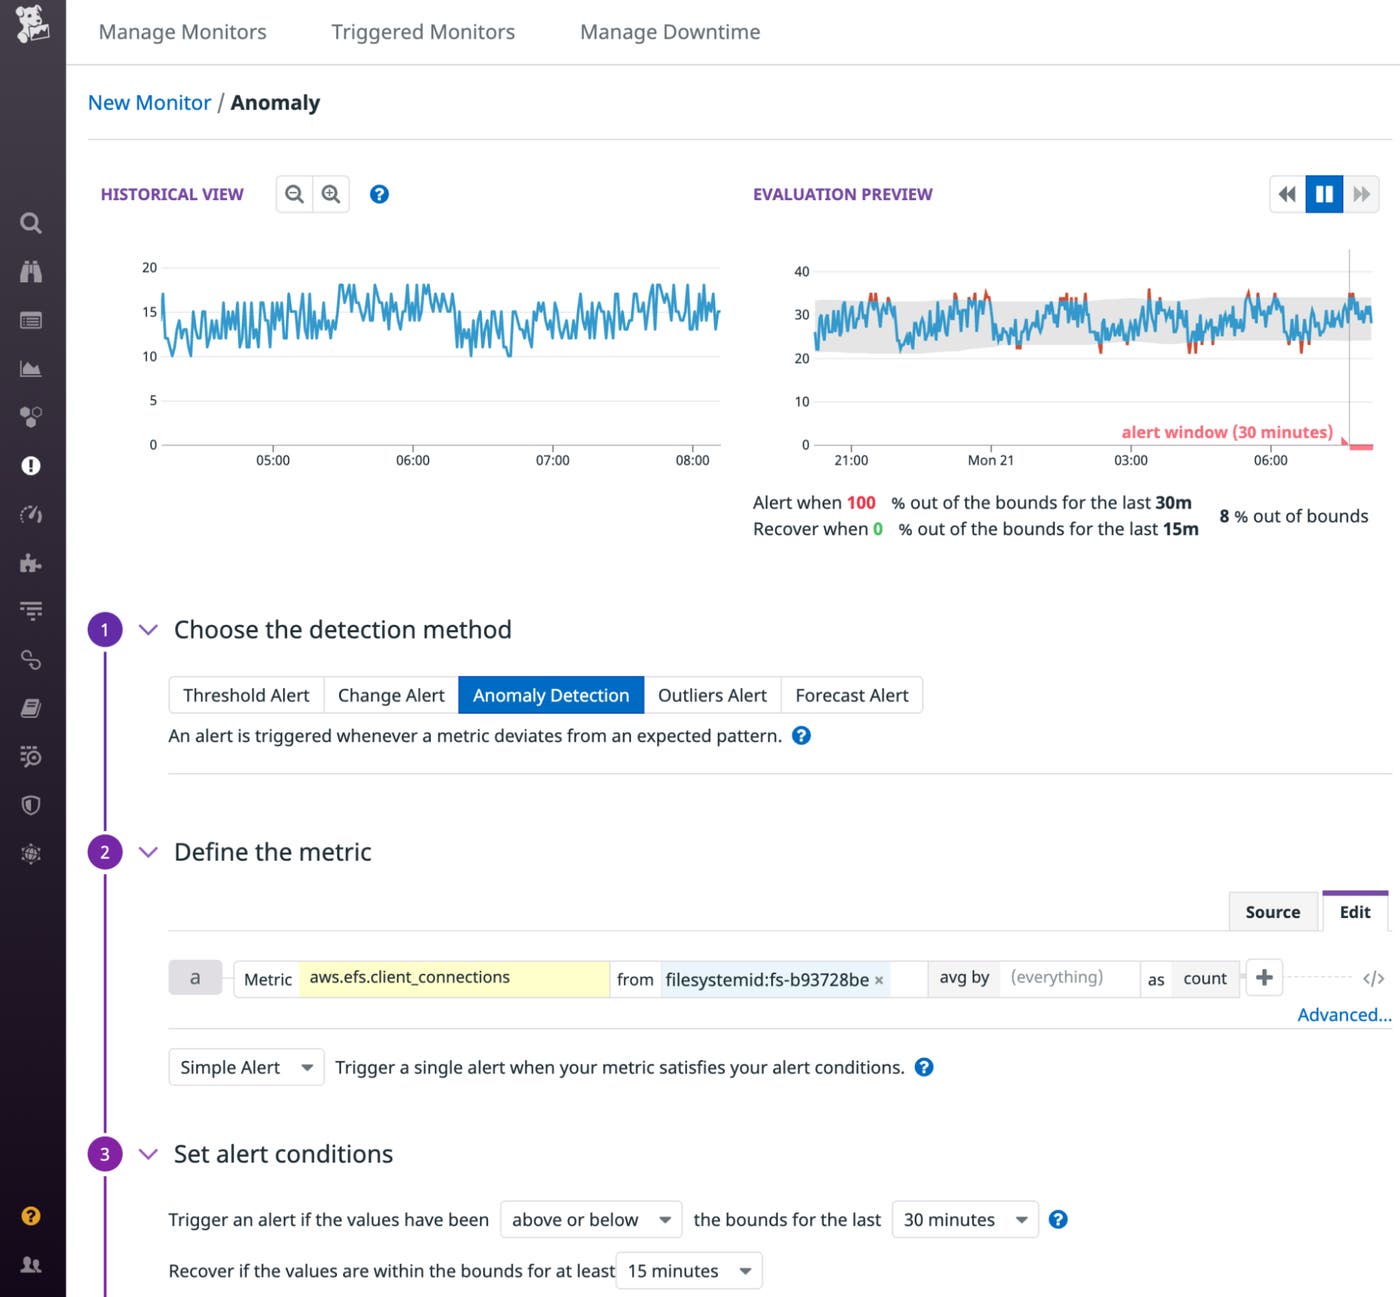
An alert based on a threshold can keep you informed of unexpected changes in your metrics, but it can be hard to determine the value you should use for the threshold. Anomaly-based monitors can notify you automatically of changes that are out of line with a metric’s history so you don’t have to choose a threshold value to define what’s normal and expected. For example, the number of clients connected to your file system may be dynamic, but if it drops due to a configuration error that prevents new instances from connecting, an anomaly monitor can notify you of the unexpected change. In the screenshot below, the recent history of the aws.efs.client_connections metric appears on the left, and the expected future values of this metric appear in the gray band in the graph on the right.
In Part 2 of this series, we showed you how you can publish mount helper logs and flow logs to CloudWatch. In this section, we’ll show you how to forward those logs from CloudWatch to Datadog so you can explore and correlate them with logs from other technologies in your stack.
Once you’re sending your EFS logs to CloudWatch Logs, you can route them to Datadog by way of a Kinesis Data Firehose delivery stream. Sending logs from EFS—and other AWS services—through Kinesis allows you to leverage AWS’s managed service for streaming logs and frees you from the challenges of managing concurrency and throttling that come with deploying your own Lambda forwarder.
If you’re already collecting AWS service logs into a delivery stream in Firehose, you can add your EFS logs to the same stream. They’ll be delivered to Datadog alongside your other logs, but they’ll be distinguished by service and source values that show the name of the CloudWatch log group you configured to collect them.
If you’re not yet collecting AWS service logs through Firehose, create a delivery stream and configure Datadog as the destination. Then, add a subscription filter to the CloudWatch log group where you’re collecting your EFS logs and set your Kinesis Data Firehose delivery stream as the filter’s destination. See the documentation for more information about sending AWS service logs into Datadog via Kinesis.
Datadog brings together logs from AWS services—including EFS—and many other technologies into a single platform, where you can explore and analyze them with the help of tags. Just as with metrics, Datadog automatically tags your EFS logs to show the AWS account, region, and file system where they originated, and you can apply custom tags by adding parameters when you configure Datadog as the destination for your delivery stream.
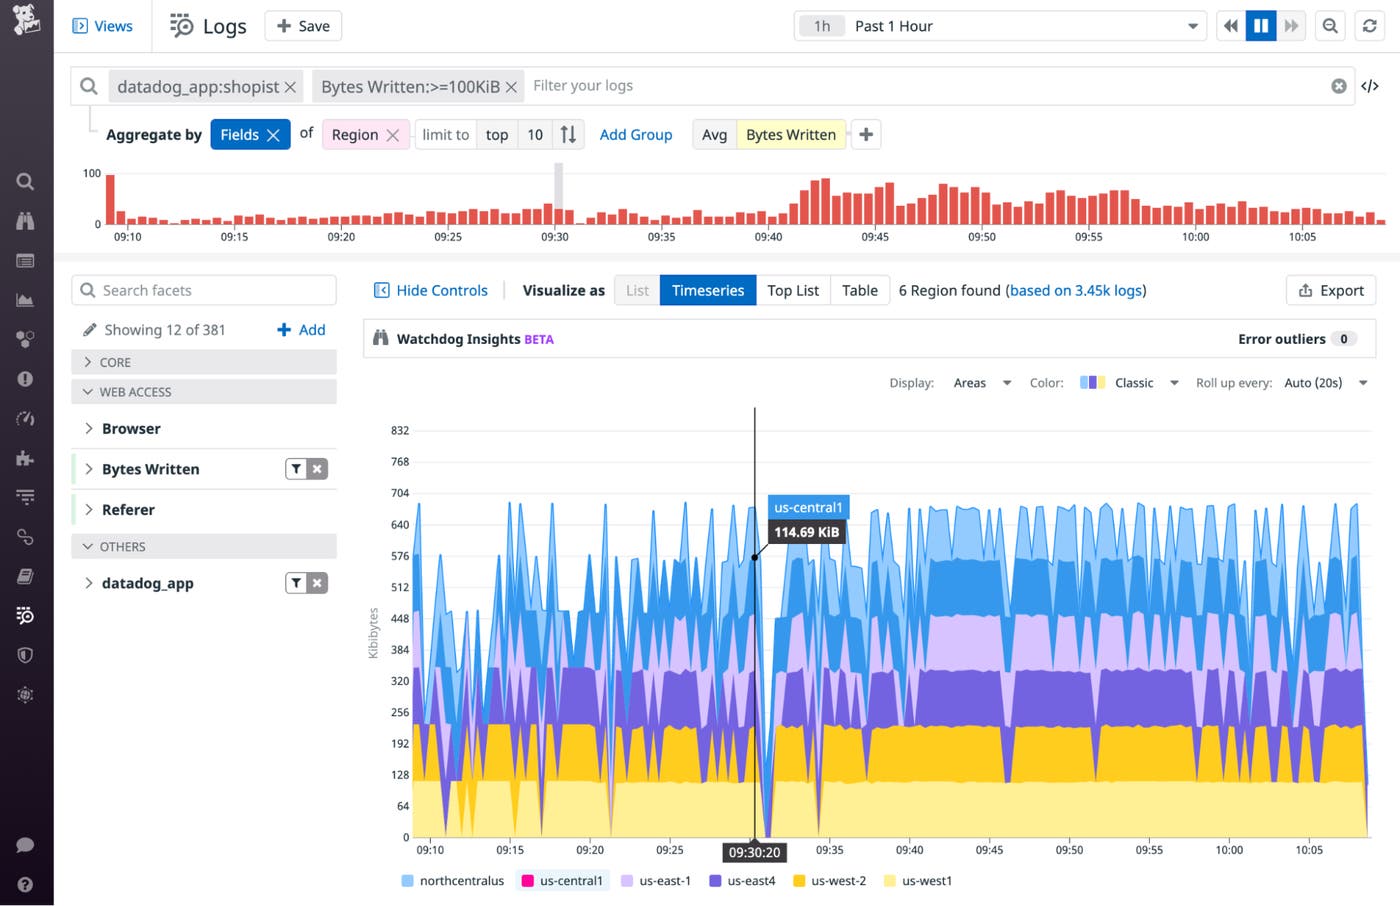
You can also add facets to your tags to make it easy to group logs from related sources and present a fuller picture of activity across your stack. For example, if you apply an application tag to identify EFS logs originating from a specific application, you can apply the same tag to logs from your clients and related AWS services (e.g., an ELB that distributes incoming requests to your EC2 fleet). Then, you can create a facet based on that tag to group logs from all layers of your application.
In the screenshot below, we’ve created a facet on the datadog_app tag to isolate logs from a single application, and we’ve grouped them by region to show relative amounts of EFS traffic by geography. We’ve also filtered the logs using a measure—a type of facet based on the value of a log field—to reveal logs that represent a large amount of write activity.
EFS can serve a key role in your application, supporting simultaneous access across numerous clients, including EC2 instances, Lambda functions, and Amazon Elastic Container Service (ECS) tasks. Datadog gives you full visibility into each of these services, in addition to more than 1,000 other technologies, so you can monitor the health and performance of your file systems in context. If you’re not already using Datadog, start today with a 14-day free trial.
此内容由惯性聚合(RSS阅读器)自动聚合整理,仅供阅读参考。 原文来自 — 版权归原作者所有。