





Zack Allen

Colin O'Brien

Mallory Mooney
In the ever-changing world of cybersecurity, Security Operations Centers (SOCs) are responsible for building comprehensive threat detection strategies for their environments. A key indicator of success for any SOC team is their level of security coverage, which correlates with the breadth, depth, and accuracy of their threat detection tools and workflows. Historically, building coverage consisted of monitoring as many incoming logs as possible via custom detection rules to ensure that SOC teams have enough visibility into a threat actor’s activity. Teams then share these rules with downstream technical stakeholders and business leaders to endorse the value and efficiency of their threat detection processes. But as their set of detection rules grows and becomes more varied, SOC teams face the challenge of continually needing to redefine what adequate coverage means.
In this post, we’ll explain a few different ways the detection engineering field talks about coverage, some inherent biases in these approaches, and some recommendations to remedy them. Along the way, we’ll also look at how Datadog approaches these challenges to help customers achieve sufficient security coverage for their environments.
At its core, threat detection—and building adequate coverage—at scale is a statistics problem. For the sake of simplicity, let’s say there are two labels that you can apply to events from various telemetry sources (such as network traffic, identity provider logs, and cloud control plane logs): benign and malicious. Creating rules that detect all benign and malicious events can be costly, and you are bound by several problems related to bias and accuracy when doing so, which we will explain later in this post. This point is illustrated in the following diagram:
As seen in the diagram, which represents the threat landscape for a single telemetry source, building security coverage suffers from what we’ll refer to as an “aperture dilemma.” In this case, you often will not know how much you need to widen the circle that represents your coverage in order to capture all benign and malicious events. At a broader level, the entire threat landscape—the aggregation of all telemetry sources that threat actors can use to attack your environment—also suffers from this dilemma.
As illustrated in the preceding diagram, it can be challenging to understand how many telemetry sources should be included as part of your security coverage. An added benefit to looking at multiple telemetry sources is that you can monitor a threat actor’s various attack techniques and their traversal between sources. But just because you have more visibility into these junction points doesn’t mean that you know how many there are. Given this complexity in visualizing the threat landscape, where do you draw the boundaries of security coverage?
An introductory approach to building coverage could include documenting all of the publicly reported attacks for each telemetry source and writing as many detection rules as possible to cover them. This approach is illustrated in the following diagram:
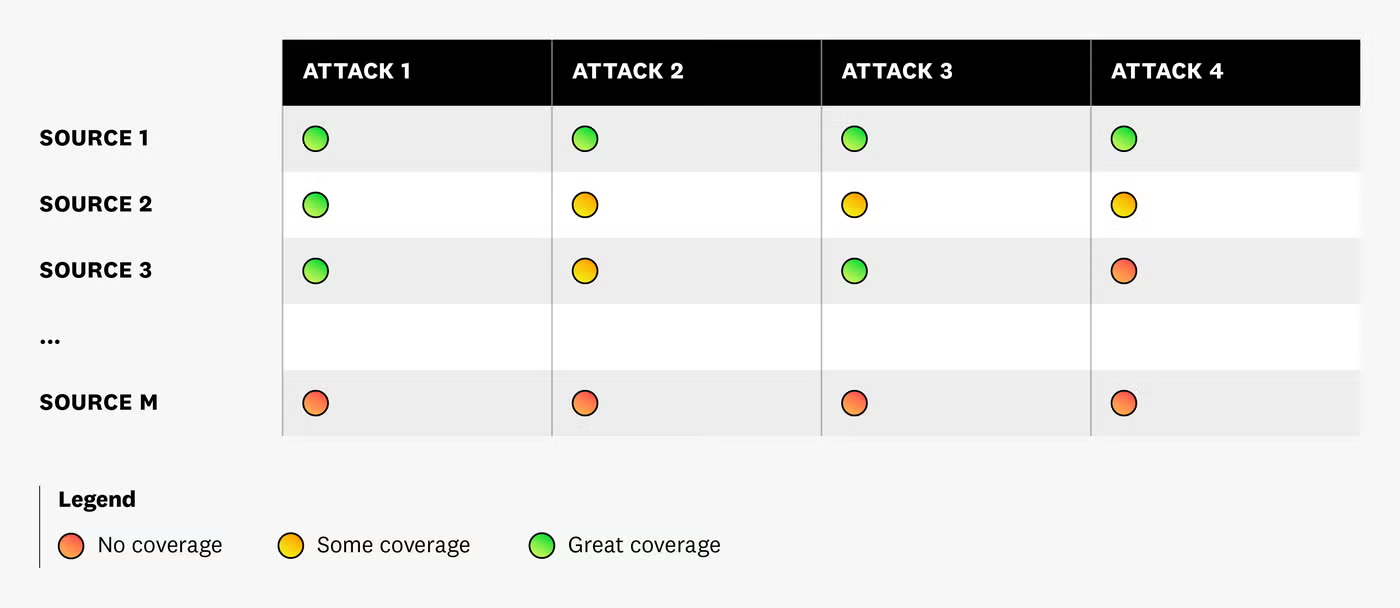
As seen in the diagram, each telemetry source can be vulnerable to the same type of attack. You may have detection rules that cover all attacks for “Source 1” but not for “Source M”, so you attempt to cover those gaps. But there are a few flaws with this approach. First, it assumes that it is possible to find all publicly reported attacks and model them. In reality, most teams and organizations are not able to dedicate the amount of time needed to learn everything about the threat landscape and add new types of detections as they find them. Second, this approach doesn’t factor in the frequency of attacks, assuming they all occur at the same frequency. Threat actors tend to stick to the path of least resistance and may prefer one type of attack over another. Finally, this approach does not delineate common techniques (such as reconnaissance, initial access, lateral movement, and exfiltration), so you often lack visibility into the complete path of an attack.
In addition to the flaws with attempting to document all publicly reported attacks, there are three biases that can occur while building security coverage: selection, availability, and confirmation. A selection bias can occur when you focus on mapping attacks to a single model, like MITRE ATT&CK. An availability bias occurs when you only prioritize the most popular attacks, which risks overlooking other types of less visible but equally serious attacks. Finally, you can become susceptible to a confirmation bias when you look for evidence that only supports a particular outcome, which can skew the prioritization of your detection rules and sources.
For example, confirmation bias can happen when you create new detection rules. If previous investigations discovered a malicious insider stealing data, you may only research other instances of malicious insiders exfiltrating data. In this case, you are anchoring the cause of the issue (malicious insider) instead of prioritizing the impact (data exfiltration). A more efficient approach here would involve working backwards from the impact to identify points of egress that may not have appropriate monitoring in place to detect data exfiltration, such as a cloud storage bucket.
Given these challenges, SOC teams often find it difficult to create the right balance between the number of detection rules and their quality. As previously mentioned, simply increasing the number of rules does not guarantee adequate coverage. And as teams attempt to expand their coverage in order to keep pace with the evolving threat landscape, they may unknowingly create duplicate or inefficient rules. Together, these scenarios contribute to inefficient threat detection systems, inaccurate alerts, and increased alert fatigue.
Next, we’ll look at some recommendations that can help SOC teams address these challenges and start building adequate security coverage for your environment.
Since you don’t want to focus on solely creating more detection rules to achieve good security coverage, it’s important to consider how you can prioritize the ones that are specific to your business. You can start by generalizing the majority of your detection rules and mapping them to industry-standard frameworks and models. Taking this approach to anchor your rules with well-known models while recognizing that 100 percent coverage is not the primary goal can help reduce the impact of the selection bias mentioned earlier.
Instead of attempting to document every threat scenario, it can be more efficient to create a smaller number of rules that abstract data concerning a particular threat. This approach enables you to detect a threat across a broader range of environments. You can accomplish this by preprocessing your telemetry data—specifically, log and audit data— to extract common attributes, such as service, team, and cloud environment. This shift towards a leaner set of generalized detection rules significantly enhances the effectiveness of threat detection by providing the following benefits:
For example, imagine a typical scenario where a threat actor attempts to encrypt data in cloud storage using a key from a compromised account. Traditional SOCs may have separate rules for affected services in each cloud environment. But by preprocessing incoming log and audit data as part of a unified workflow, you can create a single rule that detects this type of behavior regardless of where it occurs. This approach is illustrated in the following example of a custom detection rule for account takeovers:
In this scenario, the detection rule uses key attributes from authentication logs, such as IP address, service, and event name and outcome, to automatically detect brute force attacks in any part of an environment.
Datadog takes this a step further by using preprocessed log and audit data to create a set of out-of-the-box (OOTB) detection rules that are designed to instantly build sufficient coverage for your environment. For example, our OOTB rules automatically cover common threats across widely used cloud providers, integrations, and platforms. To accomplish this, we follow Joseph Juran’s Pareto Principle to determine which rules need to be included in our ruleset, and each one is researched by Datadog’s team of detection engineers, incident response members, penetration testers, and security analysts to ensure technical accuracy.
The ultimate goal with our OOTB rules is to provide reliable coverage for 80 percent of your security cases so you can focus on the rules that are specific to your business. You can modify these rules to fit your environment or create custom rules based on your needs. We’ll look at best practices for creating detection rules that are tailored to your environment’s unique business cases in more detail in Part 2 of this series.
Using preprocessed logs is a good starting point for optimizing the breadth of coverage for your detection rules. But as the threat landscape continues to evolve, knowing how to improve the depth of coverage—visibility into each stage of an attack—can quickly become difficult. Though the goal here is not to achieve perfect coverage, it’s important that you have adequate visibility into a threat actor’s entire attack path.
Using industry-standard frameworks creates a baseline for detecting the wide variety of attacks and vulnerabilities that can materialize in your environments. For example, the MITRE ATT&CK framework provides detailed information about the initial signs of an attack in addition to other related activity, such as signs of lateral movement within your environment, privilege escalation, data exfiltration, and more.
Datadog’s OOTB detection rules are mapped to multiple sources like the MITRE ATT&CK framework and multiple compliance benchmarks. For example, the following detection rule is automatically mapped to both the MITRE ATT&CK and Payment Card Industry Data Security Standard (PCI) compliance frameworks:
Using multiple industry-standard sources like these helps manage biases, like selection bias, and strengthens the depth of coverage for our OOTB rules. This mapping ensures that you can easily visualize attacks based on a threat actor’s tactics (why an attack is occuring) and techniques (how an attack is occuring), giving you complete context for mitigating them.
In this post, we looked at challenges with defining and building adequate security coverage. We also looked at some recommendations for creating the right rules, based on our experience in the detection engineering discipline. Datadog combines software engineering, security, and statistics into a single team to help scale our operations to thousands of accurate and reliable rules. And since we integrate with an extensive number of cloud environment technologies, we also have unique insights into building detection rules for the cloud, clusters, containers, and code. Check out Part 2 of this series to learn how you can apply this experience to develop best practices for creating detection rules. If you don’t already have a Datadog account, you can sign up for a free 14-day trial.
此内容由惯性聚合(RSS阅读器)自动聚合整理,仅供阅读参考。 原文来自 — 版权归原作者所有。