


This is a guest post from Mike Fiedler, system engineer extraordinaire, first published on his blog and reproduced hereinafter.
This is a sysadmin/devops-style post.
Disclaimers are that I work with these tools and people, and like what they do.
In some amount of our professional lives, we are tasked with bringing order to chaos, keep systems running and have the businesses we work for continue functioning.
In our modern days of large-scale computing, web technology growth explosions, multiple datacenter deployments, cloud providers and other virtualization technologies, the manpower needed to handle the vast amount of technologies, services and systems seems to have a pretty high overhead cost associated with it. “You’ve got X amount of servers? Let’s hire Y amount of sysadmins!”
A lot of tech startups start out with some of the developers performing a lot of the systems tasks, and since this isn’t always their core expertise, decisions are made, scripts are written, and “it works”. When the team/systems grow large enough to need their own handler, in walks a system admin-style person, and may keel over, due to the state of affairs.
Yes, there are many tech companies where this is not the case, and I commend them of keeping their systems lean, mean and clean.
A lot of companies have figured out that in order to make the X:Y ratio work well, automation is required. Here’s an article that covers some numbers from earlier this year. I find that the statement of a ratio of 50 servers to 1 sysadmin pretty low on my view of how things can be, especially given the tools that we have available to us.
One of the popular systems configuration tools I’ve been using heavily is Chef, from Opscode. They provide a hosted solution, as well as an open-source version of their software, for anyone to use. Getting up and running with some basics is really fast, and there’s a ton of information available, as well as a really responsive community (from mailing lists, bug tracker site and IRC channel). Once you’re working with Chef, you may wonder how you ever got anything done before you had it. It’s really treating a large part of your infrastructure as code – something readable, executable, and repeatable.
But this isn’t about getting started with Chef.
In any decent starting-out tech company, the amount of servers used will typically range from 2-3 all the way to 200 – or even more. If you’ve gone all the way to 200 without something like Chef or Puppet, I commend your efforts, and feel somewhat sorry for you. Once you’re automating your systems creation, deployment and change, then you typically want some feedback on what’s going on. Did what I asked this system to do succeed, or did it fail.
Enter Datadog.
Datadog attempts to bring many sources of information together, to help whomever it is that is supposed to be looking at the systems to make more sense of the situation, from collecting metrics from systems, events from services and other sources, to allowing a timeline and newsfeed that is very human-friendly.
Having all the data at your disposal makes it easier to find patterns and correlations between events, systems and behaviors – helping to minimize the “what just happened?” question.
The Chef model for managing systems is a centralized server (either the open source in your environment or the hosted service in Opscode), which tells a server what it is meant to “be”. Not what it is meant to “do now”, but the final state it should be in. They call this model “idempotent” – meaning that no matter how many time you execute the same code on the same server, the behavior should end up the same every time. But it doesn’t follow up very much on the results of the actions.
An analogy could be that every morning, before your kid leaves the house, your [wife|mother|husband|guardian|pet dragon] tells them “You should wear a coat today.” and then goes on their merry way, not checking whether they wore a coat or not. The next morning, there will get the same comment, and so on and so forth.
So how do we figure out what happened? Did the kid wear a hat or not? I suppose I could check by asking the kid and get the answer, but what if there are 200 of us? Do I have time to ask every kid whether or not they ended up wearing a hat? I’m going to be spending a lot of time dealing with this simple problem, I can tell you now.
Chef has built-in functionality to report on what Chef did – after it has received its instructions from the centralized server. It’s called the “Exception and Report Handlers” – and this is how I tie these two technologes together.
I adapted some code started by Adam Jacob @Opscode, and extended it further into a complete RubyGem with modifications for content, functionality and some rigorous testing.
Once the gem was ready, now I have to distribute it to my servers, and then have it execute every time Chef runs on that server. So, based on the chef_handler cookbook, I added a new recipe to the datadog cookbook – dd-handler.
What this does is adds the necessary components to a Chef execution, and when placed at the beginning of a “run”, will capture all the events and report back on the important ones to the Datadog newsfeed. It will also push some metrics, like how long the Chef execution too, how many resources were updated, etc.
The process for getting this done was really quite simple, once you boil down all the reading, how’s and why’s – especially if you use git to version control your chef-repo. The knife cookbook site install command is a great method for keeping your git repo “safe” for future releases, thus preserving your changes to the cookbook, allowing for merging of new code automatically. Read more here.
Here’s pretty much the process I used (under chef/knife version 0.10.x):
$ cd chef-repo
$ knife cookbook site install datadog
$ vi cookbooks/datadog/attributes/default.rb
At this point, I head over to Datadog, hit the “Setup” page, and grap my organization’s API Key, as well as create a new Application Key named “chef-handler” and copy the Hash that is created.
I place these two values into the attributes/default.rb file, save and close.
$ knife cookbook upload datadog
This places the cookbook on my Chef server, and is now ready to be referenced by a node or role. I use roles, as it’s much more manageable across multiple nodes.
I update the common-node role we have to include “recipe\[datadog::dd-handler\]” as one of the first receipes to execute in the run list.
The common-node role applies to all of our systems, and since they all run chef, I want them all to report on their progress.
And then let it run.
Since our chef-client runs on a 30 minute interval, and not all execute at the same time, this makes for some interesting graphs at the more recent time slices – not all the data comes in at the same time. That’s something to get used to.
Here’s an image of a system’s dashboard with only the Chef metrics:
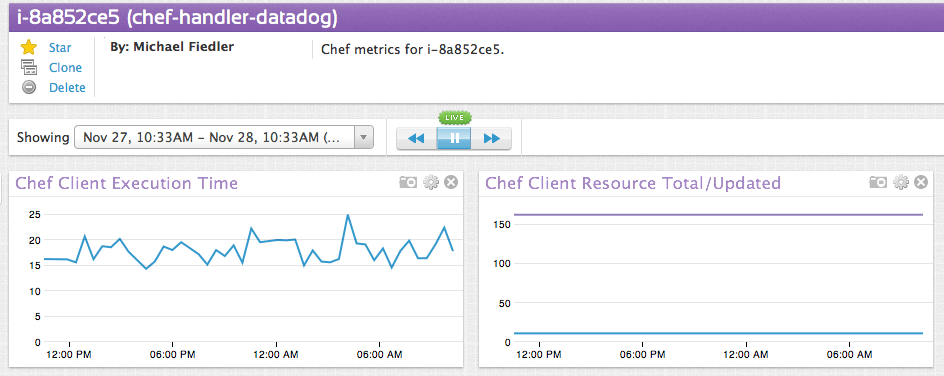
It displays a 24-hour period, and shows that this particular instance had a low variance in its execution time, as well as not much is being updated during this time (a good thing, since it is consistent).
On a test machine I tossed together, I created a failure, and here’s how it gets reported back to the newsfeed:
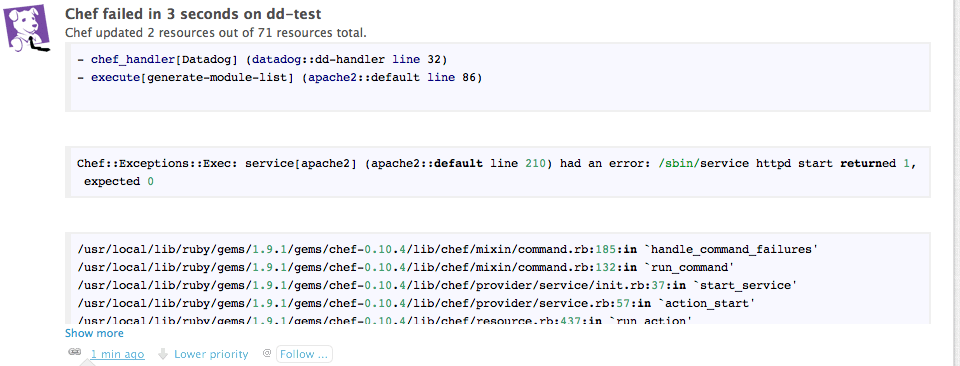
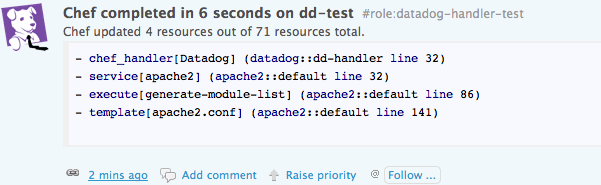
As you can see, the stacktrace attempt to provide me with the information I need to diagnose and repair the issue. Once I fix it, and apache can start, this event was logged in the “Low Priority” section of the feed (since succeses are expected, and failures are aberrant behavior):
All this is well and wonderful, but what about a bunch of systems? Well, I grabbed a couple snaps off the production environment for you!
These are aggregates I created with the graphing language (had never really read it before today!)
By being able to see the execution patterns, and a bump closer to the left side of the “Resource Updated” graph – I then investigated, and someone had deployed a new rsyslog package – so there was a temporary increase in deploying the resources, and now there are slightly more resources to manage overall.
The purple bump seen in the “Execution Time” graph led me to investigate, and found a timeout in that system’s call to an “apt-get update” request – probably the remote repo was unavailable for a minute. Having the data available to make that correlation made this task of investigating this problem really fast, easy, and simple – more importantly since it has been succeeding ever since, no cause for alarm.
So now I have these two technologies – Chef to tell the kids (the servers) to wear coats, and Datadog to tell the parents (me) if the kids wore the coats or not, and why. Check it out for yourself and download a 14 day free trial of Datadog today.
Really, just wear a coat. It’s cold out there.
––––
Tested on:
Used:
此内容由惯性聚合(RSS阅读器)自动聚合整理,仅供阅读参考。 原文来自 — 版权归原作者所有。