




Whenever an event occurs on your Windows machine, the operating system records an event log that includes details about the nature of the event (e.g., critical runtime error) or security identifiers (for audit events). Windows event logs not only record system and application activity but also user actions and background processes, making them an invaluable tool for monitoring the security and health of your systems.
In this guide, we’ll cover the following topics:
Why you should monitor Windows event logs
Event log classifications
Key event logs to monitor
You may already be using the Datadog Windows Agent to collect system metrics, logs, and other data from your Windows systems. Windows event logs enable you to expand your monitoring coverage to include essential services that run behind the scenes, such as Windows Task Scheduler, Microsoft Defender, and Windows Firewall. This can be especially useful for system administrators who need to configure and monitor routine tasks and access controls for Windows environments. Event logs can help confirm that these services are operating correctly (e.g., that your scheduled tasks have all properly executed) and provide more details into unexpected crashes or failures.
Event logs also enable you to effectively monitor your organization’s security boundaries. Windows generates event logs for important security events, such as user logons, changes to access controls, and other audit activity that can signal attempts to breach your environment. Once you begin collecting Windows security event logs, you can use them to configure powerful alerts that help you quickly respond to suspicious activity and limit the impact on your data.
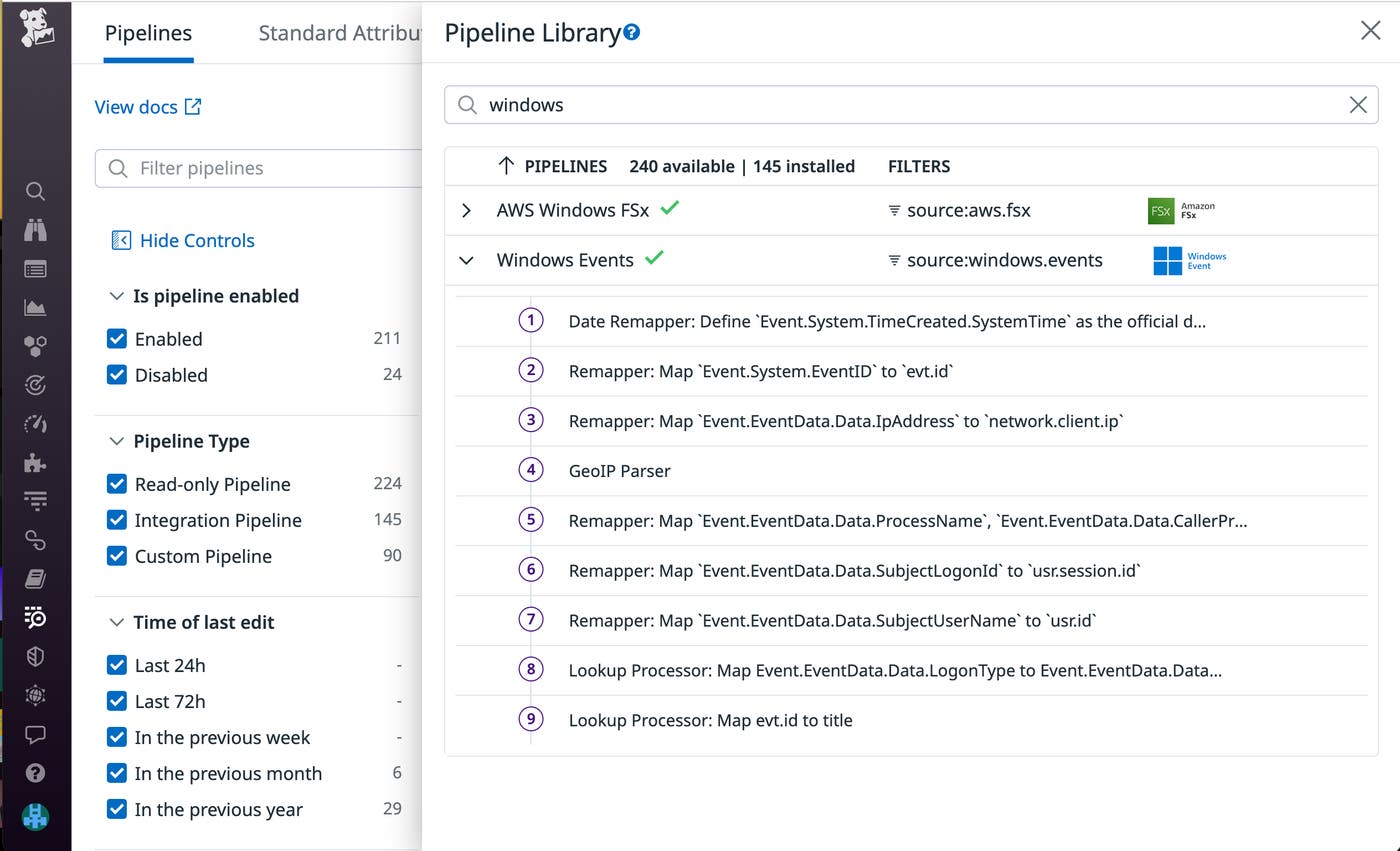
To start monitoring your Windows event logs with Datadog, you can use Log Management’s out-of-the-box pipeline to automatically parse, enrich, and tag your Windows events. This enables you to quickly search for key events and monitor your event logs alongside the rest of your Windows environment.
Each Windows event is accompanied by an event ID that references the type of event that occurred. Events are logged into one of several channels, depending on their origin. The majority of key events are written to the application, system, and security channels:
| Channel | Description | Example |
|---|---|---|
| Application | This includes events logged by applications. | An application encountered an error when loading a config file. |
| System | This includes events related to system operations. | A new driver update is available for installation. |
| Security | This includes any default security events alongside events defined by the audit policies for each resource | Logon attempts or changes to a security group’s access control. |
Certain applications may also create their own channels with events you’ll want to monitor. You can view all the channels (and their logged events) on your system in the Windows Event Viewer.
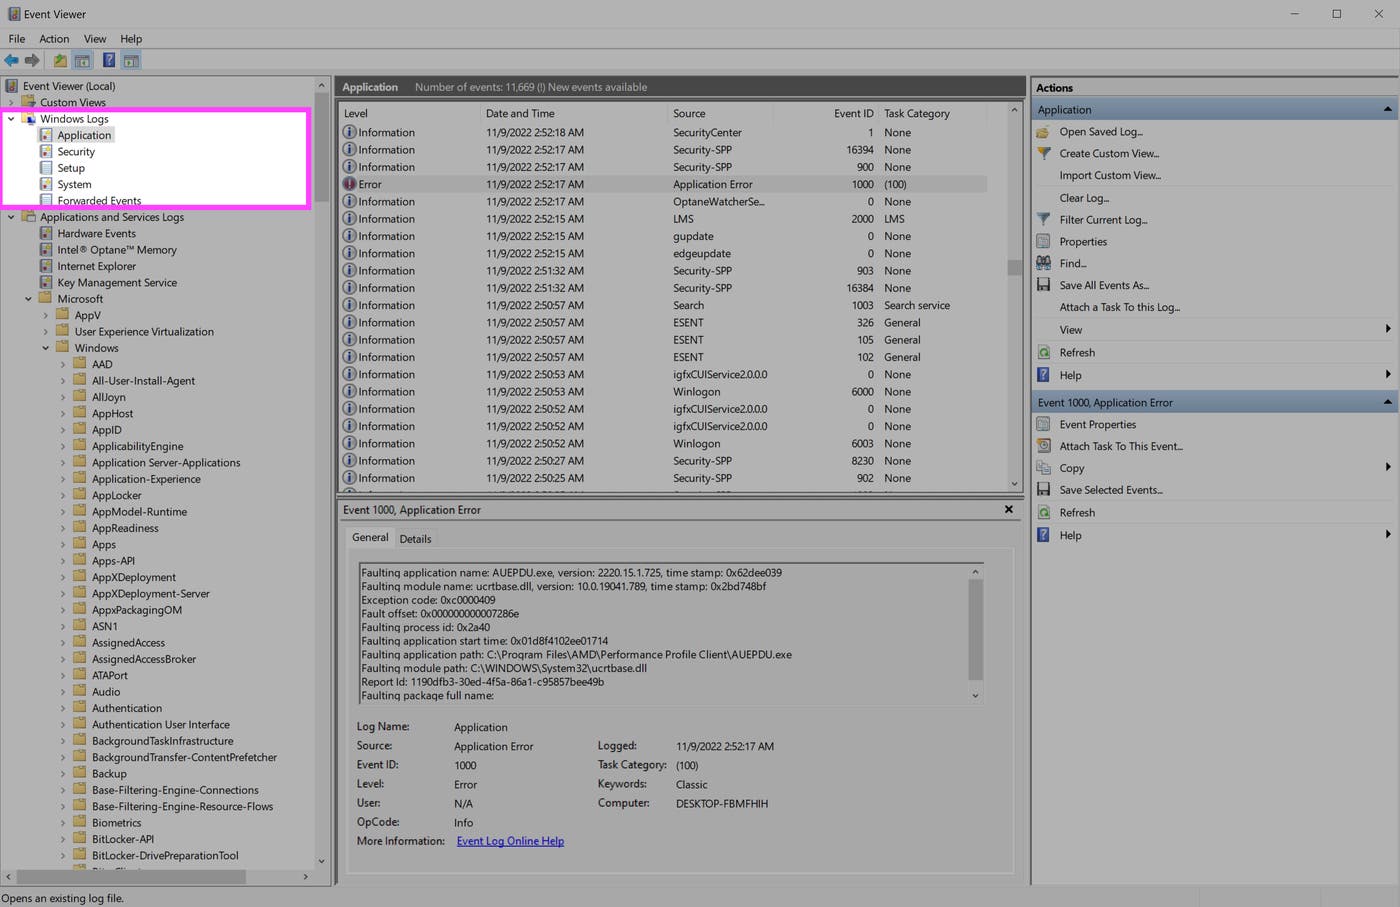
You can also view a list of available channels on your system by running the following Powershell command:
Event logs are assigned an event type based on the event’s severity or intended purpose. Event types enable you to precisely query and analyze your Windows event logs, so you can quickly identify those that require an immediate response.
| Event Type | Description | Example |
|---|---|---|
| Information | An event that is typically a standard operation that does not require investigation. | The successful completion of a scheduled Windows task. |
| Warning | An event that may indicate an impending problem, but also may not necessarily be relevant. | An application loads a functional, but outdated, dependency. |
| Error | An event that prevents the system or application from operating as intended. | Unexpected application crash or failure to load a critical module. |
| Successful/failed audit | An event that records a successful or failed security access attempt. | Creating a user account or accessing a network drive. |
In this section, we’ll cover key Windows events that can help you detect potential security breaches and other issues in your environment. We’ll also show you how to monitor them with Datadog dashboards and monitors.
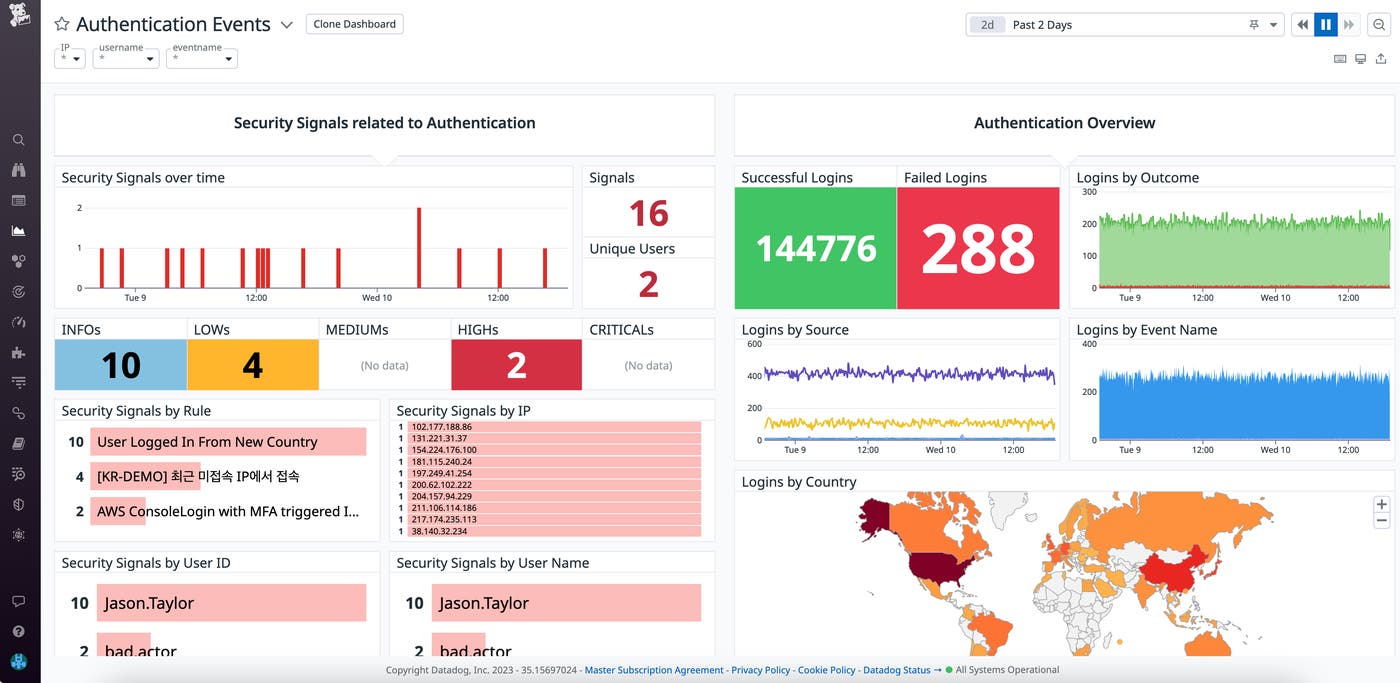
Logon events are one of the most useful events to monitor—they can be useful for security audits, tracing a user’s digital footprint, and tracking suspicious activity. For example, if your event logs show a string of failed logon attempts from the same origin, followed by a successful logon, it could indicate that a brute force attack succeeded in penetrating your environment. You can use Datadog’s Authentication Events dashboard to visualize and correlate logons that occur across your environment.
If you use Kerberos authentication to provide an additional layer of security when verifying a user’s identity, Windows will generate separate events for these authentication attempts (event IDs: 4768, 4771). These event logs can provide additional context when attempts fail, such as which specific authentication step failed.
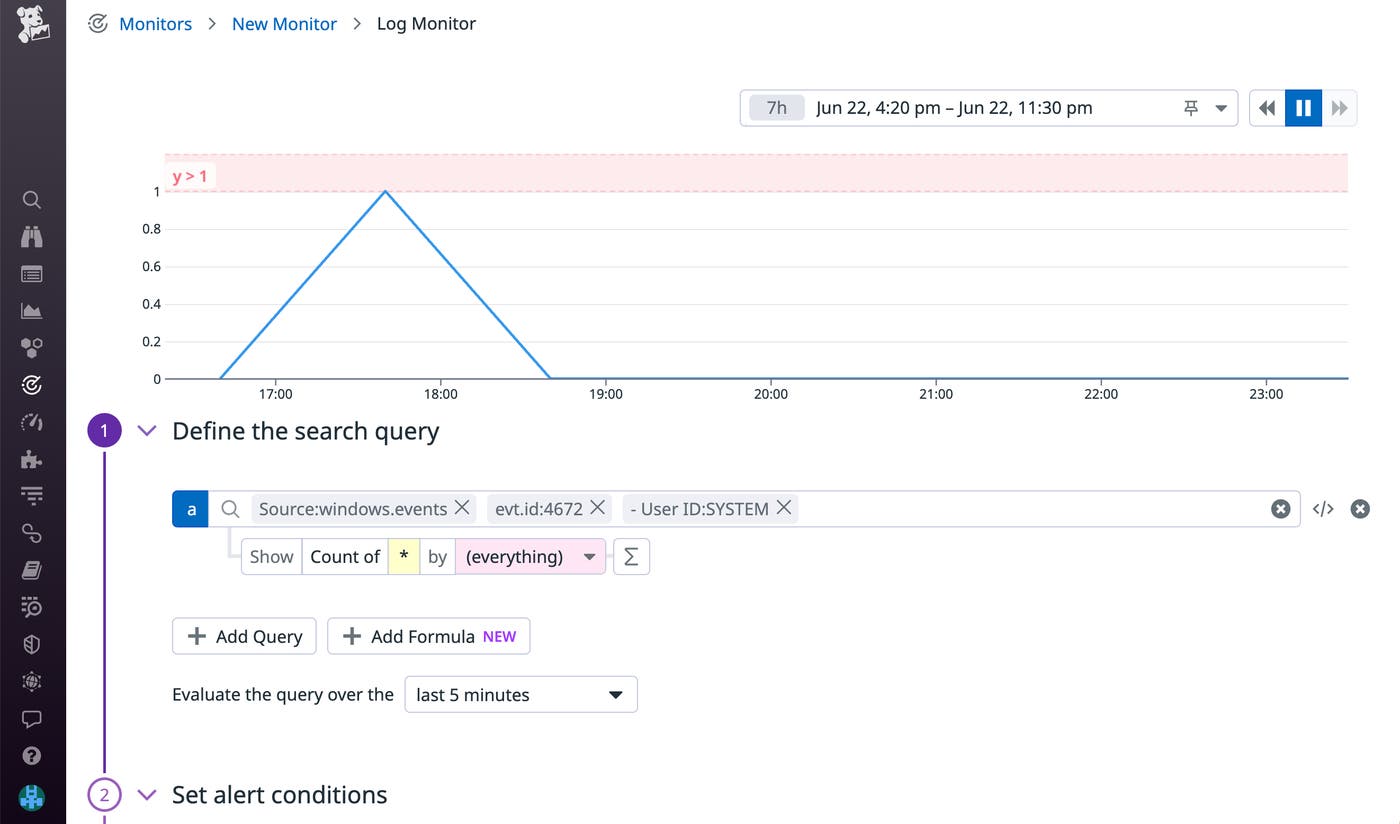
This event indicates when a user with admin-level privileges logs on to your local system. Admin-level privileges are typically reserved for service accounts to run scheduled tasks and maintenance. Because these privileges enable you to circumvent a number of security controls, it’s especially important to monitor this type of event. For example, you can set up a log monitor that notifies you when a user that is not a service account is assigned admin privileges.
Windows records audit events when certain changes are made to user accounts and security groups, such as:
We recommend monitoring all changes made to security groups and accounts that have high levels of access. Abnormal patterns in these event logs may indicate that an account has been compromised.
Datadog Cloud SIEM provides out-of-the-box detection rules for Windows, enabling you to monitor suspicious activity in your systems. For example, the detection rule shown below automatically generates a security signal when the domain administrator group is changed, enabling you to take immediate action and investigate.
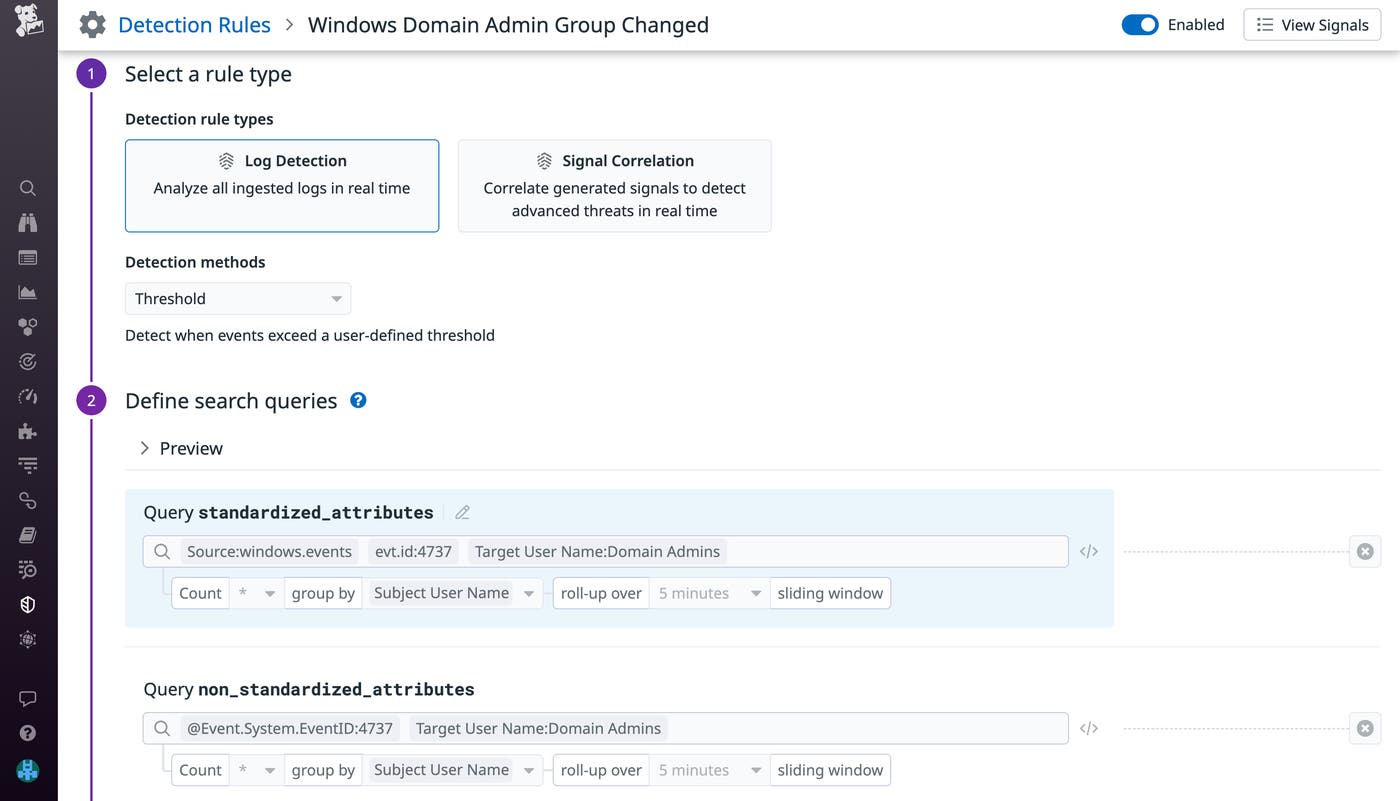
Attackers can use groups as a way to identify an account that is easy to compromise—such as a user who has left the organization—and use that account to avoid detection and take a stronger foothold in your organization. Routinely reviewing changes to accounts, groups, and privileges enables you to improve security and identify potential risks.
The Windows Task Scheduler enables you to schedule automatic tasks on your system at a given time or in response to specific triggers. Using the Task Scheduler, you can configure key applications to launch when your system reboots or run daily checks and updates. However, the Task Scheduler also presents a security risk due to its ability to run recurring executables in your environment. For example, attackers can take advantage of this by creating scheduled tasks that enable malware to remain in your environment following system reboots.
When monitoring this event, you should take particular note of the task’s file path. Tasks scheduled by malware or otherwise manually created are often executed from the Task Scheduler Library’s root node, such as the <\phantom-gaslight> task shown below.
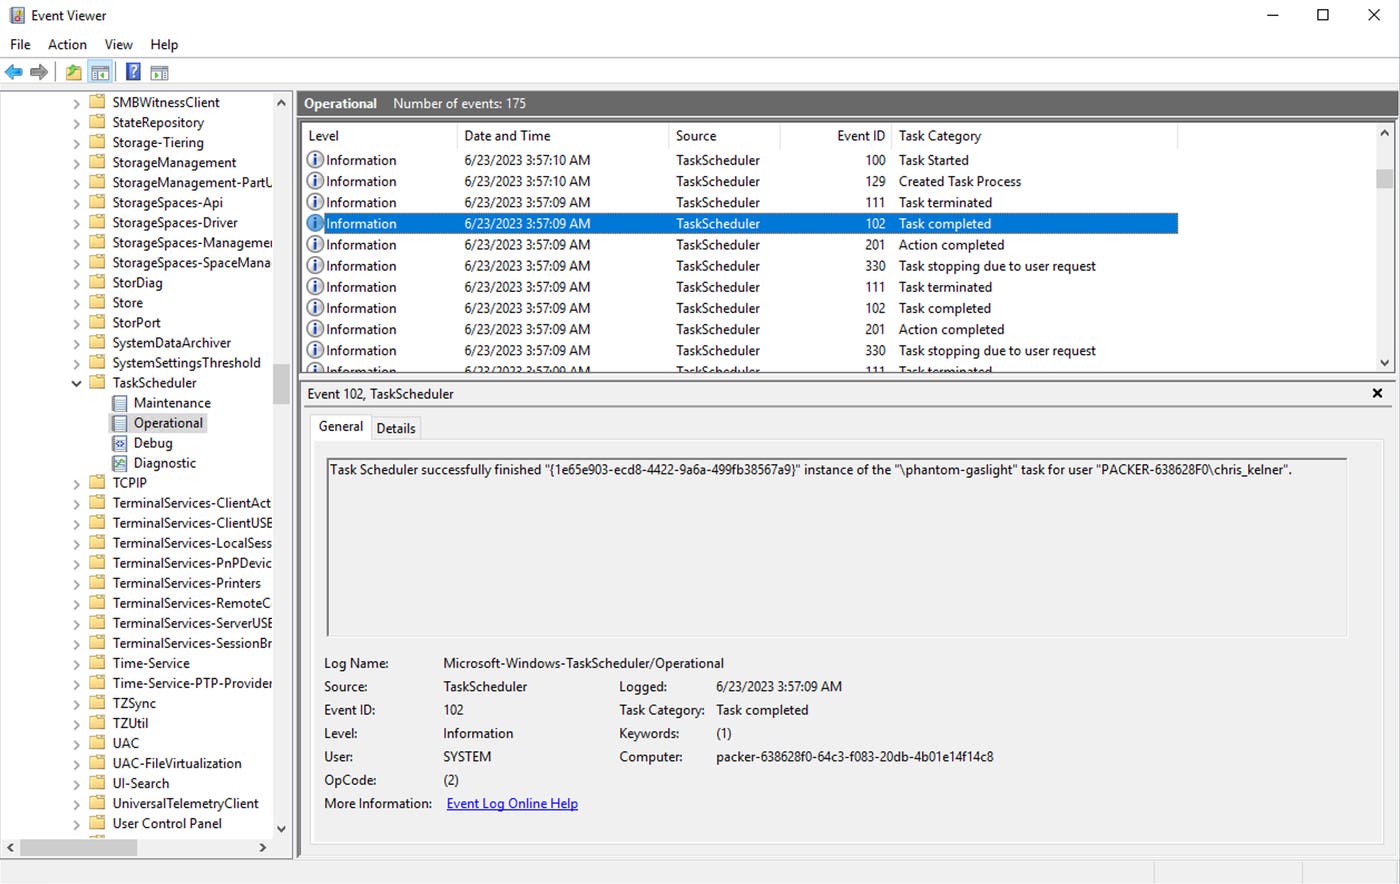
You can also use Windows Task Scheduler event logs to monitor the execution and completion of your scheduled tasks. This can be useful for troubleshooting failed tasks or confirming that your automated workloads are properly configured.
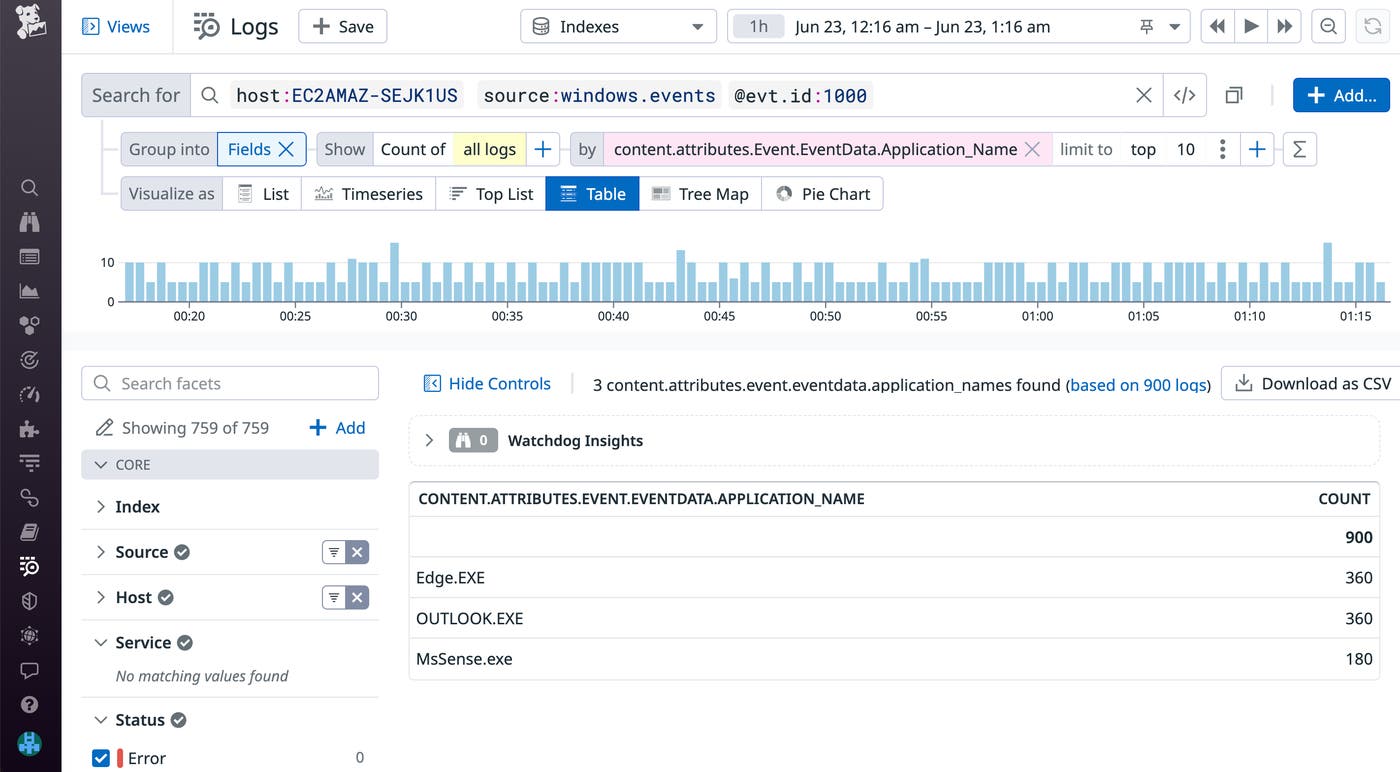
When an application crashes on your machine, you’ll likely want to be notified because it can lead to issues such as corrupted system files, missing modules, or even potential malware. Tracking these events is important when you’re running background applications—otherwise, if an error occurs that causes these applications to crash, no visual indicators are thrown.
You can visualize your Windows application crashes using a timeseries graph or table that you can include in a dashboard alongside other application health metrics.
If Microsoft Defender Antivirus is a critical component in your environment’s initial line of defense, you’ll likely want to monitor several of the Windows event logs generated for this service. These include the detection of malware (ID: 1006; shown below) and the failure or successful completion of countermeasures (IDs: 1007, 1008). Event logs are also generated for the completion of malware scans (ID: 1001), so you can track these logs to ensure that routine checks are being performed on your environment.
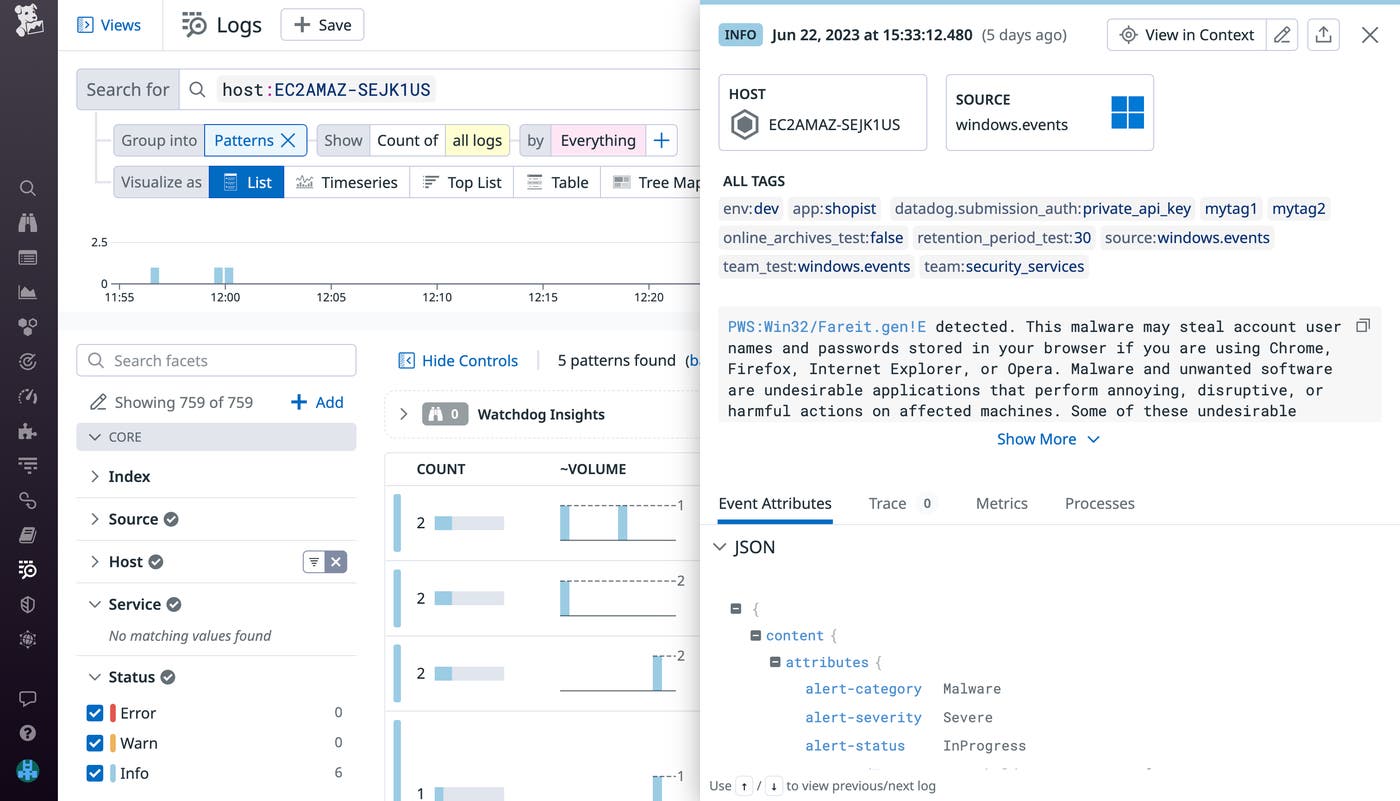
You can easily configure Datadog to alert you when antimalware actions critically fail (ID: 1119) so you can immediately respond by verifying your user permissions and endpoints.
Monitoring Windows event logs can help you improve the health and security of your environment. To learn more about key Windows events to monitor, we recommend looking through Microsoft’s appendix. In order to collect Windows event logs as Datadog logs, you’ll need to configure the channels you want to monitor in the win32_event_log.d/conf.yaml configuration file. After your event logs are in Datadog, you can use them to visualize, analyze, and alert on key events that could indicate unauthorized access and require immediate investigation.
If you’re just getting started with Windows and Datadog, check out our Windows installation guide using Ansible. If you don’t already have a Datadog account, you can sign up for a free 14-day trial today.
此内容由惯性聚合(RSS阅读器)自动聚合整理,仅供阅读参考。 原文来自 — 版权归原作者所有。