





Elevated connection churn can be a sign of an unhealthy distributed system. Connection churn refers to the rate of TCP client connections and disconnections in a system. Opening a connection incurs a CPU cost on both the client and server side. Keeping those connections alive also has a memory cost. Both the memory and CPU overhead can starve your client and server processes of resources for more important work. Furthermore, a TCP or TLS connection makes several round trips between client and server, adding latency to any API request that creates a new connection. Because of these risks, connection churn is an important metric to watch for teams trying to ensure high performance and lower overhead cost.
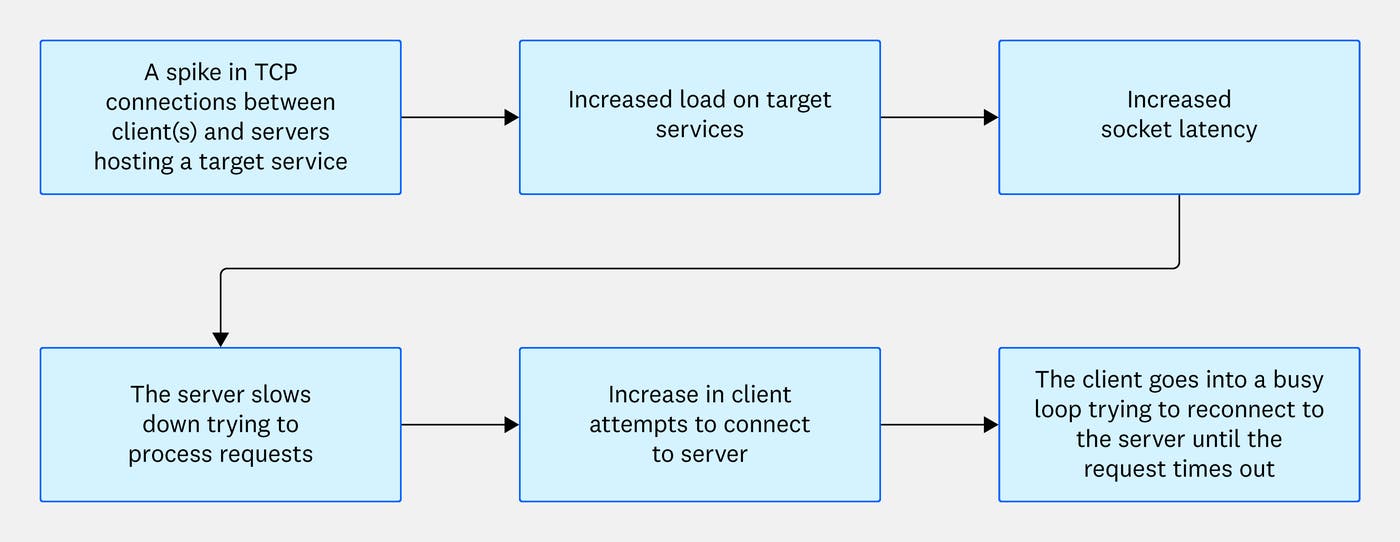
Engineers are not always able to easily understand that an issue they’re encountering (e.g., increased latency or a networking failure) is due to connection churn, or where exactly in their distributed system the connection churn is occurring. To detect elevated connection churn, it’s important to gather monitoring data on all of your distributed services. Once you’re collecting this telemetry, there are a number of best practices—such as tracking the number of established and closed connections, and monitoring the latency of TCP sockets—that will help you detect and troubleshoot connection churn, as well as determine its root cause.
In this post, we’ll show you:
The common symptoms of connection churn
The causes of connection churn and how to troubleshoot them
How to use Datadog to monitor and pinpoint the root cause of connection churn in a distributed system
When there are issues impacting your system, it can be difficult to determine whether connection churn is behind them. Here are some key indicators to look out for that can alert you early on that you may be experiencing connection churn, so you can investigate the issue further.
TCP socket latency refers to the time delay experienced during the transmission of data over a TCP connection. High socket latency can indicate that system resources are being exhausted due to the rapid opening and closing of connections. This can slow down connection establishment as the system struggles to manage the high churn rate. High connection churn can also lead to increased timeouts in TCP connections, which can in turn result in increased latency. As such, latency spikes can be a telltale sign that excessive connection creation and termination are leading to performance degradation and resource issues.
Connection churn can lead to request bottlenecks in a system due to the overhead associated with repeatedly creating and closing network connections. Request bottlenecks can cause the system to become slow at handling additional incoming requests, reducing the overall request processing capacity. This can have a cascading impact—for example, it may cause downstream services to experience latency or even failure due to the upstream service experiencing the bottleneck.
To identify bottlenecks, you need to monitor health metrics for each component of your data pipeline, such as throughput, processing latency, and error rate. You’ll want to establish what a healthy, consistent baseline is for these metrics so that you’ll be able to detect a spike indicative of a bottleneck.
Connection churn can reduce the overall throughput of a system because repeatedly establishing connections consumes time and resources that would otherwise be used for data transfer. For example, each new connection typically requires a handshake process, such as a TCP three-way handshake or an SSL/TLS handshake.
With high churn, a significant portion of the system’s processing power is spent on these overhead operations rather than on actual data transmission, reducing overall throughput. Additionally, every time a connection is opened or closed, the server must perform setup and teardown operations, such as allocating and freeing memory, managing session states, and handling encryption keys. High churn means these operations are performed repeatedly at a higher-than-usual rate, consuming resources that would otherwise be available for processing and transmitting data.
Connection churn can affect systems for a number of different reasons. In order to troubleshoot connection churn, it’s important to first understand the root cause. The following are common causes of connection churn and suggestions for how to troubleshoot each of them.
A spike in users is often a good thing for a company—it can occur during Black Friday sales or new feature releases, for example. But such spikes can also result in connection churn because the load is too high for the current number of servers. If you are experiencing a surge of new users, you should consider monitoring your new connections to stay ahead of potential connection churn caused by the surge.
Scaling up—i.e., adding more servers to handle the connection— will bring down TCP socket latency and alleviate the problem. Alternatively, you can spread the load more evenly between servers by using load balancers (e.g., HAProxy, Istio, Envoy, or NGINX) to reduce the impact of the increased load on a specific server instance or replica.
There are a number of different service misconfigurations that can lead to connection churn. For instance, a network misconfiguration or firewall could be unintentionally preventing network communication, or low timeout settings could be causing sessions to expire too quickly, leading to frequent reconnections.
If a service is misconfigured or incompatible with other systems in a workflow, it may result in unreliable performance or frequent downtime, which can cause user connections to that service to churn. There are a number of signals that could indicate a misconfigured service is causing connection churn. A spike in TCP socket latency, combined with a discrepancy between established and closed connections, could point toward an issue with your service’s timeout settings. Additionally, if you’ve made a recent deployment or update to the service that’s experiencing connection churn, this could suggest that the recent change introduced a misconfiguration.
To determine whether connection churn is a result of a misconfigured service, start by checking for application errors that cause disconnections, such as server timeouts. If timeouts are found, this suggests that the issue may be due to misconfigured timeout settings.
Alternatively, you can check for client code that automatically tries to reconnect when it encounters a TCP failure of any sort. If the TCP failure happens before the connection is even made (or very early on in the protocol exchange), then the client can go into a near-busy loop, constantly making connections. If you discover that the client code is misconfigured to automatically retry, you can implement exponential backoff instead, so that you immediately reconnect when the first connection fails. If it fails again within a short time (e.g., 30 seconds), then the client will wait two seconds before reconnecting. If the connection fails again within 30 seconds, the client will wait four seconds, and so on.
Additionally, you should ensure that you have enabled connection pooling. Connection pooling is a technique used to manage connections in a way that improves performance and resource utilization. Instead of opening and closing a new connection for each operation, connection pooling maintains a cache of active connections that can be reused by the application, thus reducing the overhead associated with establishing new connections. If you’re using an HTTP API or a database, there’s a good chance there are settings to enable connection pooling.
Finally, if your services are experiencing high connection churn, it might be because they need to be behind an easily scalable load balancer (e.g., HAProxy for regular APIs, or PgBouncer for PostgreSQL). Load balancers can help prevent connection churn by distributing incoming traffic more evenly across multiple servers, ensuring efficient use of resources and maintaining stable connections.
Monitoring distributed services for signals of connection churn can be challenging without a unified monitoring platform. Datadog Network Performance Monitoring (NPM) and Universal Service Monitoring (USM) are two technologies that make monitoring connection churn much easier for users.
Both NPM and USM rely on eBPF, which helps simplify the process of collecting and monitoring these types of metrics. eBPF technology enables NPM and USM to monitor kernel events, such as network traffic and disk I/O, without the customer needing to change or redeploy their application. Using eBPF, NPM is able to track the kernel TCP methods and get information about every established and closed connection, including latency, the round trip time, the error rate, and more.
NPM enables you to easily track the number of established connections and closed connections. You can also use NPM to monitor latency over TCP sockets and alert you if a TCP network metric crosses a certain threshold.
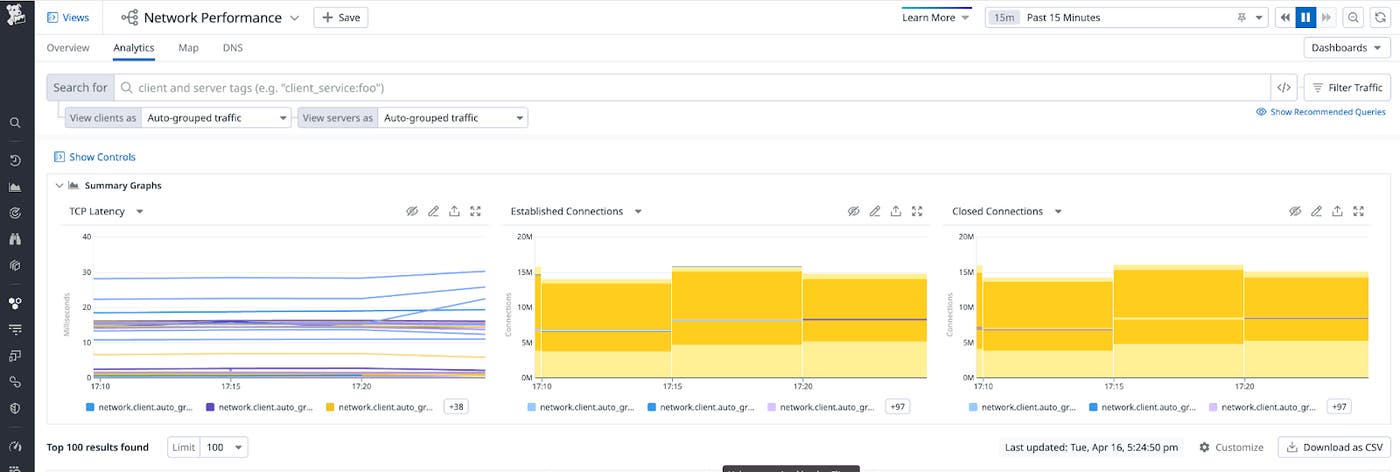
Additionally, NPM gives you context to help determine what the cause of connection churn is. For instance, you might see an increase in connection churn to server:X, group traffic by client service, and identify a client service that’s unexpectedly churning connections.
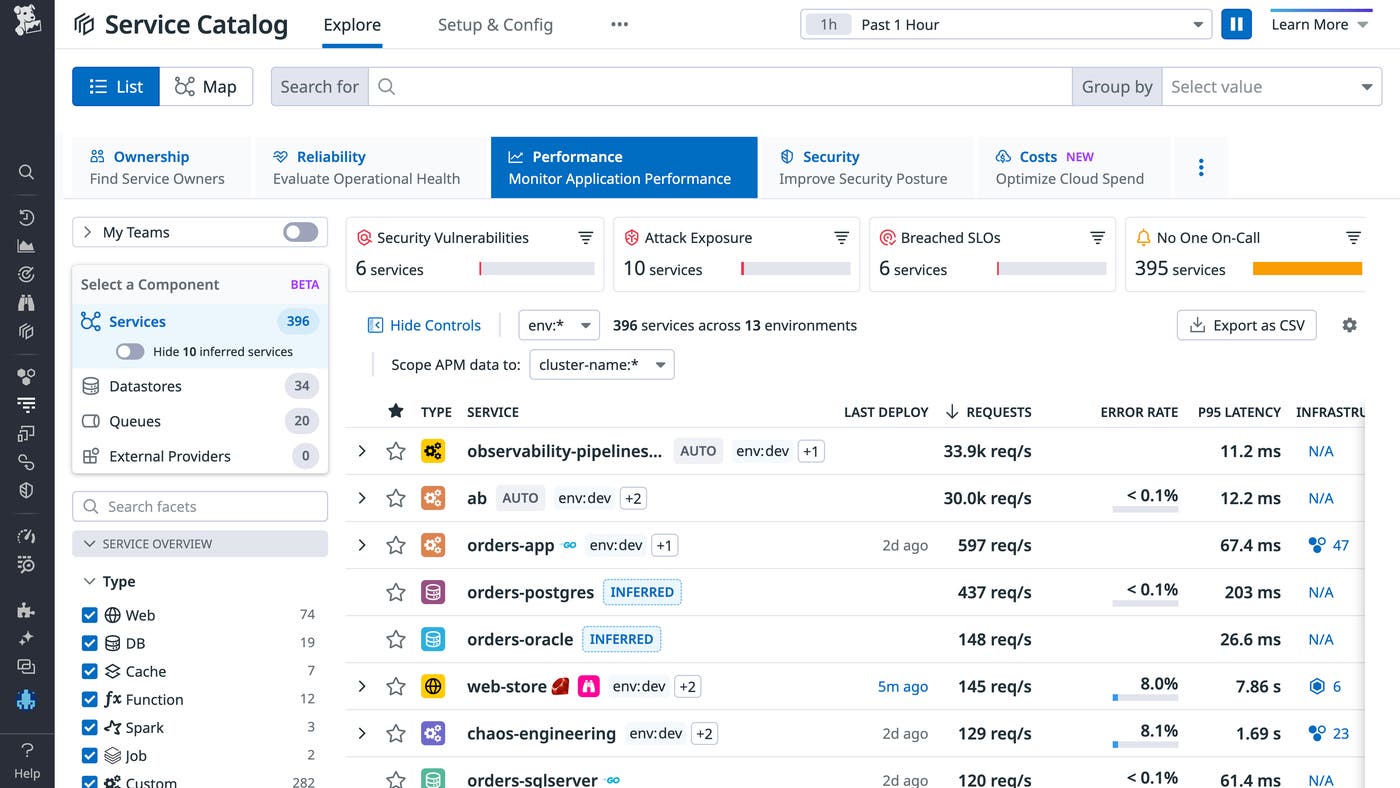
If connection churn can’t be traced to a service you own, you can pivot to USM to obtain RED metrics (request, error, and duration) from all your services, allowing you to search elsewhere for the cause.
Connection churn can cause issues such as latency and service failure that can cascade up or downstream in the pipeline. It takes time, effort, and a comprehensive monitoring strategy to trace the root cause of an issue—such as an unresponsive service or a network connection issue—to connection churn, especially in a distributed system at scale.
In this post, we broke down the common causes of connection churn and provided examples of how to troubleshoot them. We also explained how Datadog makes it easy to monitor and root-cause connection churn using USM and NPM, which rely on eBPF to provide kernel-level insights into events taking place in your environment.
Check out our NPM and USM documentation to get started monitoring connection churn across your system. If you’re new to Datadog, sign up for a 14-day free trial.
此内容由惯性聚合(RSS阅读器)自动聚合整理,仅供阅读参考。 原文来自 — 版权归原作者所有。