





XDP, or eXpress Data Path, is a Linux networking feature that enables you to create high-performance packet-processing programs that run in the kernel. Introduced in Linux 4.8 and built on extended Berkeley Packet Filter (eBPF), XDP provides a mechanism to process network packets earlier and faster than is possible through the kernel’s native network stack.
In this post, we’ll discuss:
Challenges with the traditional network stack
Packet flow in the kernel with XDP
The mechanics of XDP programs
How to build a simple XDP program
The Linux kernel’s network stack is designed to be flexible and support a wide range of networking protocols and features, but the cost of this versatility is high overhead. By default, packets go through a large number of steps before they can be passed to any application. When an incoming packet arrives at a network interface card (NIC), that packet is first transferred into a ring buffer in the kernel called the rx_ring. The packet is then copied to an instance of a data structure in the kernel network stack called an sk_buff, which stores the raw packet data and packet metadata. This data structure provides a rich set of packet-processing features, such as header parsing, checksumming, and fragmentation. Once in an sk_buff, the packet is directed to the appropriate packet handler, after which it is sent up the stack for further processing.
Note: The sk_buff data structure type, which is defined in the Linux kernel, is also known as a socket buffer or SKB. It is used to store information about the packet, such as its size, protocol, and other metadata. See here for the full specs about this struct.
Despite the rich set of features in the sk_buff, copying each packet to an instance of this data structure can be especially slow and costly. This process can affect the performance of traditional packet-processing solutions, such as Netfilter hooks. The high overhead built into the native network processing is particularly problematic for applications that require high performance, such as DDoS protection and firewall applications.
One way to improve the efficiency of packet processing, therefore, would be to process the packet before it gets copied to an sk_buff struct, as shown below:
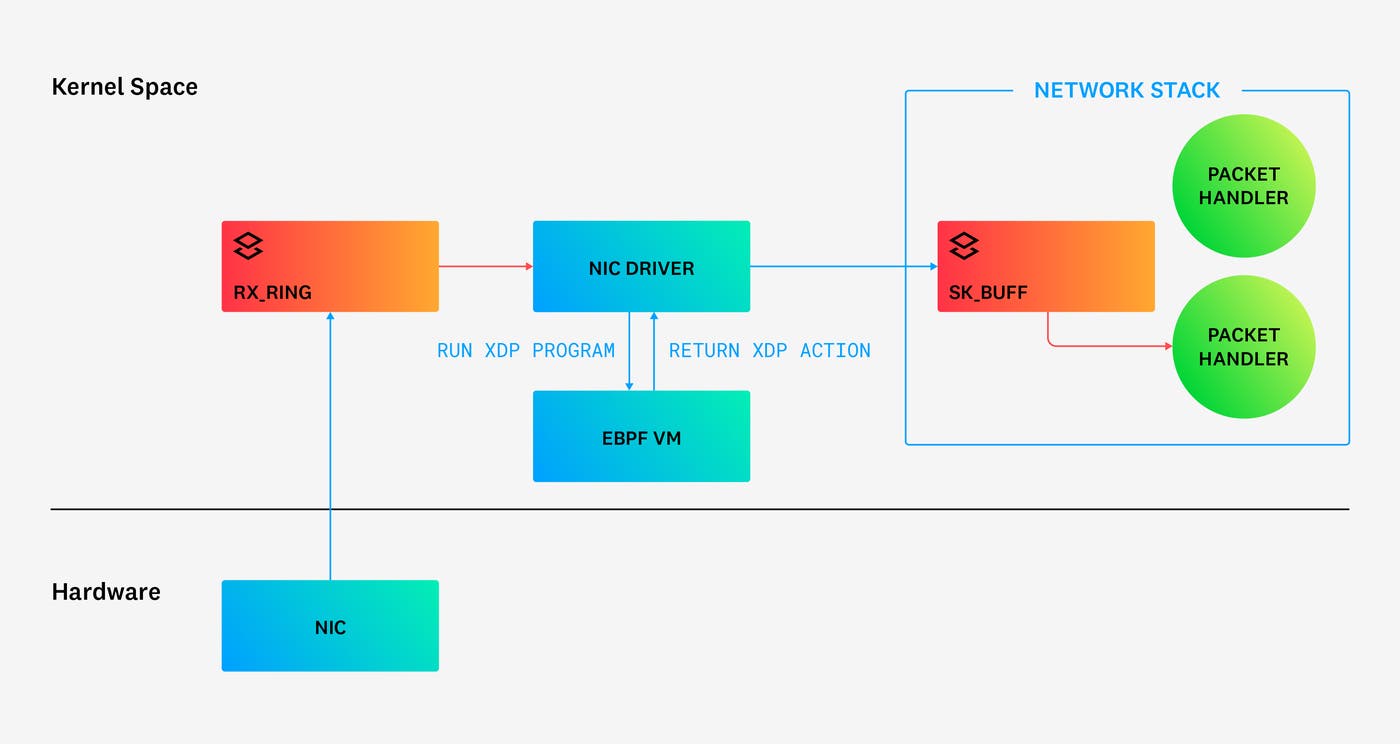
An XDP program is an eBPF-based program that typically runs as a hook point in the NIC driver. An XDP program can therefore handle a packet and decide its fate as early as it comes in—even before it is handed off to the network stack. (Note: XDP programs can also run in two other ways, which we will discuss later.)
More specifically, an XDP program normally operates on the rx_ring buffer before the packet gets copied to an sk_buff. This design allows for XDP packet handlers to run extremely early while also enjoying the speed and safety benefits available to eBPF programs.
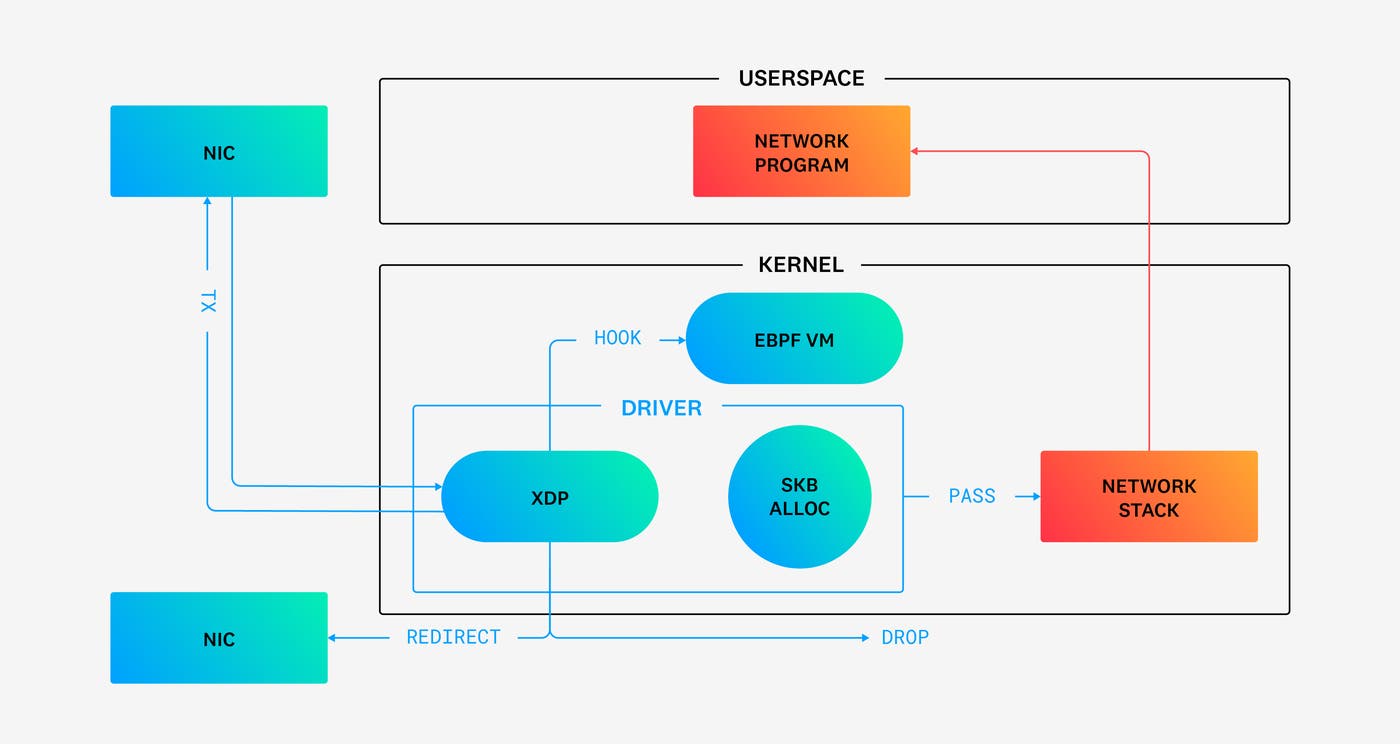
The following diagram illustrates packet flow in the kernel with XDP. After a NIC at the top left receives a packet, the packet is picked up by the NIC driver. An XDP hook in the driver then allows an XDP program to process the packet immediately in the eBPF virtual machine. The XDP program can then perform processing on the packet itself. Next, it can allow selected packets to bypass the kernel’s network stack by redirecting the packet to another NIC (REDIRECT) or by re-transmitting it out the same NIC (TX). Alternatively, the XDP program can drop selected packets (DROP) or allow others to continue through to the network stack (PASS).
XDP programs all generally run according to a similar pattern and share common features. For example, they all can perform a limited set of predefined actions and run in various predefined execution modes. However, before we can delve into these details, it’s important to understand some basic conditions that are in place even before an XDP program runs:
An XDP program is attached to a specific NIC in a machine and can process incoming packets from that NIC only. (If there are two or more NICs, the program will see the packets coming only from the specific NIC it is attached to.)
An XDP program is visible only to incoming packets.
The Linux kernel defines a struct called xdp_md that contains information about an incoming packet, such as its location in memory and its size. The xdp_md struct is lightweight and optimized for fast packet-processing. It is also the struct that a coder uses to process and manipulate the packet in an XDP program.
With those preliminaries covered, we can now look at how XDP programs flow, the actions they can take via return codes, and the different modes in which they operate.
After an XDP program is triggered, it generally runs according to the following three-step pattern:
Receive the raw packet as input (given by the xdp_md struct).
Do some processing on the packet. For example, the program might derive some insights based on its metadata or modify the packet in some way.
Determine the action to perform on the packet (for example, pass it, drop it, or retransmit it).
XDP programs use return codes to determine the action the Linux kernel should perform on a network packet. The following return codes and actions are available for an XDP program:
XDP_PASS: Indicates that a packet should be passed up the traditional Linux network stack for further processing.
XDP_DROP: Indicates that the packet should be dropped and not processed any further.
XDP_TX: Indicates that the packet should be transmitted out of the same NIC through which it was received, bypassing the traditional network stack. This could be used, for example, with a load balancer that redirects packets to the same interface with a different address.
XDP_REDIRECT: Indicates that the packet should be redirected to another NIC for processing.
XDP_ABORTED: Unlike the previous examples, this return code should not be manually included within a functional program. Instead, an XDP program returns this code automatically when it encounters an error during execution. This action results in the packet being dropped.
The following XDP program provides a simple example of how return codes can be used. Ignoring the eBPF-related requirements (the #include directives and SEC macro), we can see that this program merely defines a function xdp_drop_all that is called for every packet that the function takes as input (which is every packet that passes through the XDP hook). The function returns a code called XDP_DROP but performs no other processing on the packet itself. In other words, the program tells the kernel to drop the current packet and not process it further. Every packet that arrives on the NIC will therefore be dropped when this XDP program is running.
#include <linux/bpf.h>
#include <bpf/bpf_helpers.h>
SEC("xdp")
int xdp_drop_all(struct xdp_md *ctx)
{
return XDP_DROP;
}
For more information about the different return codes, check out the XDP actions documentation.
We have indicated that a typical XDP program is attached as a hook point in the NIC driver. This is the most common execution mode, called native mode. However, there are actually two other modes or contexts in which an XDP program can run:
Offloaded (on the NIC)
Some NICs (SmartNICs) offer the ability to completely offload the XDP program from the CPU to the NIC itself. This is the preferred mode of operation when available, and it allows the XDP program to run very early and extremely fast.
Generic (in the traditional network stack)
Some NIC drivers lack an integration with XDP, so an XDP program cannot be loaded to that specific NIC or attached to the driver as a hook point. In this case, the XDP program is loaded as a generic program that is handled by the Linux kernel’s traditional network stack. The downside is that the performance will be slower.
Check out the BPF Compiler Collection (BCC) repository for a list of drivers that support XDP.
In this section, we build a simple XDP program along with an XDP runner responsible for loading it, attaching the XDP program to a NIC, and removing that XDP program as needed. The XDP runner will output a list of protocol names together with the number of packets that were captured for a specific protocol. The runner is based on this sample application and uses the BCC framework.
Note that this article contains only key portions of the source code. You can find the full code in our eBPF training repo. The repo also contains the instructions on how to load and test the program as well as a Docker image for easier setup.
Let’s begin by looking at the first piece of code within the XDP program:
int xdp_counter(struct xdp_md *ctx)
{
void *data = (void *)(long)ctx->data;
void *data_end = (void *)(long)ctx->data_end;
...
This snippet introduces the function xdp_counter that we are going to load as an eBPF program. In the function, the values data and data_end are pointers to the beginning and end, respectively, of the packet’s raw memory. Note that the original values ctx->data and ctx->data_end are of type __u32. Because we have to take the addresses as a pointer type, we have to cast these values to void *. (Most XDP programs start this way.)
We continue with the next portion of the function:
struct ethhdr *eth = data;
uint64_t network_header_offset = sizeof(*eth);
if (data + network_header_offset > data_end)
{
return RETURN_CODE;
}
In this snippet, we use the struct ethhdr to define an Ethernet frame header so that we can later easily access the fields of that frame. For our purposes, we are interested in the h_proto field, which will tell us if we need to parse the packet as an IPv4 or an IPv6 packet. (We will cover this in more detail later on in this section.)
Before we begin to view the packet data, we must verify that our operations will stay within the packet’s boundaries. To perform this check, we first store the expected size of the Ethernet header as a network header offset value. If we add network_header_offset to data (representing the address at which both the packet and the Ethernet header begins), the resulting memory address should point precisely to the next layer of the network protocol stack—that is, the start of the IP header—within the packet. However, if this sum overshoots the data_end pointer address (the address at which the entire packet ends), we know the packet is malformed, and we could be bypassing the boundaries of the packet simply by attempting to read its Ethernet header fields. In this case, we return the RETURN_CODE. (Note that the value of RETURN_CODE is defined to be XDP_PASS in line 12 of the full source code.) If we don’t perform this check, we may get the following error while trying to run the program:
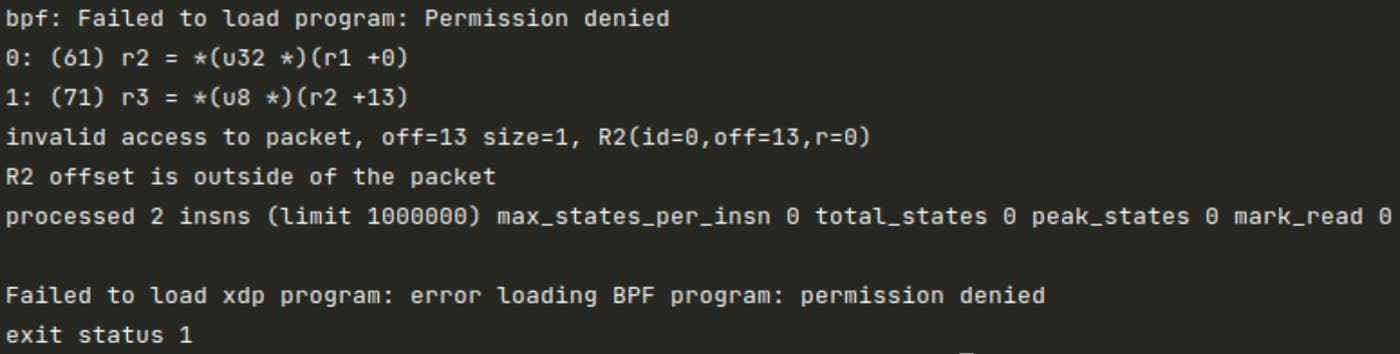
The eBPF verifier is responsible for this permission denied error and for refusing to load the program. The verifier, from its point of view, sees only that we are trying to access a memory area that is outside of the packet. Hence, we must add these bound checks so that our program can be loaded properly. This is a common pattern in XDP programs, and we will see it again soon.
Let’s continue with the next portion of the xdp_counter function:
uint16_t h_proto = eth->h_proto;
int protocol_index;
if (h_proto == htons(ETH_P_IP))
{
protocol_index = parse_ipv4(data + network_header_offset, data_end);
}
else if (h_proto == htons(ETH_P_IPV6))
{
protocol_index = parse_ipv6(data + network_header_offset, data_end);
}
else
{
protocol_index = 0;
}
In this section, we use the h_proto field to determine whether to parse the packet as IPv4 or IPv6. In either case, the appropriate function is called to parse the packet and return a protocol_index value.
Now let us look at the next section of the function:
if (protocol_index == 0)
{
return RETURN_CODE;
}
long *protocol_count = protocol_counter.lookup(&protocol_index);
if (protocol_count)
{
lock_xadd(protocol_count, 1);
}
return RETURN_CODE;
In this code snippet, we check if protocol_index is 0, which would indicate that the packet could not be identified as either IPv4 or IPv6. In this case, we simply return the RETURN_CODE (which, again, is set to XDP_PASS by default).
Otherwise, we look up the protocol_index value in a map called protocol_counter, which maps a protocol index to a count of packets. We then increment the protocol count for the specific protocol_index we captured, and return the RETURN_CODE.
Note: XDP programs, like all other eBPF programs, can communicate with other eBPF programs or with the userspace through a concept called eBPF maps. For more information about eBPF maps, check out the documentation.
Next, let’s look at another function in the xdp_prog.c file, specifically, the utility function parse_ipv4 used to parse the IPv4 protocol:
static inline int parse_ipv4(void *ip_data, void *data_end)
{
struct iphdr *ip_header = ip_data;
if ((void *)&ip_header[1] > data_end)
{
return 0;
}
return ip_header->protocol;
}
In this function, we create an instance of the iphdr struct to easily extract the packet’s protocol. To satisfy the requirements of the eBPF verifier, we then perform the check to make sure the end of iphdr is not beyond the end of the data buffer. Finally, we return the protocol number.
Note that the parse_ipv6 function is very similar, but it uses the ipv6hdr struct instead.
That is all we need for our XDP program main logic. Now let’s turn our attention to the runner.
The runner takes two arguments: the XDP program file path (xdp_prog.c in our case), and the name of the NIC to attach this XDP program to. (The easiest way to specify the name of the NIC is to use the lo interface, which stands for the loopback interface. However, you can also run ip link to show all available NICs on the machine.)
You can see the full version of the runner in our repo. But for now, let’s begin by looking at this first snippet, taken from near the beginning of the main function:
bpfSourceCodeFile := os.Args[1]
bpfSourceCodeContent, err := ioutil.ReadFile(bpfSourceCodeFile)
if err != nil {
fmt.Fprintf(os.Stderr, "Failed to read bpf source code file %s with error: %vn", bpfSourceCodeFile, err)
os.Exit(1)
}
module := bcc.NewModule(string(bpfSourceCodeContent), nil)
defer module.Close()
fn, err := module.Load("xdp_counter", C.BPF_PROG_TYPE_XDP, bpfDefaultLogLevel, bpfLogSize)
if err != nil {
fmt.Fprintf(os.Stderr, "Failed to load xdp program: %vn", err)
os.Exit(1)
}
device := os.Args[2]
err = module.AttachXDP(device, fn)
if err != nil {
fmt.Fprintf(os.Stderr, "Failed to attach xdp program: %vn", err)
os.Exit(1)
}
defer func() {
if err := module.RemoveXDP(device); err != nil {
fmt.Fprintf(os.Stderr, "Failed to remove XDP from %s: %vn", device, err)
}
}()
This code uses the BCC framework to load the XDP program to memory, attach it to the kernel, and set a callback function to remove it when the main function returns.
Next, let’s look at the following section:
protocolCounter := bcc.NewTable(module.TableId("protocol_counter"), module)
<-sig
fmt.Printf("n{IP protocol}: {total number of packets}n")
for it := protocolCounter.Iter(); it.Next(); {
key := protocols[bcc.GetHostByteOrder().Uint32(it.Key())]
if key == "" {
key = "Unknown"
}
value := bcc.GetHostByteOrder().Uint64(it.Leaf())
if value > 0 {
fmt.Printf("%v: %v packetsn", key, value)
}
}
Here once again we are using the BCC framework—this time to retrieve the eBPF map called protocol_counter that we saw in the XDP program. Once the runner receives a signal to stop, we tally all protocols in the map and print the total count of each type to the user.
That’s it for our XDP runner. We encourage you to follow the README of this walkthrough and try to run it for yourself!
XDP gives developers a way to create high-performance programs that process network packets before they are picked up by the kernel’s network stack. Based on eBPF technology, XDP programs run safely in kernel space after code verification and can be especially useful for high-performance observability tools, load balancers, firewalls, and DDoS protection. Perhaps most importantly, it’s fairly easy to create and load an XDP program with the help of existing libraries, such as the BCC framework, as well as XDP’s rich toolset.
If you’re running XDP programs, you may be interested to know that the Datadog Agent’s network check provides metrics to count the different XDP return codes within queues. Additionally, Datadog uses eBPF technology to build Universal Service Monitoring, Workload Protection, and Network Performance Monitoring and plans to further expand capabilities that leverage eBPF in the future. We’re also hiring engineers interested in eBPF, so if that describes you, we encourage you to take a look at our job openings.
For more in-depth information about how eBPF works and how Datadog uses it, you can watch our Datadog on eBPF video or read our eBPF blog post. And to get started with Datadog, you can sign up for our 14-day free trial.
GitHub - xdp-project/xdp-tutorial: XDP tutorial: Github repository containing many hands-on tutorials about XDP
BPF and XDP Reference Guide: Cilium 1.11.1 documentation
Netdev 2.1 XDP for the Rest of Us By Andy Gospodarek + Jesper Dangaard Brouer
xdp-tools/xdp-filter at master · xdp-project/xdp-tools: Filtering example for XDP - with exceptional performance
此内容由惯性聚合(RSS阅读器)自动聚合整理,仅供阅读参考。 原文来自 — 版权归原作者所有。