











Container technologies have taken the infrastructure world by storm. Ideal for microservice architectures and environments that scale rapidly or have frequent releases, containers have seen a rapid increase in usage in recent years. But adopting Docker, containerd, or other container runtimes introduces significant complexity in terms of orchestration. That’s where Kubernetes comes into play.
Kubernetes, often abbreviated as “K8s,” automates the scheduling, scaling, and maintenance of containers in any infrastructure environment. First open sourced by Google in 2014, Kubernetes is now part of the Cloud Native Computing Foundation.
Just like a conductor directs an orchestra, telling the musicians when to start playing, when to stop, and when to play faster, slower, quieter, or louder, Kubernetes manages your containers—starting, stopping, creating, and destroying them automatically to reflect changes in demand or resource availability. Kubernetes automates your container infrastructure via:
Container scheduling and auto-scaling
Health checking and recovery
Replication for parallelization and high availability
Internal network management for service naming, discovery, and load balancing
Resource allocation and management
Kubernetes can orchestrate your containers wherever they run, which facilitates multi-cloud deployments and migrations between infrastructure platforms. Hosted and self-managed flavors of Kubernetes abound, from enterprise-optimized platforms such as OpenShift and Pivotal Container Service to cloud services such as Google Kubernetes Engine, Amazon Elastic Kubernetes Service, Azure Kubernetes Service, and Oracle’s Container Engine for Kubernetes.
Since its introduction in 2014, Kubernetes has been steadily gaining in popularity across a range of industries and use cases. Datadog’s research shows that almost one-half of organizations running containers were using Kubernetes as of November 2019.
At the lowest level, Kubernetes workloads run in containers, although part of the benefit of running a Kubernetes cluster is that it frees you from managing individual containers. Instead, Kubernetes users make use of abstractions such as pods, which bundle containers together into deployable units (and which are described in more detail below).
Kubernetes was originally built to orchestrate Docker containers, but has since opened its support to a variety of container runtimes. In version 1.5, Kubernetes introduced the Container Runtime Interface (CRI), an API that allows users to adopt any container runtime that implements the CRI. With pluggable runtime support via the CRI, you can now choose between Docker, containerd, CRI-O, and other runtimes, without needing specialized support for each technology individually.
Kubernetes pods are the smallest deployable units that can be created, scheduled, and managed with Kubernetes. They provide a layer of abstraction for containerized components to facilitate resource sharing, communication, application deployment and management, and discovery.
Each pod contains one or more containers on which your workloads are running. Kubernetes will always schedule containers within the same pod together, but each container can run a different application. The containers in a given pod run on the same host and share the same IP address, port space, context, namespace (see below), and even resources like storage volumes.
You can manually deploy individual pods to a Kubernetes cluster, but the official Kubernetes documentation recommends that users manage pods using a controller such as a deployment or replica set. These objects, covered below, provide higher levels of abstraction and automation to manage pod deployment, scaling, and updating.
Pods run on nodes, which are virtual or physical machines, grouped into clusters. The control plane, which runs on each cluster, consists of four key services for cluster administration:
The API server exposes the Kubernetes API for interacting with the cluster
The Controller Manager watches the current state of the cluster and attempts to move it toward the desired state
The Scheduler assigns workloads to nodes
etcd stores data about cluster configuration, cluster state, and more
To ensure high availability, you can run multiple control plane nodes and distribute them across different zones to avoid a single point of failure for the cluster.
All other nodes in a cluster are workers, each of which runs an agent called a kubelet. The kubelet receives instructions from the API server about the makeup of individual pods and makes sure that all the containers in each pod are running properly.
You can create multiple virtual Kubernetes clusters, called namespaces, on the same physical cluster. Namespaces allow cluster administrators to create multiple environments (e.g., dev and staging) on the same cluster, or to apportion resources to different teams or projects within a cluster.
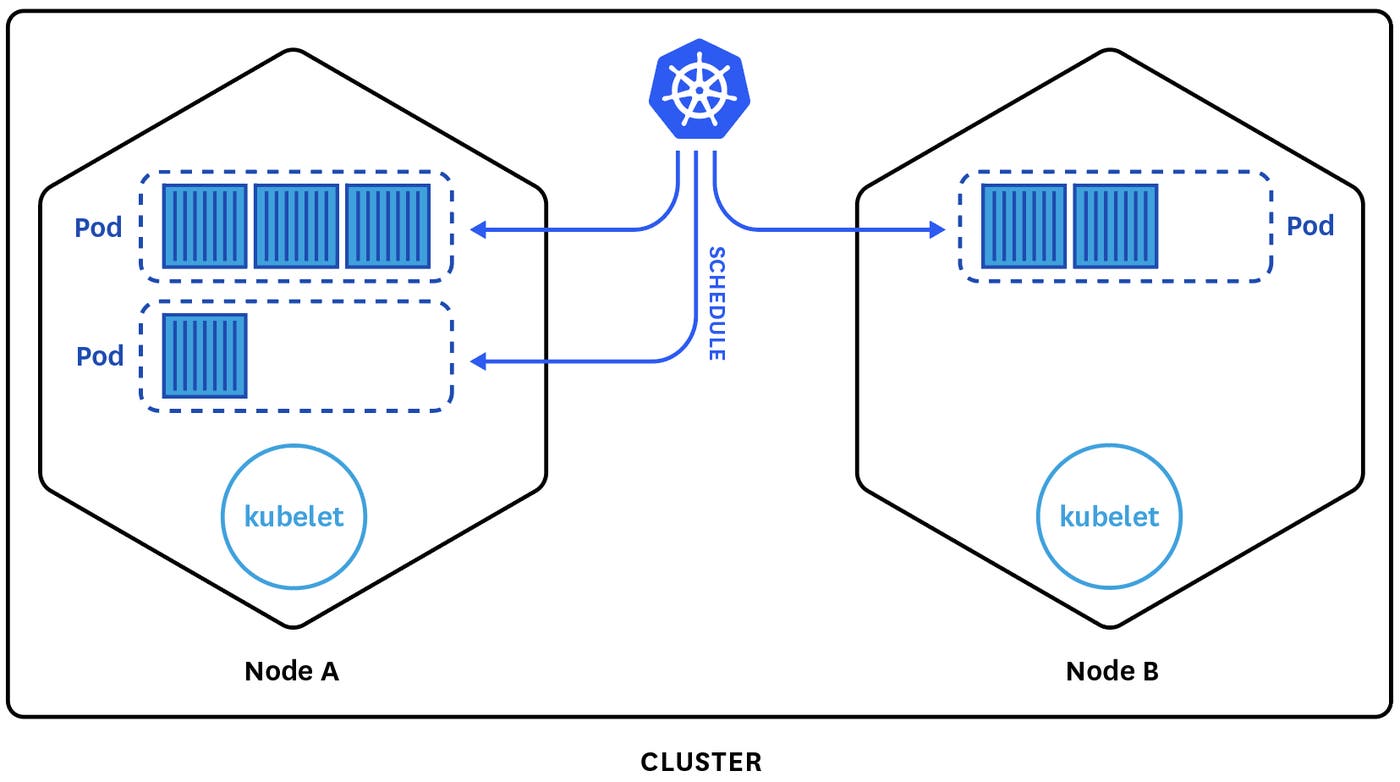
Controllers play a central role in how Kubernetes automatically orchestrates workloads and cluster components. Controller manifests describe a desired state for the cluster, including which pods to launch and how many copies to run. Each controller watches the API server for any changes to cluster resources and makes changes of its own to keep the actual state of the cluster in line with the desired state. A type of controller called a replica set is responsible for creating and destroying pods dynamically to ensure that the desired number of pods (replicas) are running at all times. If any pods fail or are terminated, the replica set will automatically attempt to replace them.
A Deployment is a higher-level controller that manages your replica sets. In a Deployment manifest (a YAML or JSON document defining the specifications for a Deployment), you can declare the type and number of pods you wish to run, and the Deployment will create or update replica sets at a controlled rate to reach the desired state. The Kubernetes documentation recommends that users rely on Deployments rather than managing replica sets directly, because Deployments provide advanced features for updating your workloads, among other operational benefits. Deployments automatically manage rolling updates, ensuring that a minimum number of pods remain available throughout the update process. They also provide tooling for pausing or rolling back changes to replica sets.
Since pods are constantly being created and destroyed, their individual IP addresses are dynamic, and can’t reliably be used for communication. So Kubernetes architectures rely on services, which are simple REST objects that provide a level of abstraction and stability across pods and between the different components of your applications. A service acts as an endpoint for a set of pods by exposing a stable IP address to the external world, which hides the complexity of the cluster’s dynamic pod scheduling on the backend. Thanks to this additional abstraction, services can continuously communicate with each other even as the pods that constitute them come and go. It also makes service discovery and load balancing possible.
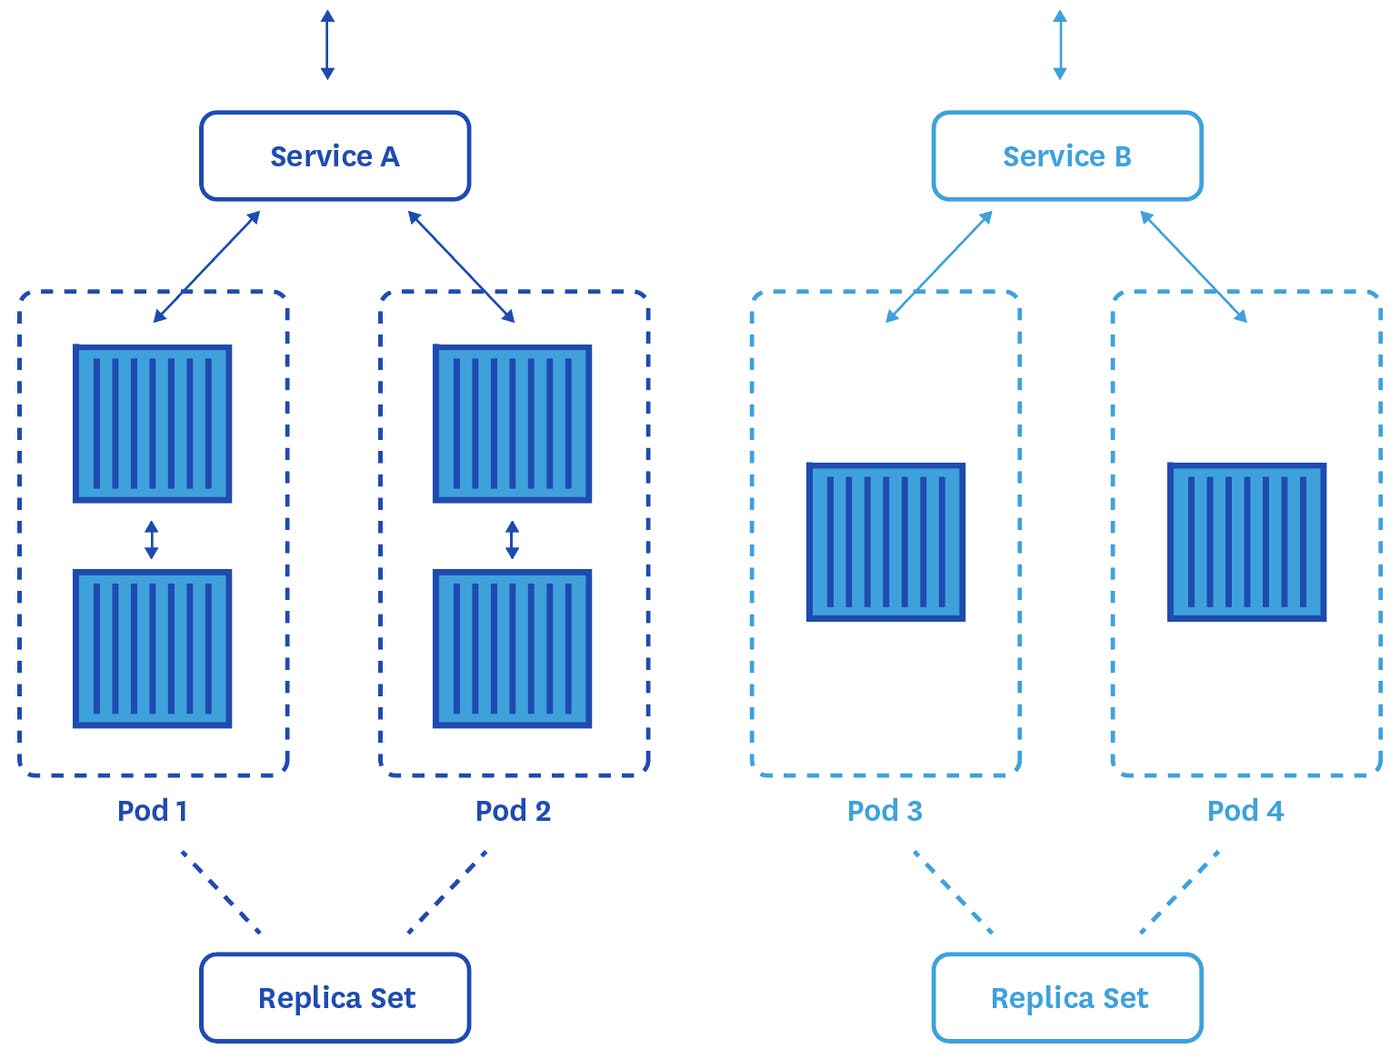
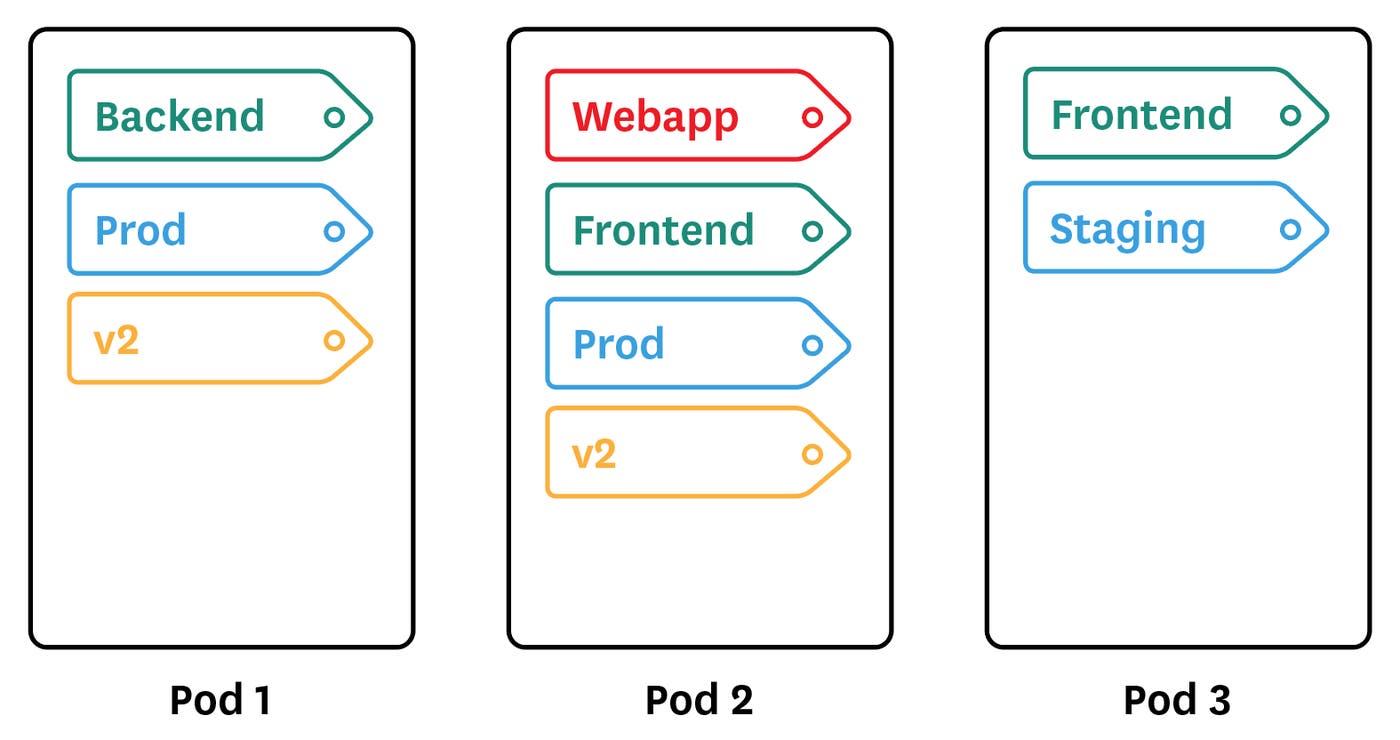
Services target specific pods by leveraging labels, which are key-value pairs applied to objects in Kubernetes. A Kubernetes service uses labels to dynamically identify which pods should handle incoming requests. For example, the manifest below creates a service named web-app that will route requests to any pod carrying the app=nginx label. See the section below for more on the importance of labels.
apiVersion: v1
kind: Service
metadata:
name: web-app
spec:
selector:
app: nginx
ports:
- protocol: TCP
port: 80
If you’re using CoreDNS, which is the default DNS server for Kubernetes, CoreDNS will automatically create DNS records each time a new service is created. Any pods within your cluster will then be able to address the pods running a particular service using the name of the service and its associated namespace. For instance, any pod in the cluster can talk to the web-app service running in the prod namespace by querying the DNS name web-app.prod.
Deployments enable you to adjust the number of running pods on the fly with simple commands like kubectl scale and kubectl edit. But Kubernetes can also scale the number of pods automatically based on user-provided criteria. The Horizontal Pod Autoscaler is a Kubernetes controller that attempts to meet a CPU utilization target by scaling the number of pods in a deployment or replica set based on real-time resource usage. For example, the command below creates a Horizontal Pod Autoscaler that will dynamically adjust the number of running pods in the deployment (nginx-deployment), between a minimum of 5 pods and a maximum of 10, to maintain an average CPU utilization of 65 percent.
kubectl autoscale deployment nginx-deployment --cpu-percent=65 --min=5 --max=10
Kubernetes has progressively rolled out support for auto-scaling with metrics besides CPU utilization, such as memory consumption and, as of Kubernetes 1.10, custom metrics from outside the cluster.
Kubernetes requires you to rethink and reorient your monitoring strategies, especially if you are used to monitoring traditional, long-lived hosts such as VMs or physical machines. Just as containers have completely transformed how we think about running services on virtual machines, Kubernetes has changed the way we interact with containerized applications.
The good news is that the abstraction inherent to a Kubernetes-based architecture already provides a framework for understanding and monitoring your applications in a dynamic container environment. With a proper monitoring approach that dovetails with Kubernetes’s built-in abstractions, you can get a comprehensive view of application health and performance, even if the containers running those applications are constantly shifting across hosts or scaling up and down.
Monitoring Kubernetes differs from traditional monitoring of more static resources in several ways:
Tags and labels are essential for continuous visibility
Additional layers of abstraction means more components to monitor
Applications are highly distributed and constantly moving
Just as Kubernetes uses labels to identify which pods belong to a particular service, you can use these labels to aggregate data from individual pods and containers to get continuous visibility into services and other Kubernetes objects.
In the pre-container world, labels and tags were important for monitoring your infrastructure. They allowed you to group hosts and aggregate their metrics at any level of abstraction. In particular, tags have proved extremely useful for tracking the performance of dynamic cloud infrastructure and investigating issues that arise there.
A container environment brings even larger numbers of objects to track, with even shorter lifespans. The automation and scalability of Kubernetes only exaggerates this difference. With so many moving pieces in a typical Kubernetes cluster, labels provide the only reliable way to identify your pods and the applications within.
To make your observability data as useful as possible, you should label your pods so that you can look at any aspect of your applications and infrastructure, such as:
environment (prod, staging, dev, etc.)
app
team
version
These user-generated labels are essential for monitoring since they are the only way you have to slice and dice your metrics and events across the different layers of your Kubernetes architecture.
By default, Kubernetes also exposes basic information about pods (name, namespace), containers (container ID, image), and nodes (instance ID, hostname). Some monitoring tools can ingest these attributes and turn them into tags so you can use them just like other custom Kubernetes labels.
Kubernetes also exposes some labels from Docker. But note that you cannot apply custom Docker labels to your images or containers when using Kubernetes. You can only apply Kubernetes labels to your pods.
Thanks to these Kubernetes labels at the pod level and Docker labels at the container level, you can easily slice and dice along any dimension to get a logical view of your infrastructure and applications. You can examine every layer in your stack (namespace, replica set, pod, or container) to aggregate your metrics and drill down for investigation.
Being the only way to generate an accessible, up-to-date view of your pods and applications, labels and tags should form the basis of your monitoring and alerting strategies. The performance metrics you track won’t be attached to hosts, but aggregated around labels that you will use to group or filter the pods you are interested in. Make sure that you define a logical and easy-to-understand schema for your namespaces and labels, so that the meaning of a particular label is easy to understand for anyone in your organization.
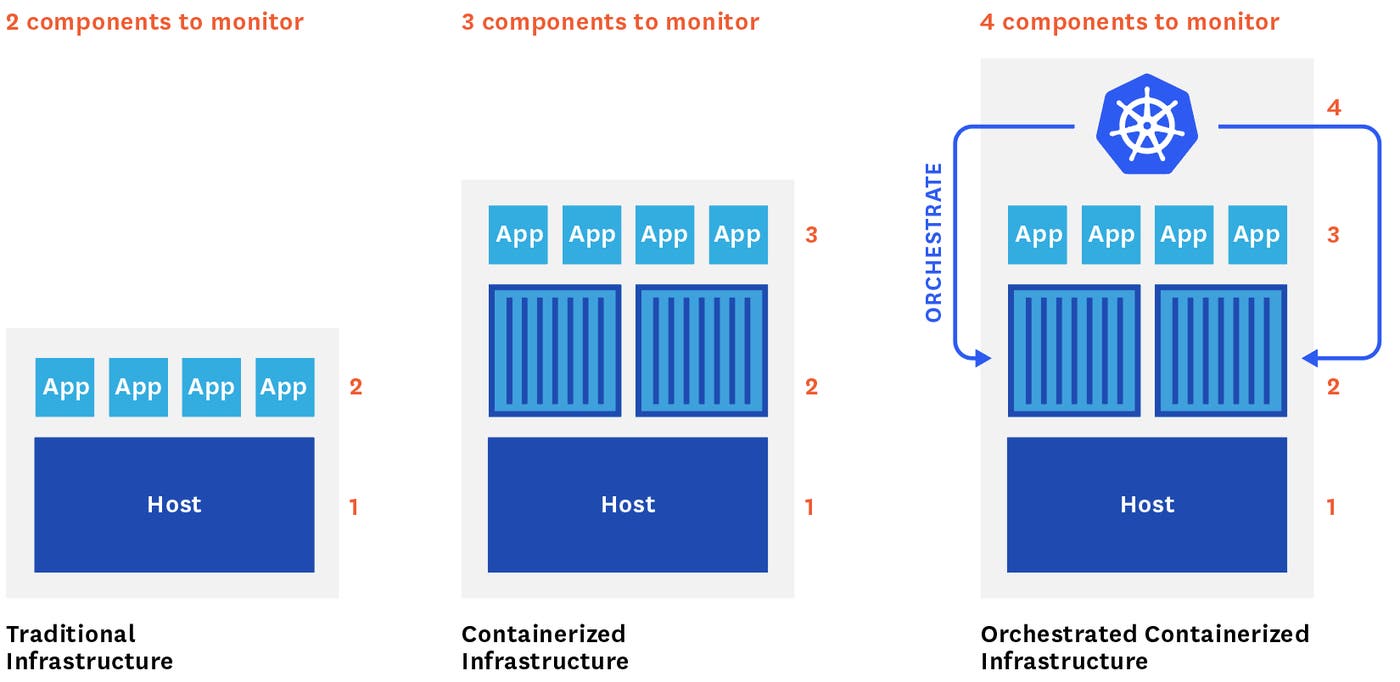
In traditional, host-centric infrastructure, you have only two main layers to monitor: your applications and the hosts running them.
Then containers added a new layer of abstraction between the host and your applications.
Now Kubernetes, which orchestrates your containers, also needs to be monitored in order to comprehensively track your infrastructure. That makes four different components that now need to be monitored, each with their specificities and challenges:
Your hosts, even if you don’t know which containers and applications they are actually running
Your containers, even if you don’t know where they’re running
Your containerized applications
The Kubernetes cluster itself
Furthermore, the architecture of a Kubernetes cluster introduces a new wrinkle when it comes to monitoring the applications running on your containers . . .
It’s essential to collect metrics and events from all your containers and pods to monitor the health of your Kubernetes infrastructure. But to understand what your customers or users are experiencing, you also need to monitor the applications actually running in these pods. With Kubernetes, which automatically schedules your workloads, you usually have very little control over where they are running. (Kubernetes does allow you to assign node affinity or anti-affinity to particular pods, but most users will want to delegate such control to Kubernetes to benefit from its automatic scheduling and resource management.)
With Kubernetes, your monitoring has to follow your moving applications </div>
Given the rate of change in a typical Kubernetes cluster, manually configuring checks to collect monitoring data from these applications every time a container is started or restarted is simply not possible. So what else can you do?
A Kubernetes-aware monitoring tool with service discovery lets you make full use of the scaling and automation built into Kubernetes, without sacrificing visibility. Service discovery enables your monitoring system to detect any change in your inventory of running pods and automatically re-configure your data collection so you can continuously monitor your containerized workloads even as they expand, contract, or shift across hosts.
With orchestration tools like Kubernetes, service discovery mechanisms become a must-have for monitoring.
Kubernetes requires you to rethink your approach when it comes to monitoring. But if you know what to observe, where to find the relevant data, and how to aggregate and interpret that data, you can ensure that your applications are performant and that Kubernetes is doing its job effectively.
Part 2 of this series breaks down the data you should collect and monitor in a Kubernetes environment. Read on!
此内容由惯性聚合(RSS阅读器)自动聚合整理,仅供阅读参考。 原文来自 — 版权归原作者所有。