









Nicholas Thomson

Jonathan Morin

Ryan Warrier

Jane Wang
Across industries, businesses are increasingly focused on using data to create value and serve customers—training LLMs, creating targeted ads, delivering personalized recommendations, implementing machine learning–based analytics, building dashboards to improve decision-making, and more. These applications expect data to be available on demand and high quality—both of which depend on reliable data pipelines that enable data to flow seamlessly to and from production applications—but that is often not the case. The complexity of systems that process and deliver data makes it difficult to gain complete visibility and ensure both pipeline efficiency and data quality.
Datadog’s suite of solutions to monitor data, including Data Streams Monitoring (DSM) and Data Jobs Monitoring (DJM), enables teams to monitor the data lifecycle from end to end, providing insights that help data teams understand how their data pipelines are performing, as well as the data itself. In this post, we’ll cover:
Data pipelines can be big, intricate systems, managed by multiple teams—it can be difficult to find a team member who understands the whole pipeline. When you learn there is an issue with the data—for example, because an end customer complained about faulty data, your CEO is angry because their dashboard isn’t working, or the ML team found issues in the data—pinpointing where in the pipeline a failure happened, how to remediate the issue, and who is responsible for fixing it requires visibility across data stores, jobs, and streams.
Root-cause analysis can be complicated because these pipelines manipulate data using many different tools, including batch processing, data streams, data transformation, data storage, and more. These tools are often managed by different teams, adding a further layer of complexity to the task of troubleshooting.
To avoid business disruptions, modern data teams need to quickly identify when data is missing, late, or bad (a tall ask). But if you’re only monitoring the data itself—i.e., checks on the data itself as a proxy for data quality, such as timeliness and completeness—you may detect when there is an issue but you won’t be able to pinpoint where the issue comes from, nor how to remediate it. On the other hand, pipeline monitoring does not cover checks on the data itself, like freshness or other quality attributes, so in many cases, it’s up to users to detect issues.
To detect issues with data in a timely and complete fashion and to troubleshoot these issues effectively, teams should consider observing their complete data pipelines so they can monitor not only the data but also the systems producing it. This includes:
Next, we’ll take a closer look at how Datadog can help teams monitor their data lifecycle holistically, covering data processing jobs, data pipelines, and the data itself.
Data jobs, such as those using Apache Spark, process data from your pipelines so that it can be used by internal business intelligence tools, data science teams, and products serving end customers. Access to high-quality data depends on the consistent success of these jobs, so it’s important to make sure they’re operating as expected.
Datadog Data Jobs Monitoring provides alerting, troubleshooting, and optimization capabilities for Apache Spark and Databricks jobs. You can use these insights to optimize your data job provisioning, configuration, and deployment by analyzing Spark CPU utilization, system CPU, and memory utilization across job runs. To root out issues early, you can set up alerts on failing or slow jobs. Data Jobs Monitoring is now generally available, supporting Databricks on AWS and Google Cloud, Azure Databricks, Amazon EMR, and Spark on Kubernetes.
Let’s say you receive a Slack notification that there is a failed data processing job. You click on the link to pivot from Slack to DJM, which brings you to a page showing the health and performance of the alerting job over time along with the most recent runs. You can click into the failed run and immediately see the error in the simple UI that will be familiar to APM users.
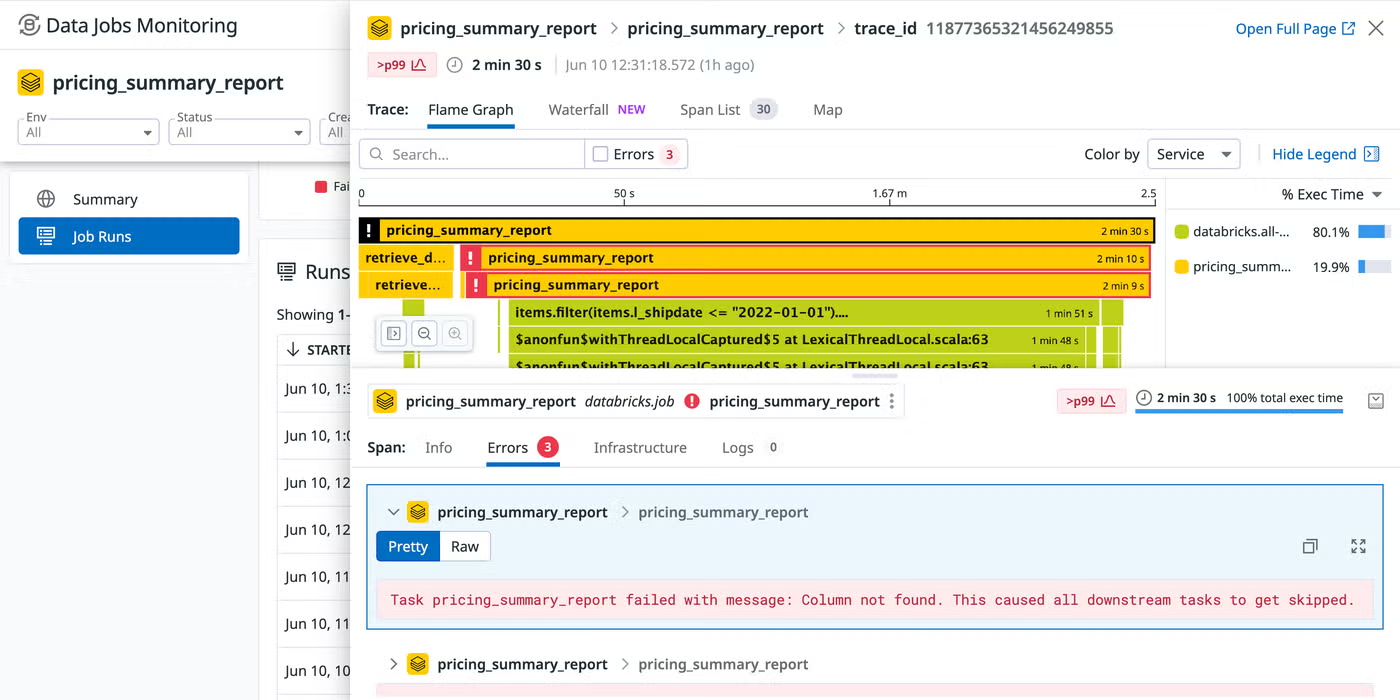
DJM shows you that the last run of this data processing job failed. You click through to see a detailed trace of the job execution, along with the error message that tells you that the column was not found. This clue gives you some insight into the issue, but you need to keep investigating upstream to find out why the column wasn’t found.
Data jobs are an essential part of the data lifecycle, as they impact pipelines and data quality, so you need to monitor them to gain full end-to-end visibility into your data’s health at every stage of the process. DJM provides visibility into job executions (including stage-level breakdowns) so you can see why certain batches failed, determine where bottlenecks are occurring, catch job failures, identify data skew, optimize jobs generating waste, and more.
Streaming data is often the point of ingestion for your systems, so these systems need to be healthy and high-performing in order to avoid bottlenecks, staleness, or other downstream issues. Monitoring upstream can help you catch issues early, before they translate into degraded data quality, faulty or missing insights, and negative impacts on end-user experience.
Datadog Data Streams Monitoring (DSM) automatically maps and monitors the services and queues across your streaming data pipelines and event-driven applications, end to end. This deep visibility provides you with a clear, holistic view of the flow of data across your system, enabling you to monitor latency between any two services; pinpoint faulty producers, consumers, or queues driving latency and lag; discover hard-to-debug pipeline issues such as blocked messages or offline consumers; root-cause and remediate bottlenecks so that you can avoid critical downtime; and quickly see who owns a pipeline component for immediate resolution.
We’ve expanded DSM in two big ways:
DSM now shows more of your data pipelines so you can see how data is flowing not only within services and queues, but through Spark jobs, S3 buckets, and Snowflake tables (now in Product Preview). This unified end-to-end view of component ingestion, processing, and storing data helps you pinpoint issues with cascading downstream impact and identify root causes.
You can identify if downstream issues or errors are a result of upstream schema changes or new schemas, so you can catch them before they form into bottlenecks affecting data flow (now in Preview for Java services).
You can see key alerts on the nodes in the map, now including the number of failed Spark batch job runs on top of Kafka lag on service nodes, and stale data in S3 buckets and Snowflake tables. Additionally, hovering over the nodes will show you essential health metrics. For example, S3 nodes will show you freshness (time of last write or read to or from a table) and volume (size of last write or read to or from a table).
Thanks to the integration with DJM, the expanded pipeline view in DSM now surfaces failing Spark jobs so you can see where the failed job is without leaving the DSM map. You can correlate the failure to issues upstream, like Kafka lag or schema changes. Spark batch jobs will show you metrics, such as number of failed job runs, last run, last duration, and errors. Spark streaming jobs will show you the number of failed job runs, last run duration, processed records per second and average run duration. You can also now see storage components, such as the S3 buckets and Snowflake tables, alongside Spark jobs and services pushing data in the same pipeline.
Continuing our example from above, let’s say you’ve pivoted from DJM to DSM, and upstream from the failing Spark job you see a warning that there’s a new schema detected with a high error rate. You click into the alert and see that the new schema is missing a column present in the previous schema, resulting in errors with processing the messages. You realize that somebody shipped a new schema that impacted the downstream data, which impacted the job, subsequently affecting your data. To solve the problem, you can roll back the schema change that negatively impacted the data job. In summary, with the unified DSM map for monitoring streaming data, processing jobs, and storage components, you can immediately identify related issues upstream and impacts downstream.
At the end of the day, monitoring and alerting on symptoms across data pipelines and jobs is done to ensure that the data moving in these pipelines can be trusted and that insights extracted from it are accurate. This is where alerting on data existence, freshness, and correctness becomes useful.
Datadog can also help teams monitor their data itself, with the introduction of new capabilities. To complement DSM and DJM, a new Product Preview enables you to
These capabilities enable you to catch issues in the data, whether you’re training LLMs or optimizing an e-commerce site based on trends in customer data. Customers who are interested can sign up for the Preview.
For example, say you received an alert about a stale marketing_sales_report table in Snowflake. You’re glad to get this alert because you want to be the first to know if there is an issue—rather than having your manager ask why a dashboard is broken, or the data science team telling you their ML model is producing faulty results.
You can pivot to Datadog to see how this impacted the data itself. Here, Datadog shows statistics about the marketing_sales_report table.
You can see that the table didn’t get updated at its usual frequency, which makes sense, given the upstream issues. With this knowledge in hand, you roll back the deployment that caused the schema change that was preventing the table from updating, allowing fresh data to populate the table.
Monitoring data volume and freshness metrics works in tandem with Data Streams Monitoring and Data Jobs Monitoring to provide you end-to-end visibility, so you can quickly root-cause issues and troubleshoot effectively.
As data teams and data ops practices mature, it’s essential to take an integrated approach to monitoring, taking into account the data lifecycle in order to solve problems effectively and save hours of cross-team troubleshooting to determine the root causes. In this post, we’ve laid out the foundation of such an approach, what users can do with Datadog today to implement such an approach, and where Datadog is going from there. Datadog’s DSM and DJM, alongside newer efforts available in Product Preview, offer integrated visibility into data and data pipelines. This visibility enables you to troubleshoot issues that previously would have taken time to resolve and tie up engineers, who could be putting their efforts to use elsewhere.
Check out our DSM and DJM docs to get started, and if you’re a Datadog user interested in partnering with us, sign up for our Product Preview. If you’re new to Datadog, you can sign up for a 14-day free trial.
此内容由惯性聚合(RSS阅读器)自动聚合整理,仅供阅读参考。 原文来自 — 版权归原作者所有。