





Whether you’re rushing to troubleshoot an incident or proactively performing a security audit, the trial-and-error process of searching through millions of logs for key information can be time-consuming and cumbersome. To help you quickly surface important details from large swaths of log data, Datadog’s Log Explorer allows you to search and filter your logs, create visualizations, as well as group your logs by fields, patterns, or transactions. Grouping your logs by Patterns consolidates your logs into clusters that share commonalities in their messages, making it easier for you to find meaningful patterns that are useful to your investigation. By default, the Log Explorer shows individual variations within patterns as hidden behind “X” and “*” characters.
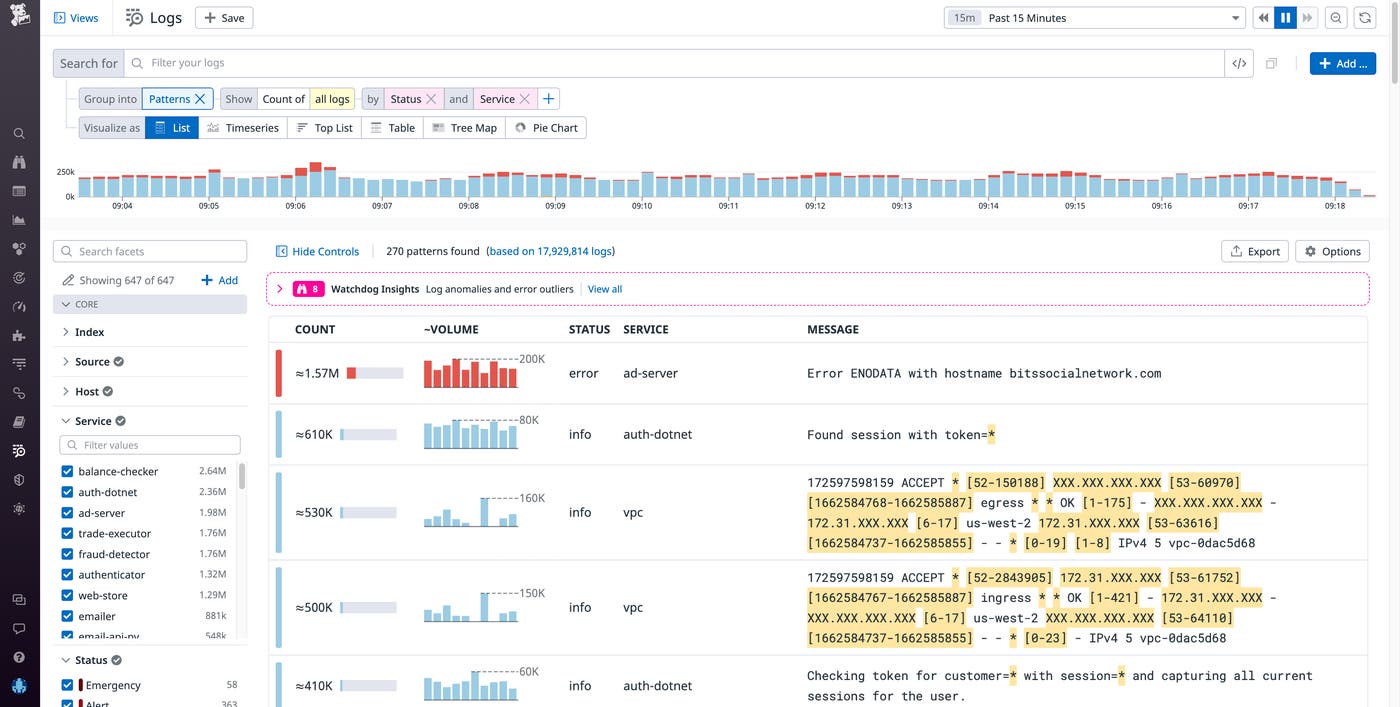
However, there are times when you want to see the individual values hidden behind these “X” and “*” characters. Seeing the actual values—along with data visualizations and other information describing those values—can help you determine, at a glance, the answers to questions like: How many hosts are involved? What regions or data centers are most impacted? Is the incident equally affecting all customers, or is it concentrated around a few specific organizations?
Pattern Inspector is a new Log Explorer feature that imparts transparency to the highlighted values within log patterns. When troubleshooting an issue or performing a security investigation, you can hover over highlighted snippets of a pattern to display the distribution of actual values. Upon seeing this spread of values, you can quickly determine whether the pattern contains useful information that can guide your next steps.
In this post, we’ll show you how to:
Get started with Pattern Inspector
Accelerate troubleshooting investigations
Get faster and better results from your security audits
When you navigate to the Log Explorer and enter a query, you will likely see millions of individual logs that match your query’s parameters. Grouping these logs by pattern will shrink the results displayed into a much more manageable number. When you choose this option, the highlighted sections of the message column show you which portions vary across the individual logs in that consolidated group. For instance, 172.31.XXX.XXX represents a range of IP addresses. Thanks to the Pattern Inspector feature, hovering your mouse over one of the highlighted sections now displays the distribution of the underlying values. As in the example below, the modal also reveals data about the overall sample size the distribution was drawn from.
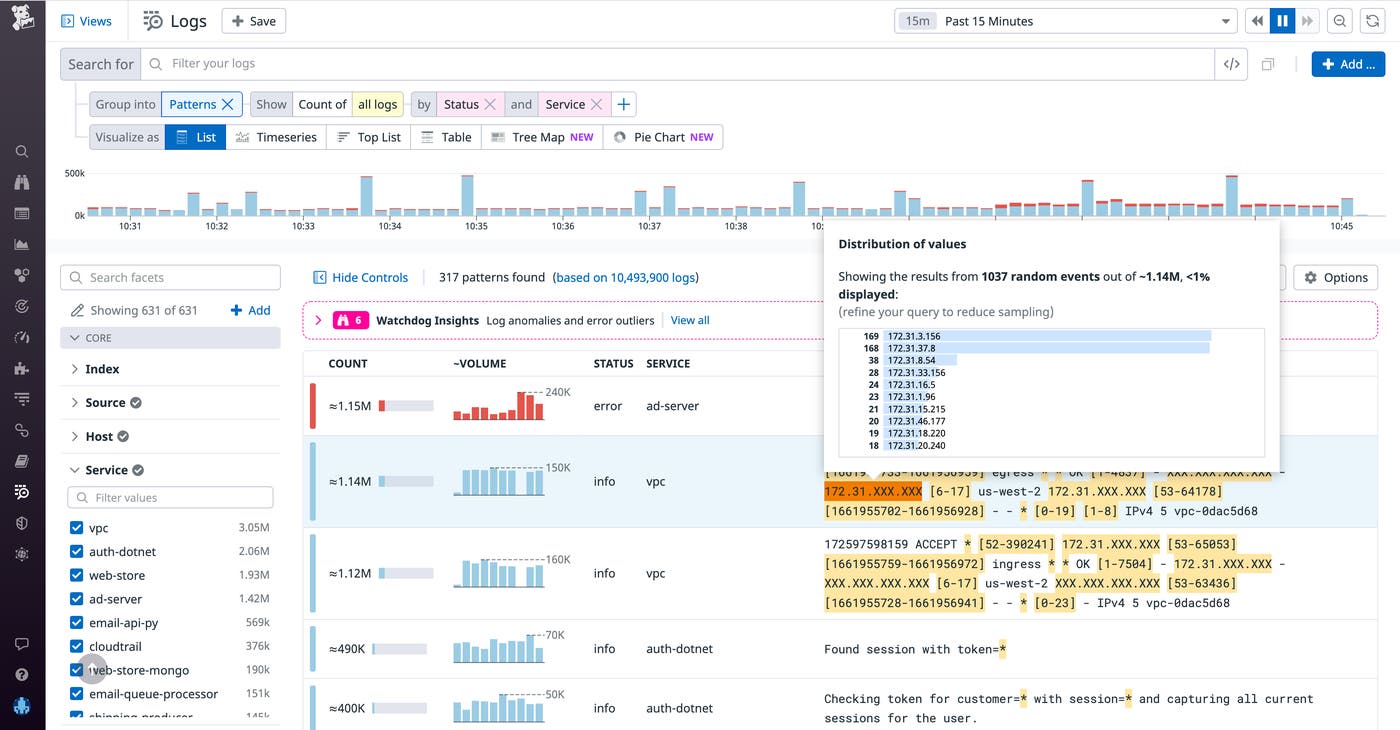
If you click on a highlighted range, Pattern Inspector opens up a sidebar that enables more advanced functionality. For example, the sidebar allows you to download the distribution of values from the log messages as a shareable CSV, facilitating cross-team collaboration. The sidebar also allows you to cycle through all the highlighted aggregations within that log pattern by using the Previous and Next buttons.
This ability to quickly cycle through distributions can be useful, for example, if you receive an alert that an elevated number of users are unable to log in to your site. Let’s suppose that, in response to this alert, you navigate to the Log Explorer, group by pattern, and find a group of error logs coming from the backend database service that stores and manages your user data. At the click of a button, you can use Pattern Inspector to quickly uncover the value distributions for both the API methods and response codes mentioned in this error pattern, as shown in the images below.
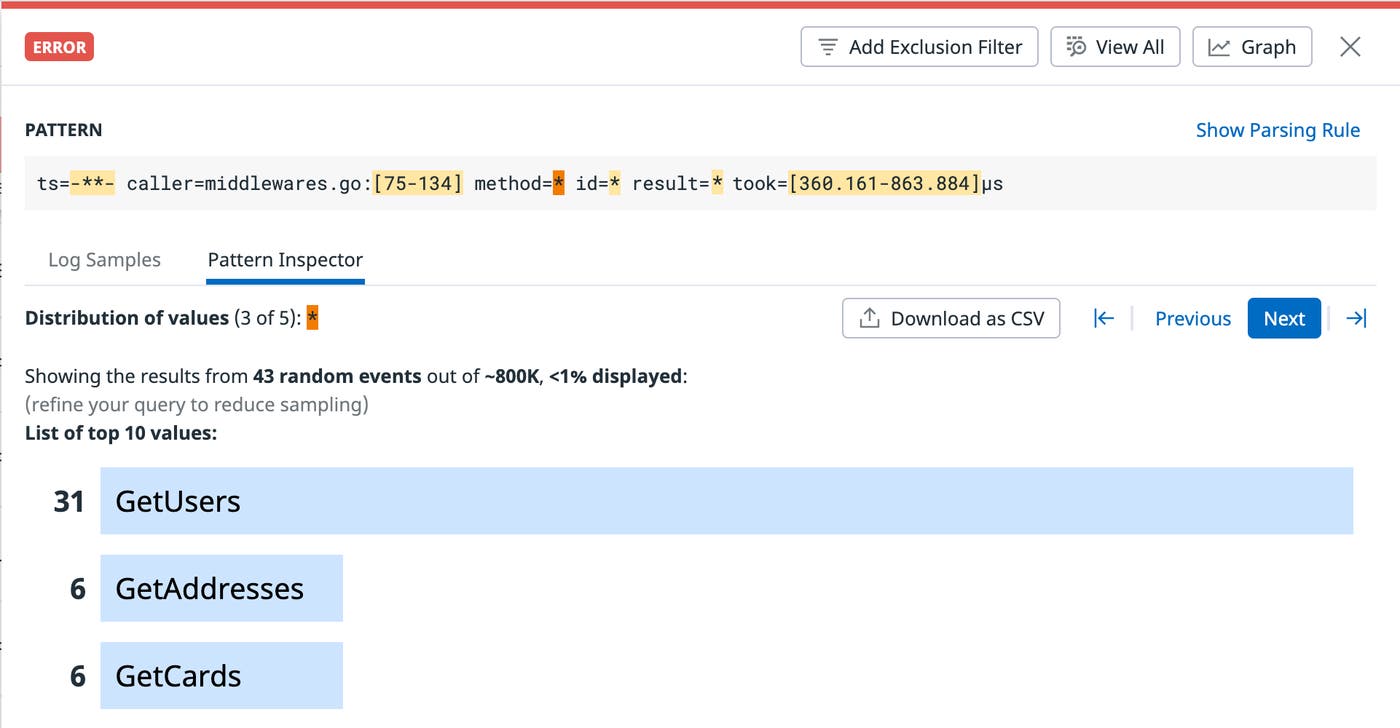
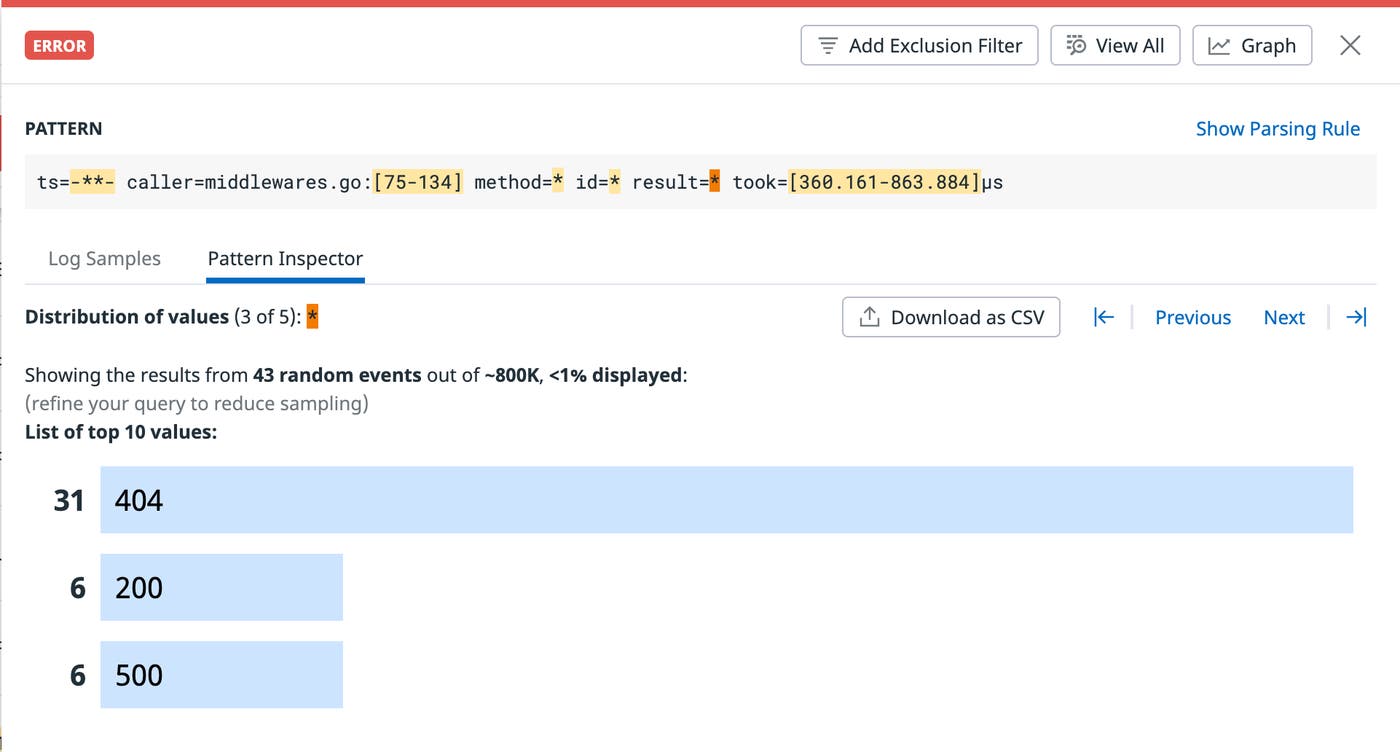
In this example, you see immediately that a large number of 404 errors are being returned, and the most common method involved in the error is named GetUsers. You investigate GetUsers at the code level and discover that a dependency for this request was recently deprecated. With this knowledge, you’re able to re-configure the request path and remediate your end-user experience.
Say you are an SRE for an e-commerce site, and you receive an alert letting you know that customers are unable to check out and pay for the items in their cart. You want to find out which data centers are most impacted by the issue, so you head to the Log Explorer. To find the relevant logs, you group by pattern. By default, this step groups your logs by status and service—ordered by the volume of logs that share each detected message pattern. Let us suppose that, in this scenario, the Log Explorer displays many different groups of error logs that are consolidated according to common patterns.
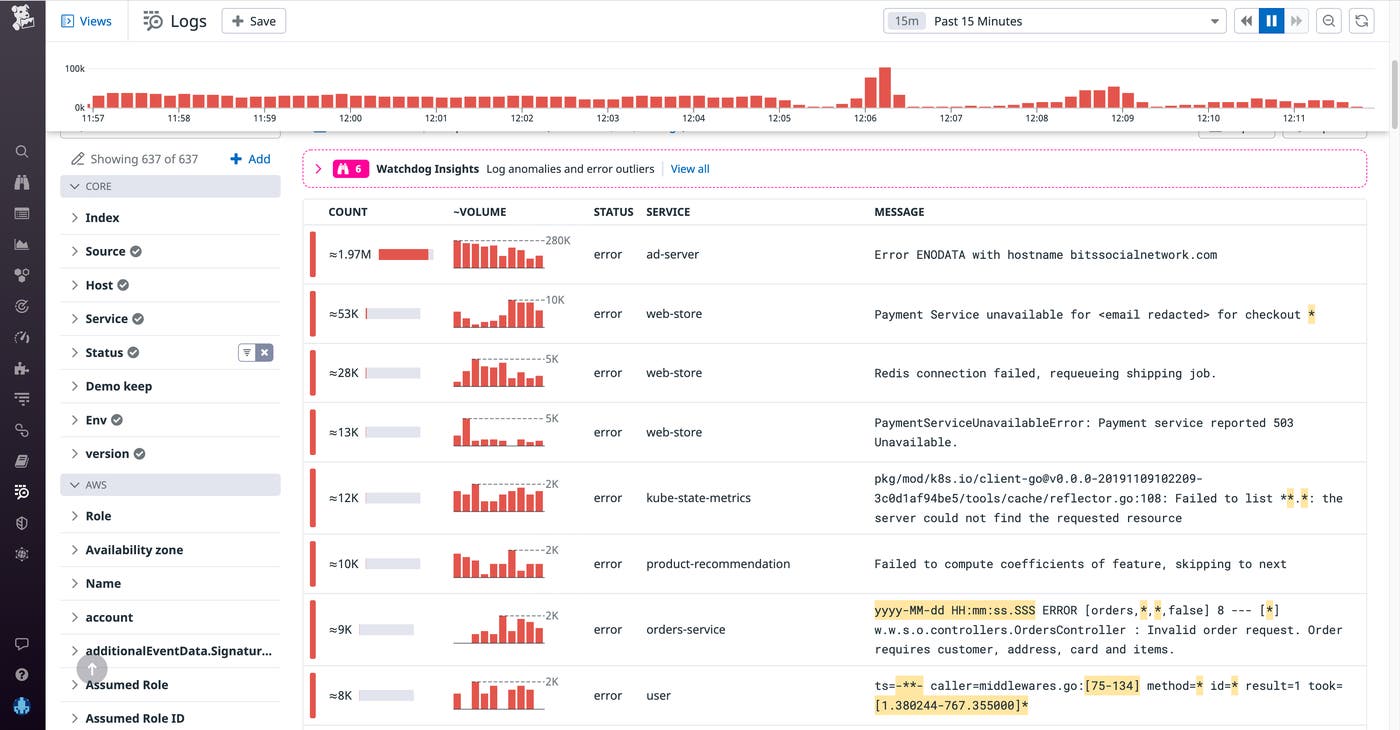
You don’t want to spend time inefficiently parsing through the different log pattern groupings, trying to find the one(s) relevant to your investigation. (Remember, at this point all you see about the highlighted values are “*” and “X” characters.) Pattern Inspector helps you skip this challenging and time-consuming task. Instead, you can merely click on the “*” character at the end of the error message, shown in the screenshot above, that reads Payment Service unavailable for <email redacted> for checkout. With this step, a sidebar opens that reveals that all the error logs are coming from two data centers: us.1.prod.dog and us.1.test.dog.
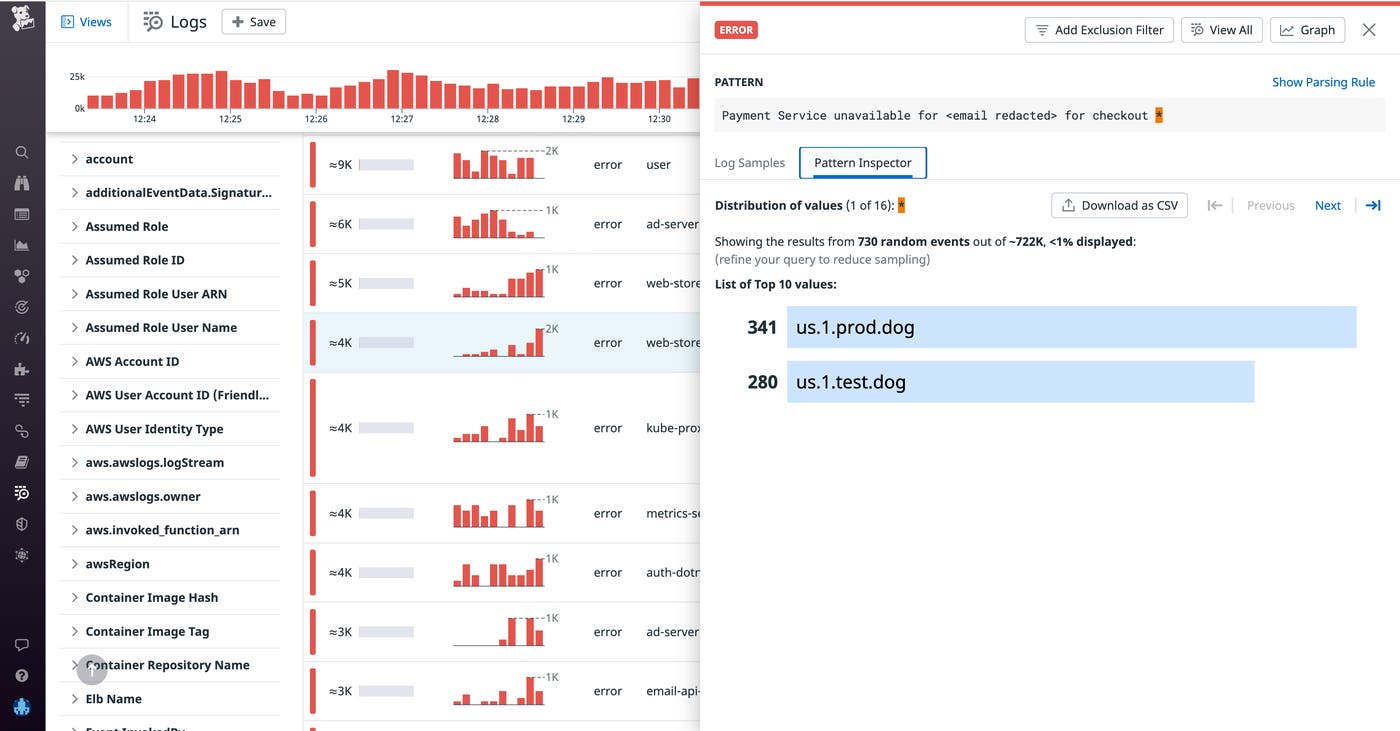
This new information enables you to quickly turn toward investigating the production and test data centers from us.1. This investigation, in turn, might lead you to discover that the issue stems from an outstanding dependency update for the region in which these data centers are located. Armed with this knowledge about the root cause, you can now fix the problem. In this example, Pattern Inspector was able to significantly shorten issue resolution time by revealing where the problem was occurring.
Say you are performing a security audit on your e-commerce site. In this scenario (and unlike the troubleshooting scenario above), you typically don’t know what you’re looking for ahead of time. In fact, in the best case—if everything is in order—you will not even find anything of interest at all.
Pattern Inspector is especially helpful in this type of situation. Before Pattern Inspector, you would have had to painstakingly parse through logs until you found something that looked amiss. For this exploratory type of investigation, you would have had to begin by choosing a log pattern grouping to investigate. Next, you would choose a highlighted value range containing “X” or “*” characters from the pattern’s message field. Finally, you would use the Log Explorer to query the logs for messages containing values that fell in that same range, to look for anything interesting or suspicious.
Pattern Inspector speeds up this time-consuming and repetitive process. Continuing our security audit example, let’s say that you have found a log grouping to investigate that includes the common text: status:alert. This pattern of log messages also includes a response to calls to your ad server API, which securely connects to sensitive user data. To investigate further, you hover over a highlighted IP address range to get the distribution of addresses that the API calls are coming from. You find that a large volume of calls are coming from just two IP addresses.
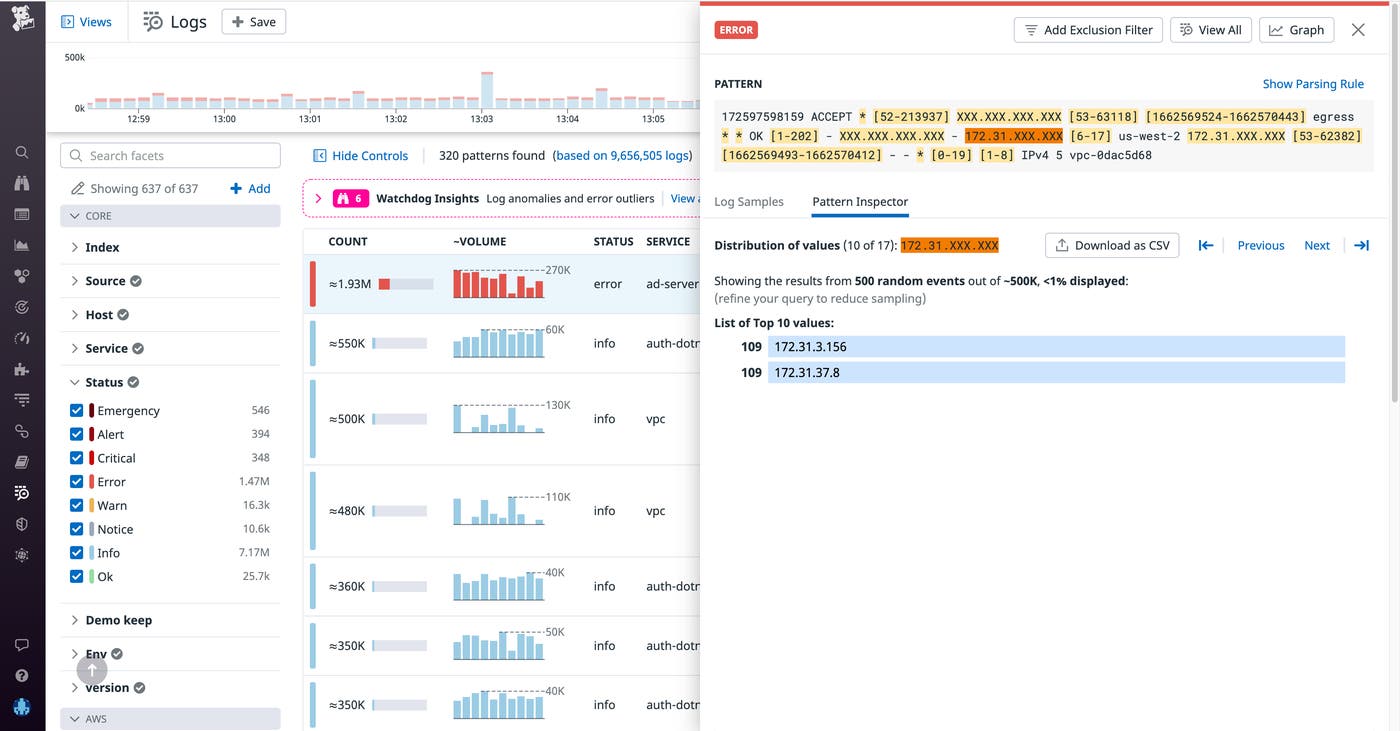
This high volume of API calls from two IP addresses suggests a brute force attack. Having quickly made this determination, you can block the IP addresses to prevent any further risk exposure. You can also declare an incident to investigate these suspicious IP addresses further. In this example, Pattern Inspector was able to facilitate and expedite security auditing by enabling you to both discover and home in on security issues in one tab.
Through a simple mouse-over, Pattern Inspector reveals the distribution of values behind each highlighted range within a log pattern, accelerating your troubleshooting investigations and security explorations. Pattern Inspector complement’s Datadog’s Log Anomaly Detection, which surfaces problematic patterns in users’ logs by allowing users to quickly evaluate the breadth and severity of these anomalies. This new functionality will help you discover and isolate issues faster, reducing mean time to resolution and accelerating improvements to your end-users’ experience.
If you’re new to Datadog, sign up for a 14-day free trial, and leverage Pattern Inspector to expedite your investigations.
此内容由惯性聚合(RSS阅读器)自动聚合整理,仅供阅读参考。 原文来自 — 版权归原作者所有。