






We shipped a feature that made perfect sense. It improved a specific type of investigation we had been testing against. Then other investigations started getting worse.
Nothing crashed. No tests failed. But the overall quality of the agent had shifted, and we had no reliable way to detect it.
Bits AI SRE is Datadog’s autonomous agent for investigating production incidents. It reasons across metrics, logs, traces, infrastructure metadata, network telemetry, monitor configuration, and more to determine, triage, and remediate the root cause of an issue.
As we built Bits, we expected behavior to improve incrementally with each feature we added. Instead, we saw something more subtle. Improvements in one area could quietly introduce regressions in another. The problem wasn’t just the model. We had no way to replay real production context, measure behavior consistently across diverse incidents, or track whether the agent was actually improving over time.
We needed infrastructure that could turn production issues into reproducible investigation environments. So we built a replayable evaluation platform from scratch.
In this post, we’ll walk through how the Bits AI SRE team built that platform and what it took to make agent behavior observable, measurable, and repeatable.
Early in development, before exposing the system to customers, we added a feature that extracted the service name from the monitor under investigation into Bits AI SRE’s initial context. On the surface, this made sense, and in a handful of internal test cases, it worked as expected.
What we could not see was the broader impact. Without a representative evaluation set, we had no way to measure how that change behaved across different environments. The feature pulled in a large amount of irrelevant signals, which degraded investigation quality in unrelated scenarios, often by subtly confusing the reasoning of the agent. This change introduced regressions that didn’t become apparent until we began seeing widespread investigation misses internally.
This wasn’t an isolated case. Features that improved Bits in one area could quietly degrade performance in another, and the relationships often weren’t obvious. We had no standardized way to catch these regressions, no way to track quality across changes, and no confidence that the next feature wouldn’t cause the same problem. We needed a way to catch these regressions before users reported them.
Beyond standard test suites, we first tried testing individual tools in isolation. This approach seemed reasonable. If each tool behaved correctly, the agent should behave correctly.
In practice, that assumption broke down. Bits’ value comes from how it chains tools together and reasons across their outputs. Failures often emerged from interactions between steps, not from a single tool call. For example, the agent might retrieve valid signals from multiple tools but combine them incorrectly, leading it to attribute an issue to the wrong component.
We also experimented with rerunning live Bits investigations as a form of online evaluation. That did not scale. Results were not aggregated, environments changed underneath us, and investigations could not be replayed once the underlying signals expired.
We needed an offline system that could replay realistic scenarios across Datadog’s signals and measure the agent’s behavior in a controlled, repeatable way. Off-the-shelf eval frameworks assume clean inputs and static test sets, which breaks down when your agent reasons across live production telemetry.
We ended up building two components that work in tandem: a curated label set that defines representative investigations and an orchestration platform that executes and scores the agent against them.
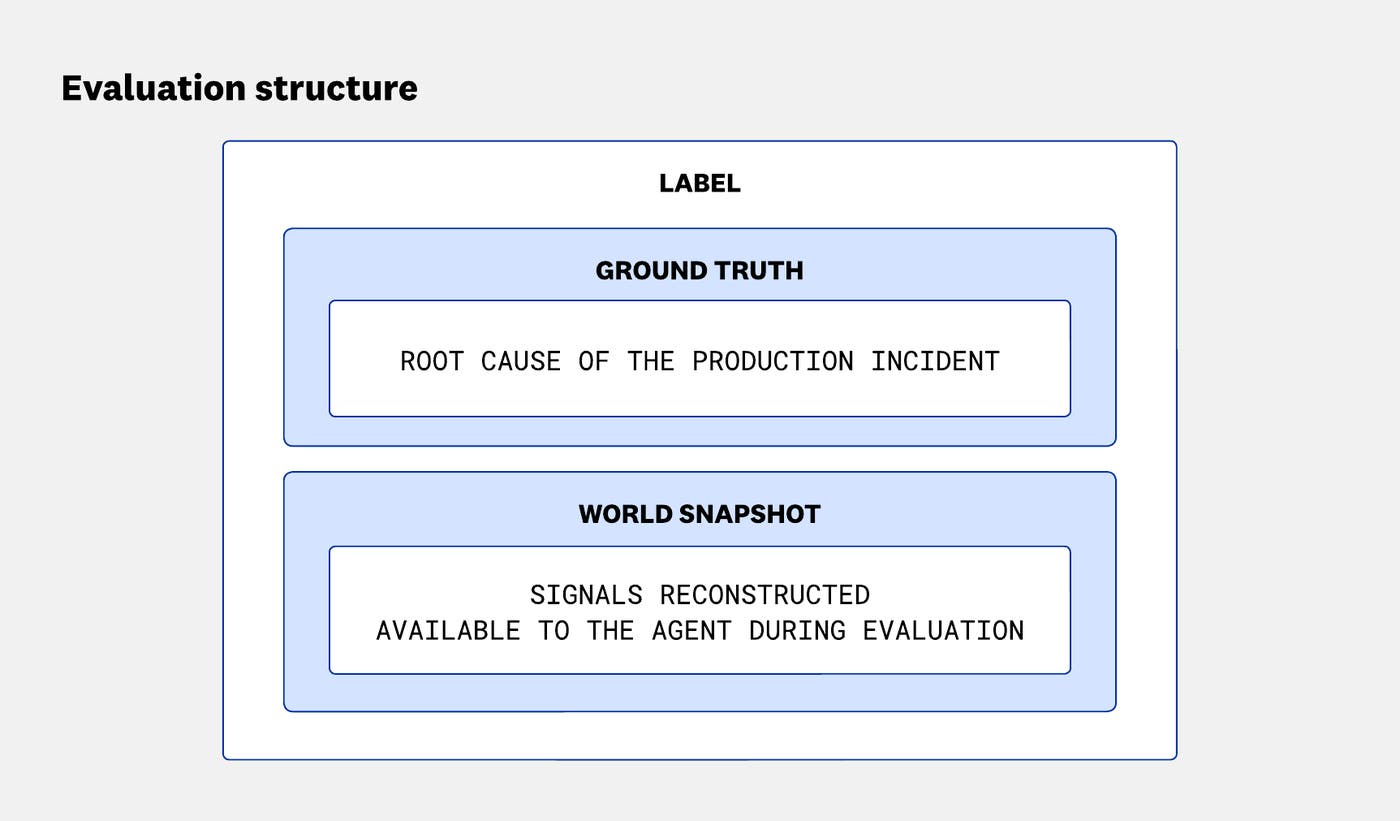
Each evaluation label represents a single investigation scenario Bits would encounter in production. The label has two parts. The first is the ground truth, which defines the root cause of the issue. The second is the world-snapshot, which captures the signals that were available at the time the issue occurred. For example, a label might define the root cause as a Kubernetes pod being OOM killed, with a world snapshot that preserves the telemetry queries the agent would need—such as where to find memory metrics, container logs, and deployment events—rather than raw data.
The agent never sees the root cause directly. It only has access to the signals that existed when the issue occurred. Our evaluation needs to reflect that constraint. Each label has to preserve the same signals the agent would have seen in production.
At the same time, the set of labels must be broad enough to reflect reality. From Kubernetes pod failures to Kafka lag, and from simple bad-code deployments to complex multi-service business logic side effects, the real world of SRE spans many technologies, failure modes, and levels of complexity. Our label set has to reflect that diversity. A narrow or overly clean dataset would inflate performance and hide weaknesses.
The evaluation platform is the system that runs Bits against our label set, scores the results, and tracks performance over time.
We needed to know whether an improvement for Kafka lag investigations had accidentally broken our Kubernetes investigations. Answering that meant running both at once, across different model and configuration variants, and comparing results across runs.
From there, the requirements became clear. We needed to segment the label set by relevant dimensions, run investigations at scale, track results over time, and make it easy to compare performance across versions.
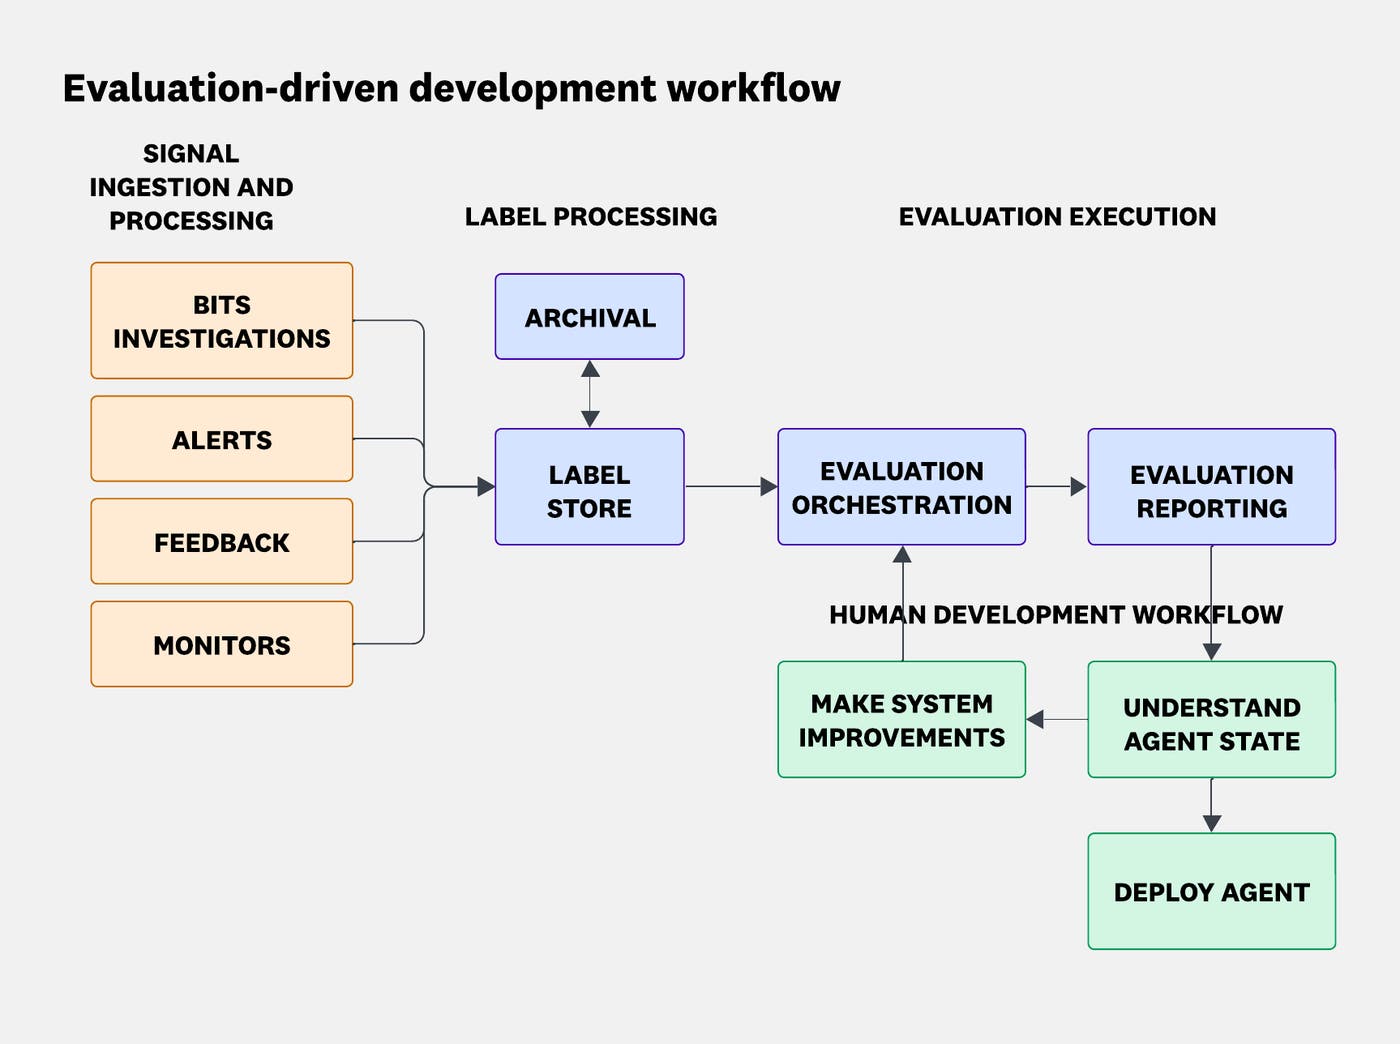
At a high level, the system consists of a shared label set, an orchestration layer that runs investigations against those labels, and reporting infrastructure that tracks performance over time.
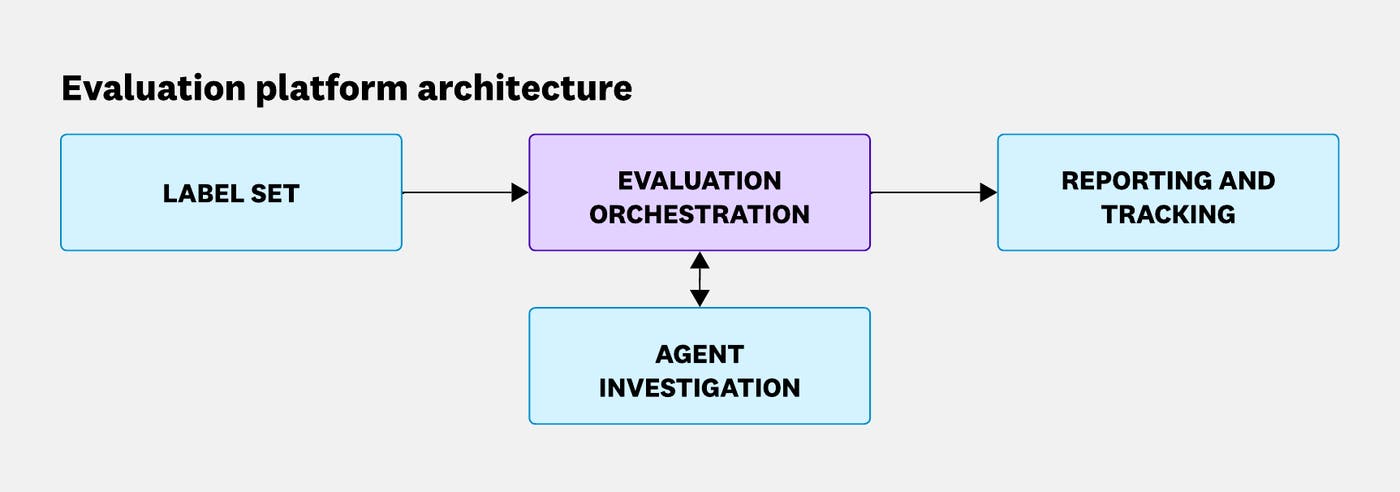
With this architecture in mind, we’ll walk through how each piece came together, starting with the labels.
Given the range of scenarios Bits handles, a small set of hand-crafted labels wasn’t enough. We needed broad, representative coverage from the start. So we began with a manual internal labeling campaign, generating labels from Datadog’s own alerts across a wide range of scenarios.
This got us started, but we were burning engineering hours faster than creating labels, and our label set was still nowhere near representative of the real world.
To scale label creation, we turned to the one system that already understood every investigation: Bits itself. When customers provide feedback on a Bits AI investigation, we use that signal, along with the information from the investigation itself, to construct a ground truth root cause analysis and the queries that make up the world snapshot. Every user interaction becomes a potential evaluation label.
This turned label collection from a manual effort into a pipeline that grows with product usage. As adoption increases, so do the volume and diversity of our labels. Embedding label creation in the product increased our label creation rate by an order of magnitude.
Before reconstructing the signals of a label’s world snapshot, we required human review to ensure quality. Early on, this process was heavily manual, especially when customer feedback was ambiguous or the fidelity of a generated label was unclear.
As our label ingestion rate grew, manual review could not keep up. We were at risk of losing valuable feedback signals simply because we couldn’t process them fast enough.
To address this, we used Bits itself to assist before human review. Grounded in customer feedback and investigation telemetry, Bits aggregates related signals, derives relevant relationships, and resolves ambiguous references in feedback. For example, it can turn “it was slow” into a more precise statement about the elevated latency in a specific service. Since Bits now knows the true root cause, it can build a full causal chain that starts with the problem statement (such as a monitor firing or a user initiating an investigation) and ends with the underlying root cause.
Just like diagnosing the root cause of an issue, this derivation of the root cause analysis was a high-precision, low-margin-of-error operation; however, we were confident our agent’s quality had reached the level where this was possible. We also produced several alignment studies with human judges to ensure we were producing high-quality and causally accurate root causes.
The result is a proposed ground truth and signal set that holds up under review and supports a complete root cause analysis.
As this agentic flow improved, human involvement shifted up a level. Instead of manually assembling root cause analyses from raw signals, reviewers now validate and refine Bits’ outputs.
The results were dramatic: Validation time per label dropped by more than 95% in a single week.
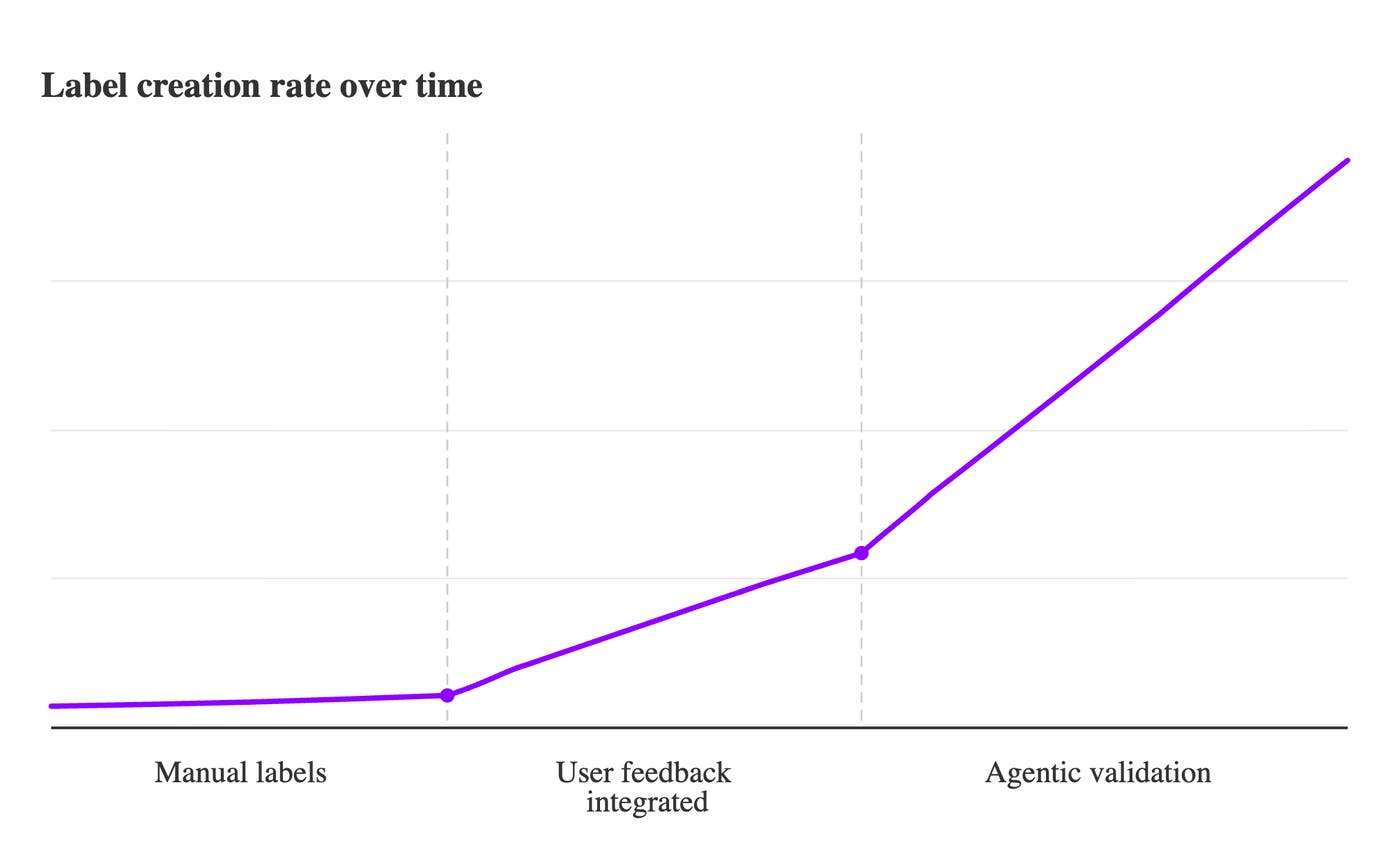
As confidence in the validation pipeline has grown, we have reduced the amount of human intervention required, without sacrificing label quality.
To ensure label quality, each generated label is assigned confidence scores, and anything below a defined threshold is flagged for human review. These scores evaluate the generated RCAs across several dimensions, including thoroughness, specificity, and accuracy.
We observed roughly a 30% increase in the quality of root causes in the generated labels—root causes that would hold up under a “5 Whys” analysis in a postmortem. These higher-quality labels also enabled more robust evaluation.
Instead of scoring only the final conclusion, we could evaluate the agent’s trajectory. We looked at how close it got to the correct answer, whether it investigated deeply enough, and whether it was able to surface valuable telemetry. This allowed us to understand not just whether Bits got the correct answer, but how helpful its investigation was.
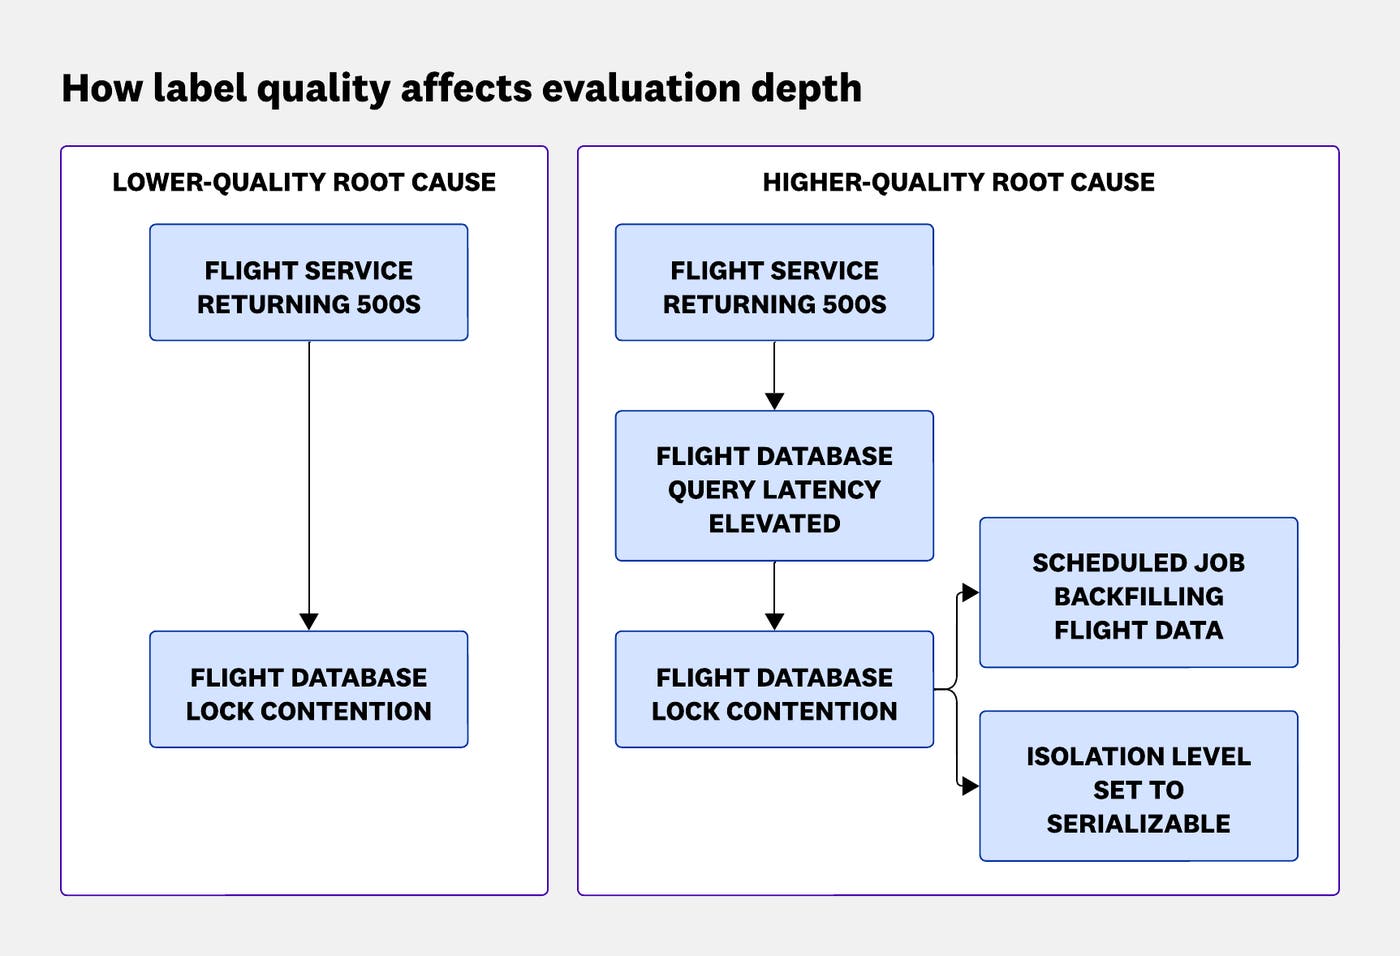
The most counterintuitive thing we learned was that our simulated worlds need to be messy.
With a well-constructed label in hand, we have the ground truth and the signals that surrounded the issue. But telemetry has a limited time to live (TTL). To evaluate the agent later, we reconstruct the investigation context, capturing the structure and relationships across signals, abstracted from the underlying telemetry data, as a snapshot of the world at the moment of issue.
In effect, we build a simulated environment that mirrors the original investigation context, then run Bits inside it. Each environment is fully isolated at the data layer so that investigation context from one label can not affect another. This allows Bits to face the same constraints it would encounter in production, scoped to a single environment.
One key discovery was that these simulated worlds need to be noisy. Snapshotting only the signals directly tied to the root cause is not enough. In production, Bits operates in environments full of unrelated services, background errors, and tangential signals.
To reflect that reality, we capture more than the minimal signal needed to explain the issue. We expand the snapshot by discovering related components based on the root cause chain, even if those components are not directly involved in the failure itself. A component might be included because it belongs to the same platform, team, or monitor, or even just similarly named.
This approach provides a cost-effective mechanism of injecting real-world noise into the evaluation process, mirroring the way an SRE must sift through red herrings during an investigation.
Without that noise, evaluation results looked better than they should have. We were essentially giving the agent an open-book exam with only the relevant pages. No wonder it aced it. The agent appeared more accurate in these simplified environments than it did in real investigations.
Snapshotting telemetry is a one-way door. Once telemetry expires, its structure and signals cannot be reconstructed. When we realized our early labels were too narrow, we had to discard many of them and regenerate those labels with a broader signal reconstruction scope. In the short term, the numbers looked terrible. This reduced our pass rate by roughly 11% and decreased our label count by 35%. But in the long term, it made our evaluations predictive of production behavior.
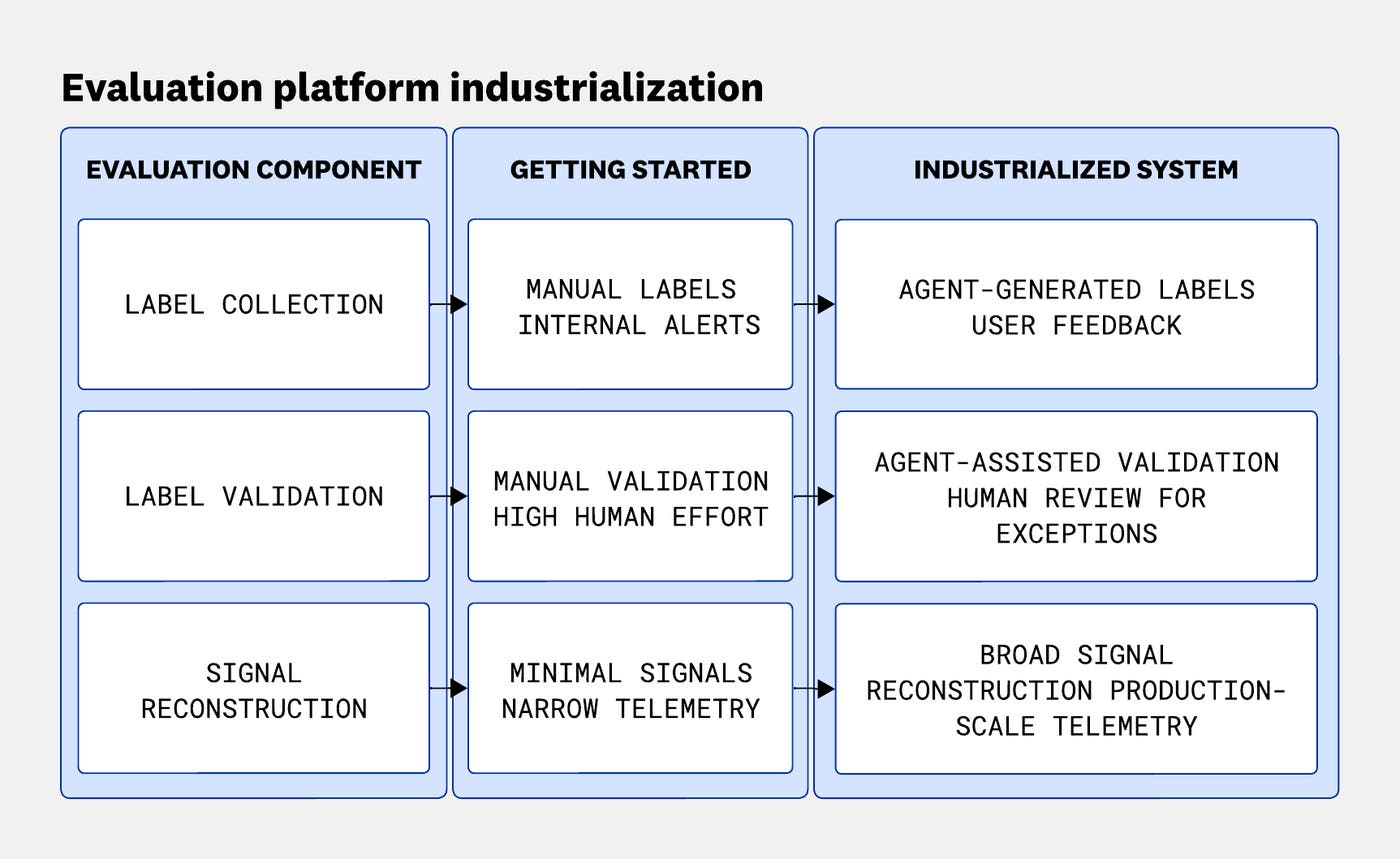
The evaluation system evolved across three major components: label collection, label validation, and signal reconstruction. Early versions relied heavily on manual workflows, but as the platform matured, each of these stages became increasingly automated and integrated into the product. The following diagram summarizes this progression, from the initial manual system to the industrialized pipeline we run today.
With labels collected, processed, and signals reconstructed, we needed a system to run evaluations and make the results actionable.
The platform lets the team segment the label set across multiple dimensions, including technology, problem type, monitor type, and investigation difficulty.
This segmentation lets us scale development across the team. Engineers can focus on the parts of the agent they are improving and evaluate changes against scenarios that matter most, without interfering with other workstreams.
On the reporting side, we store scores for every scenario across every run. We track these results in Datadog dashboards and Datadog LLM Observability so we can compare performance across agent versions. We also maintain an internal labeling application, allowing for centralized observability and metadata management of our labels.
Historical visibility is useful for spotting shifts in behavior. A previously failing scenario starting to pass is informative, as is a previously passing scenario starting to fail.
These kinds of historical score tracking, along with linking to agent metadata, help us understand agent success evolution over time, areas where the agent is strong or weak, and label attributes such as consistently passing, consistently failing, or metrics like pass@k (for a scenario, given k independent attempts, does the agent succeed on at least one of them).
In addition to more targeted runs, we run the full evaluation set weekly to catch regressions that may have slipped through. For example, recently we started internally dogfooding a new tool reasoning strategy. Results looked great on a small subset of evaluation cases; however, upon running the full set, we reported the regression immediately. Results from these runs flow into dashboards and Slack notifications, and we alert on significant deviations in overall performance.
Building this platform changed how we think about agent development. A few lessons stand out.
Manual collection doesn’t scale. People scale linearly, but evaluation needs grow faster as the agent expands into new domains.
Using Bits itself to perform quality checks and fill gaps in labels—rather than requiring high-toil human review—removed the biggest blocker to scaling that system.
This shift required careful scoring and alignment work, but it paid off quickly. Label creation rates increased dramatically, and it pushed us to build better reporting around label quality so we could monitor the health of the label set over time.
Bits evolved faster than we expected, and so did the models powering it. If adding a new label type, integrating with new data sources, or modifying the underlying models requires significant rework, the evaluation system becomes a bottleneck.
For example, only weeks after releasing the Bits AI SRE Agent, we were able to develop a new agent architecture and capability set for a v2 release. That development speed was only possible because the evaluation platform was designed to evolve alongside the agent.
Segmenting results by domain shows where the agent performs well and where it struggles. When we identify a weak area, we expand the label set in that domain. We actively seek out the hardest scenarios, mining negative feedback and exploring frontier areas where the agent is least proven. The labels that matter most aren’t the ones Bits passes. They’re the ones it fails.
In some cases, we even create labels for capabilities the agent does not yet support. This lets us build evaluation suites alongside new features instead of retrofitting them later.
The feedback loop we built for Bits is now extending beyond a single agent.
We have extended this evaluation platform across other agents at Datadog, turning label collection from human signals into fuel for additional products. Additionally, in following our example, agents across Datadog are starting to personalize their reasoning loops based on evaluation information provided by users, allowing for high agentic precision and reliability across the organization.
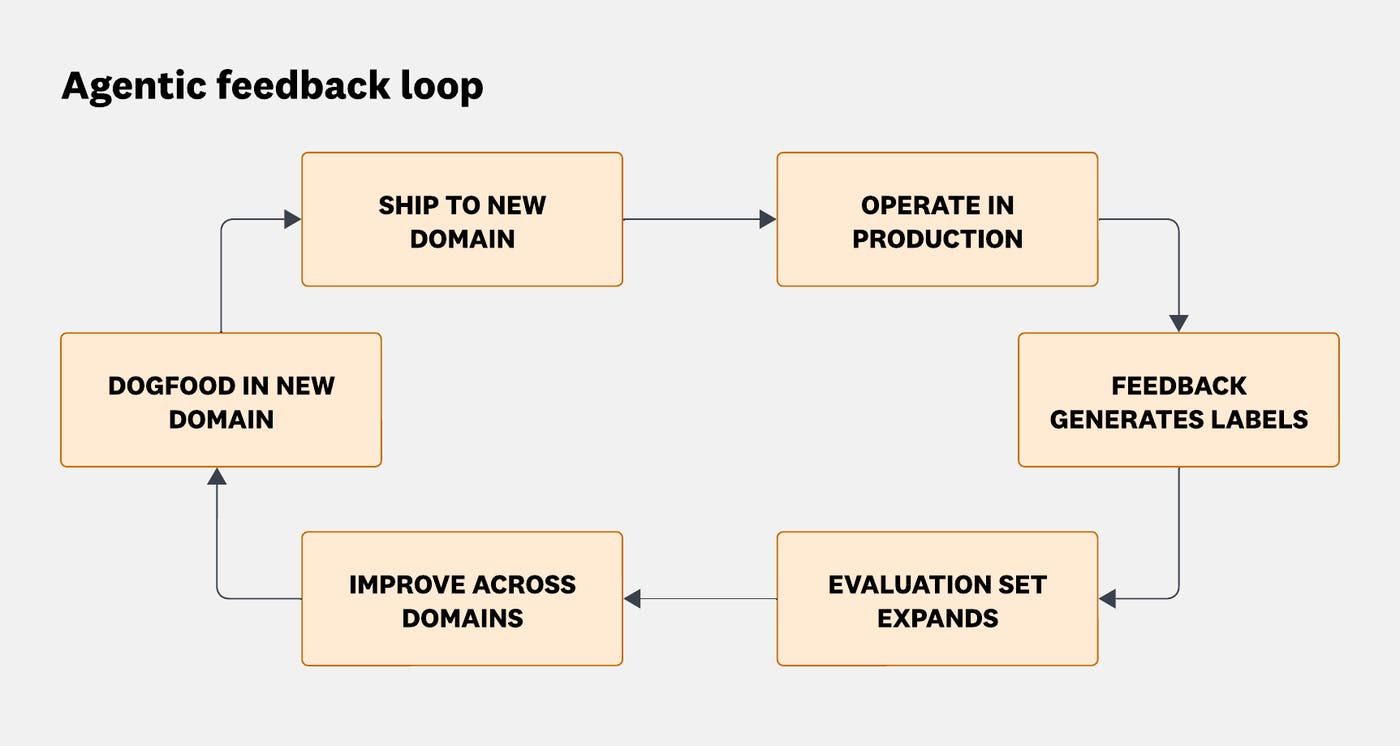
In the process of expanding this platform, we’ve also widened the top of the evaluation funnel even further. Our agentic label collection now extends into the everyday workflows of software engineers at Datadog. Internal incidents, issues, and alerts can be transformed into coherent evaluation labels. This has allowed us to bootstrap other Datadog teams, such as APM and Database Monitoring, as they build and refine their own agentic features. Any team building an agent now has access to a large, representative label set and evaluation infrastructure from day one.
The evaluation platform also changes how we respond to new models. New models don’t just offer incremental improvements. They can unlock new workflows and capabilities. When a new model becomes available, we run it against the full label set to measure its impact across domains and understand what it improves and what it breaks. Instead of discovering those shifts in production, we evaluate them upfront. When Claude Opus 4.5 became available, we ran it against our full label set within days and identified which investigation types improved, and more importantly, which ones regressed. That kind of rapid, systematic evaluation of a new model would not have been possible a year earlier.
Building a reliable AI agent is as much about evaluation infrastructure as it is about the agent itself. When we started, we had no standardized way to track quality, catch regressions, or understand how features generalized across real-world scenarios. By building an evaluation platform fueled by diverse, representative labels collected directly from the product, we created a feedback loop that scales with usage and keeps Bits improving.
Along the way, we learned that noise matters, that manual processes don’t scale, and that the evaluation platform has to keep pace with the agent it supports. Every week, we run Bits against tens of thousands of scenarios drawn from real incidents. Every week, something surprises us. That’s the point.
We didn’t set out to build an evaluation platform. We set out to build an agent that could investigate production incidents. The evaluation platform is what it took to trust it.
If you’re excited about building infrastructure that evaluates autonomous agents across complex, multi-signal production systems, we’re hiring.
此内容由惯性聚合(RSS阅读器)自动聚合整理,仅供阅读参考。 原文来自 — 版权归原作者所有。