





Kubernetes offers the ability to scale infrastructure to accommodate fluctuating demand, enabling organizations to maintain availability and high performance during surges in traffic and reduce costs during lulls. But scaling comes with tradeoffs and must be done carefully to ensure teams are not over-provisioning their workloads or clusters. For example, organizations often struggle with overprovisioning in Kubernetes and wind up paying for resources that go unused. At Datadog, our own internal analysis has shown that between 2023 and 2024, the median CPU utilization of our customers running Kubernetes workloads has decreased from 16.33 to 15.9 percent, using even less of the resources available to them. Teams in charge of scaling, such as platform engineers, application developers, FinOps engineers, and more, must select the appropriate tools to help them scale prudently.
There are a number of different services, both open source and proprietary, that can help teams scale their Kubernetes clusters based on the needs of their applications. These tools fall into two general domains: workload scaling, which ensures that applications can scale to meet their direct demand and traffic efficiently, and cluster scaling, which ensures that a Kubernetes environment can dynamically adjust its cluster resources to handle changing workloads efficiently. These different autoscaling models, and the various services that provide them, all have different strengths and weaknesses, and thus are best suited for different use cases. Their suitability depends on different factors, such as whether you’re scaling an application or infrastructure, whether your application is stateful, and more.
In this post, we will break down the different services and provide guidance on:
Using the Horizontal Pod Autoscaler to fit pod replica count to demand
Using the Vertical Pod Autoscaler to dynamically adjust workload resources
Using the HPA and VPA together
Using the Cluster Autoscaler to scale your nodes
Using Karpenter to provision nodes
Using Datadog Kubernetes Autoscaling to rightsize workloads
Using the Datadog Watermark Pod Autoscaler to handle variable traffic
The Horizontal Pod Autoscaler (HPA) is a Kubernetes API resource and controller that observes cluster metrics such as average CPU utilization, average memory utilization, network requirements, or any other custom metric you specify, and adjusts the desired scale of its target (e.g., a Deployment or StatefulSet) based on those metrics. For example, if the HPA observes a spike in CPU utilization, it will increase the number of pod replicas that are dedicated to the workload experiencing increased resource usage to ensure high availability.
The HPA is a highly popular solution for autoscaling. According to our 2023 Container Report, over half of Kubernetes organizations have adopted the HPA to scale their workloads.
The HPA is best suited for situations where you need to scale based on real-time traffic or workload changes (e.g., web applications experiencing spikes in traffic or processing batch jobs). Additionally, the HPA is useful for scaling stateless applications, where each instance operates independently and does not rely on the state from previous requests. Stateless applications can easily be replicated across multiple pods because stateless design avoids storing session data or user-specific information on the server instance itself, meaning multiple pods can handle any request, and no server instance holds unique information.
The HPA is not the best choice if optimizing resource utilization and maintaining application stability on a per-pod basis is more critical than simply scaling the number of pods. For example, a machine learning model requires significant CPU, memory, or GPU resources, so ensuring that each pod has adequate resources is critical to avoid resource starvation, slow processing, or crashes. Scaling the number of pods won’t help if individual pods don’t have enough resources to function properly. In this circumstance, the HPA would not be ideal, because it adds pods to a workload rather than resources to an individual pod.
The Vertical Pod Autoscaler (VPA) is a Kubernetes component that watches node resource usage via the Kubernetes API and automatically adjusts both requests and limits for containers and pods accordingly. While the HPA adds pods to workloads, the VPA adds resources to pods. The VPA can downscale pods that are over-requesting resources and also upscale pods that are under-requesting resources based on their usage over time.
The VPA includes the following components:
The Recommender, which monitors the current and past resource consumption and, based on these metrics, provides recommended values for the containers’ CPU and memory requests.
The Updater, which checks which of the managed pods have correct resources set and, if not, kills them so that they can be recreated by their controllers with the updated requests.
The Admission Controller, which sets the correct resource requests on new pods (either just created or recreated by their controller due to Updater’s activity).
The VPA is best suited for scaling applications with varying resource needs. Because the VPA dynamically adjusts the CPU and memory resources of running pods based on their actual usage, it can prevent you from over- or under-provisioning resources. For example, an e-commerce application may see traffic spikes during peak hours (e.g., holiday sales, new product launches, or breaking news events), which lead to fluctuating CPU and memory demands. The VPA can dynamically scale your application to meet demand, and then scale down during off-peak hours, when resource consumption may drop significantly. Additionally, the VPA is well suited for making sure no resources are wasted or over-allocated when scaling applications that are memory or CPU-bound (e.g., machine learning workloads).
The VPA is not the best choice for stateless applications that are better served by adding or subtracting pods rather than adjusting individual pod resources. Stateless applications typically benefit from scaling horizontally because it’s more efficient to distribute the load across multiple pods. Additionally, the VPA is not a good choice for workloads where frequent restarts are undesirable (e.g., databases and message brokers, which store transactional data in memory or on disk), since the VPA changes require a pod restart to take effect.
If handled correctly, implementing both the HPA and VPA can provide a comprehensive solution for resource management and traffic handling, with the following benefits:
Minimized waste: Using the HPA and VPA together ensure that pods occupy the right amount of space on nodes, reducing overall node usage and minimizing resource waste.
Automatic traffic handling: With the HPA scaling pods horizontally and the VPA adjusting resources vertically, applications can handle varying traffic loads efficiently and automatically.
Optimized cost and performance: Organizations benefit from improved cost efficiency and performance optimization, leading to better resource utilization and user experience.
While the HPA and VPA can be used simultaneously, it requires careful configuration to avoid conflicts. For example, if the CPU utilization for pods goes above 60 percent, the HPA might try to add more pods in order to manage the expected increase in traffic. But at the same time, the VPA might decrease the size of the pods in order to achieve higher utilization, which would then cause the HPA to add even more pods, creating a feedback loop.
The simplest way to combine these two autoscaling solutions is to use the HPA for CPU scaling and the VPA for memory scaling. However, this may not always be the optimal approach. For example, if your application has variable memory usage, frequent restarts caused by the VPA’s memory adjustments can lead to service disruptions. Or, in situations where memory usage spikes suddenly, the VPA might not react quickly enough to adjust memory limits, leading to pod evictions or crashes, which appear as Out of Memory (OOM) errors. Furthermore, the HPA won’t help in such cases because it’s only scaling based on CPU, leaving the system under-provisioned for memory. Organizations need to assess their specific application requirements and configure the HPA and VPA accordingly to achieve the best results.
Datadog Kubernetes Autoscaling provides workload scaling recommendations and automation alongside cluster scaling observability, including:
A comprehensive list of clusters that highlights key information about idle resources and their associated costs
Time-series graphs of recent cost trends for each cluster
Recommendations based on critical Kubernetes scaling events with node scaling and cluster efficiency metrics
Automation to ensure that the workload stays tuned on an ongoing basis
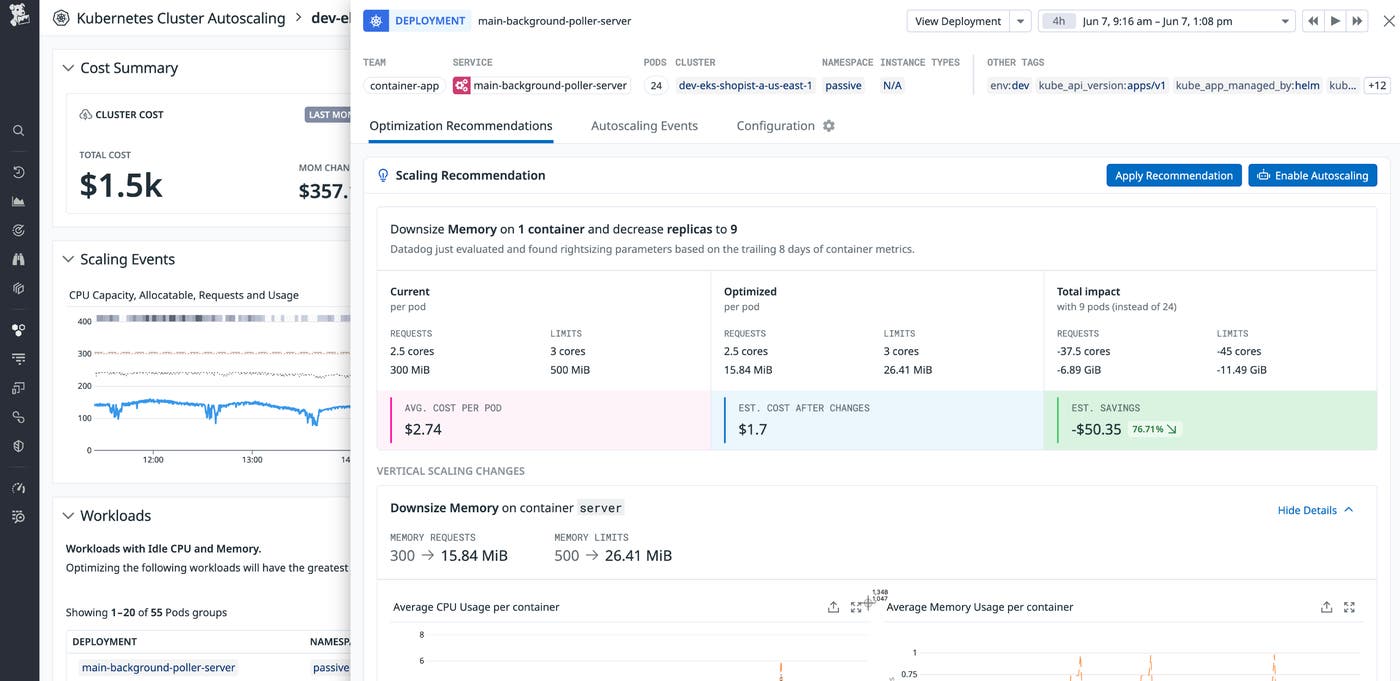
Datadog Kubernetes Autoscaling is perfect for large environments, where it’s important to surface workloads using less than their requested CPU and memory. Once you’ve identified the most critically over-provisioned workloads, Kubernetes Autoscaling can help you rightsize them.
Datadog Kubernetes Autoscaling provides safe multi-dimensional workload scaling, coordinating horizontal and vertical adjustments while factoring in CPU, memory, OOMKilled events, and more to deliver scaling decisions. For instance, with Kubernetes Autoscaling, you can determine which workloads in your cluster are under or over-provisioned and would benefit from additional resources. Then, you can dive deeper to view trends in memory and CPU usage, and take direct action from the platform to apply that recommendation once, or enable continuous autoscaling.
The Cluster Autoscaler (CA) is a Kubernetes component that automatically adjusts the number of nodes in a cluster based on pod resource requests, or when there are nodes in the cluster that have been underutilized for an extended period of time and their pods can be placed on other existing nodes.
The Cluster Autoscaler is useful when the HPA has scaled the number of pods, but the cluster doesn’t have enough resources to schedule them. This can occur in large clusters with varying pod resource requirements (e.g., data processing clusters, CI/CD workloads). Additionally, when jobs complete and pods scale down, CA can remove unnecessary nodes to reduce costs.
CA is not useful for small clusters with stable workloads, or workloads that require fine-grained scaling. These use cases are typically better served by horizontal autoscaling, because the HPA scales pods based on specific application-level metrics like CPU usage, while CA scales on the node level based on overall resource requests and limits.
Karpenter is an open source, Kubernetes-native node provisioning system that provides faster and more intelligent node provisioning than the traditional Cluster Autoscaler. Additionally, Karpenter also optimizes the choice of nodes based on the workload’s requirements and integrates tightly with cloud provider-specific APIs.
Karpenter is best suited for clusters hosting large, dynamic workloads requiring fast adjustments to node counts, such as autoscaling for high throughput or cost-sensitive jobs. This is because Karpenter is driven by the needs of pending pods in the cluster, which means that instead of scaling based on predefined thresholds, Karpenter observes when pods are waiting to be scheduled due to resource constraints and provisions nodes accordingly. This pod-driven scaling approach is ideal for dynamic workloads where the resource needs of applications can change rapidly.
Karpenter is not suited for environments with more predictable workloads and clusters where node creation and deletion speed isn’t a critical issue. In environments with predictable workloads, where resource demands follow a stable or scheduled pattern, a traditional autoscaler (like the Cluster Autoscaler) or static node groups (such as pre-defined autoscaling groups in cloud providers) may be sufficient. Karpenter’s dynamic nature introduces additional overhead and complexity by constantly adjusting node sizes and types based on real-time workload requirements. This may be unnecessary in environments where workloads are stable and the infrastructure requirements are well known in advance.
The Watermark Pod Autoscaler (WPA) controller, created and maintained by Datadog, is an open source custom controller that extends the Horizontal Pod Autoscaler (HPA) to provide more control over autoscaling clusters. Unlike the HPA, which uses a single target value for scaling, WPA allows you to set both a low watermark (min threshold) and a high watermark (max threshold). The WPA is well suited for handling variable traffic because the range of thresholds offers you more granular control over your scaling configurations.
Some additional capabilities the WPA enables include:
Specifying scaling velocity
Specifying windows of time to restrict upscale or downscale events
Adding delays to avoid scaling on bursts of traffic
Different algorithms to compute the desired number of replicas
When using the Watermark Pod Autoscaler, it’s important to frequently revisit the watermark values and metric values based on workload patterns. To learn more about WPA, check out our dedicated blog post.
In this post, we’ve explained how a number of tools in the open Kubernetes ecosystem can help you scale your applications and infrastructure. We’ve also shown how Datadog’s autoscaling solutions can work in tandem with these tools to ensure your infrastructure is able to handle the ebbs and flows of your application’s needs.
Incorporating the HPA (or WPA) and VPA into your Kubernetes environment offers significant benefits in terms of scalability, cost efficiency, and performance optimization. By dynamically adjusting resources based on real-time metrics, these tools help organizations handle traffic spikes and optimize resource usage without manual intervention.
If you’re new to Datadog, sign up for a 14-day free trial.
此内容由惯性聚合(RSS阅读器)自动聚合整理,仅供阅读参考。 原文来自 — 版权归原作者所有。