








Organizations often call product managers the CEOs of the product. But PMs know that’s a myth. When a CEO wants a status report, they get one immediately. They don’t need to negotiate for engineering time, reconcile conflicting project priorities, or wait for a data scientist to find a gap in their schedule. For most PMs, simply understanding the state of the product is where growth can stall.
Product teams run on product signals, and those signals arrive at wildly different speeds. Performance data (latency, error rates, uptime) from engineering arrives in seconds. Frustration patterns (rage clicks, failed navigations, tickets) from support surface in minutes. But business metrics (retention, conversion, lifetime value) from a data warehouse can take days or weeks to materialize. Often, by the time a product change is shipped and its impact is confirmed, teams have moved on to new tasks. There’s no time to compound wins or course-correct failures.
The opportunity for PMs is in closing the gap between product signals; not by waiting for slow signals to arrive faster, but by acting on fast ones sooner. In this post, we’ll look at how categorizing your signals by latency changes the way you respond to them. We’ll also look at why the gap between system health and product performance is where teams lose the most ground.
SREs will tell you if the database is on fire, and analysts will tell you if business metrics fall off a cliff. Between these extremes lies a gray zone of failure where no alerts fire even though the product is underperforming. An SRE might not notice a 10% increase in page load time, and an analyst might not have the bandwidth to check impacts on every user journey. A data scientist might not have the context to connect a specific app version to negative business outcomes.
To move at the speed required, you have to stop treating all data as equal. The key to high-velocity growth is understanding the latency of your signals:
| Signal | Type | Latency | Owner | Why it matters |
|---|---|---|---|---|
| Pulse | Performance, latency, uptime | Instant | Engineering | Save the cycle. If the pulse drops, the experiment is over before it begins. |
| Pain | Rage clicks, friction, “Where’s the widget?” | Minutes | Support/UX | Fail fast. If users can’t find the new feature in five sessions, you don’t need a month of data to know you’ve failed. |
| Proof | Revenue, retention, lifetime value (LTV) | Weeks | Data | The final grade. Validates the long-term hypothesis. |
To see how this plays out in practice, consider a Shopist team running an A/B test on a redesigned checkout flow.
Pulse signals, such as performance, latency, and uptime, flag a problem almost instantly. In this example, the new checkout is adding 1.2 seconds of latency on mobile. No alert fires because the system is healthy, but if the product team doesn’t have visibility into these metrics, they could miss that the experiment is already compromised.
Pain signals, such as rage clicks, user frustration, and other friction, surface within minutes. Session replays show users rage-clicking the “Place Order” button during that delay. A user submits a support ticket: “The checkout is frozen.” The error surfaces within the first 50 sessions.
Because pulse and pain signals together point to the same fix, the team can safely patch and redeploy their test immediately. They don’t need to wait for the proof layer to register impact in the weekly numbers. In this case, the team had clear visibility into pulse and pain signals and pushed a fix the same day.
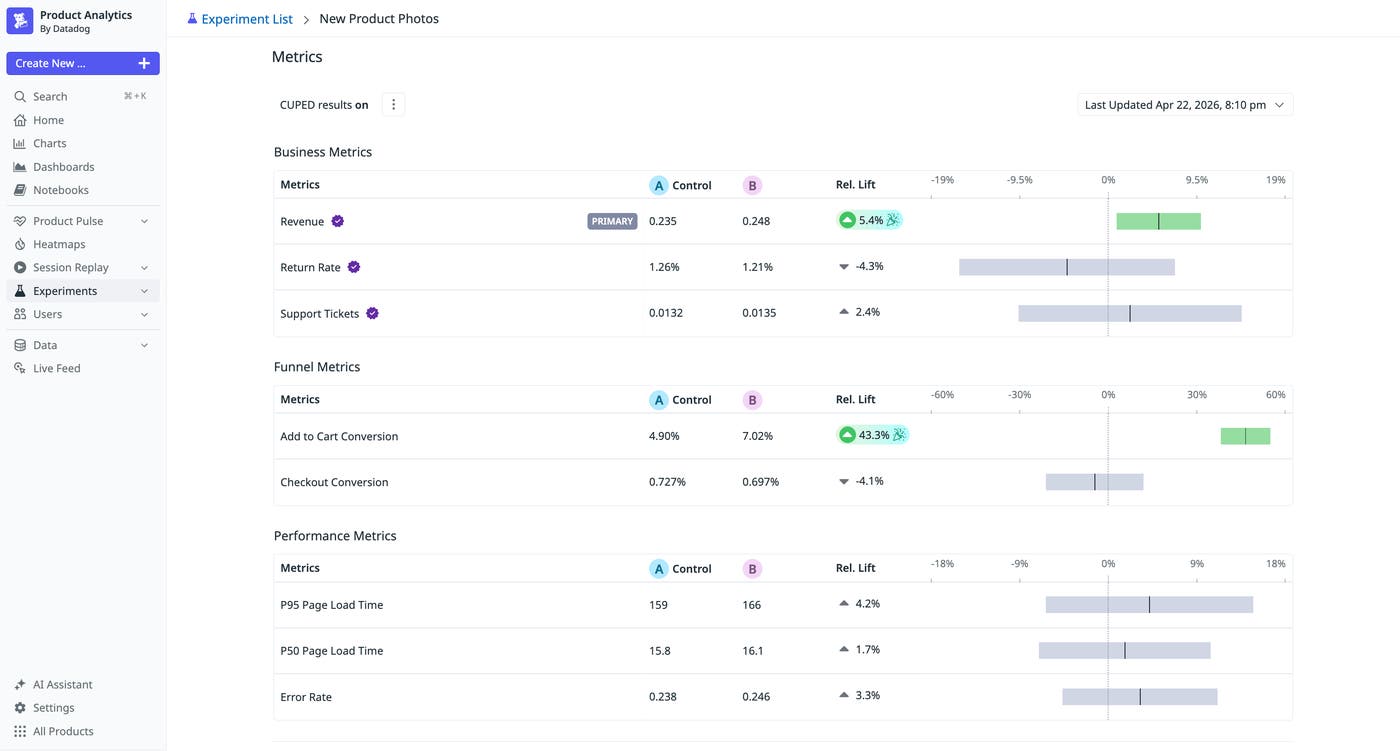
Two weeks later, proof signals, such as revenue, retention, and LTV, show a 14% lift in purchase completion, but only because the bug was caught early. Without the faster signals, it would have silently dragged the results down, and the team might have killed a winning experiment based on corrupted data.
By the time the dust settles on an A/B test and the data scientist confirms statistical significance, teams have already moved on. They’ve lost the opportunity to iterate because they were waiting for a high-latency business metric. Understanding the speed with which teams can make decisions based on lower-latency pulse and pain signals can be the difference between product growth and stagnation.
Historically, understanding pulse, pain, and proof signals for a product change meant stitching together a product analytics vendor, BI tools, a standalone experimentation platform, and a monitoring stack. Each of these came with a handoff and a delay, and bandwidth and competing priorities often made pulse and pain signals lag just as much as proof signals.
The Shopist team caught the problem early because they layered signals together, including session replays, API call latency, and warehouse-native metrics, to provide a more complete picture of impact during the experiment. Warehouse-native metrics let teams measure retention and LTV directly on top of production data without waiting on a separate analytics workflow.
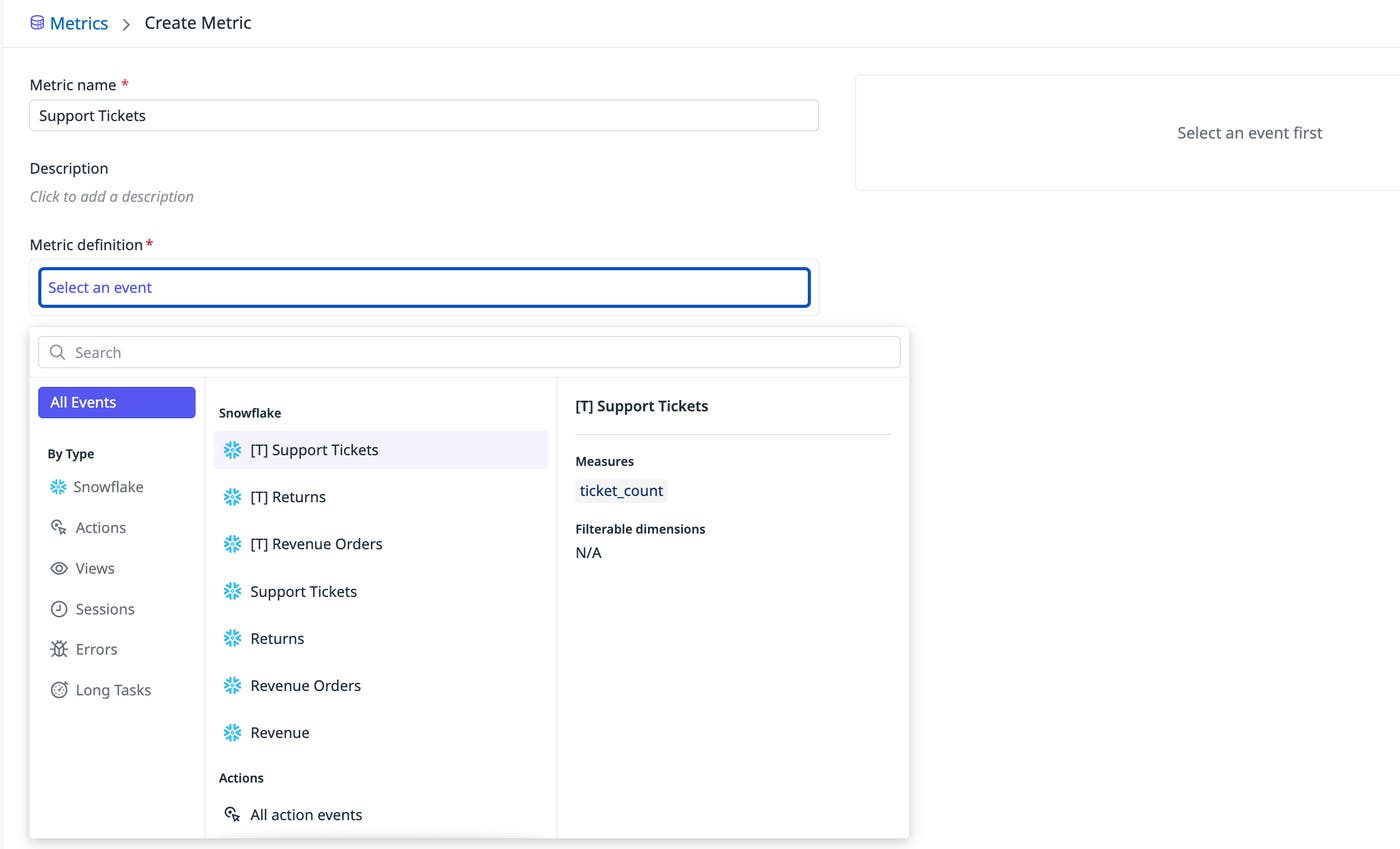
Self-serve analysis tools such as funnel analysis let product and engineering teams explore results themselves without opening a ticket or relying on specialized workflows. Feature flags let teams ship changes behind flags by default and clean them up when an experiment ends. MCP servers extend this further by letting AI agents connect directly to your experiments and update flags based on production signals. And for AI-powered features, with non-deterministic outputs and small changes affecting experience, latency, and cost, teams can test safely in production and measure real business impact through randomized, controlled experiments.
When the cost of an experiment approaches zero, the natural response is to experiment on everything. For a deeper look at what that looks like in practice, read our blog post on Datadog Experiments.
When you have pulse, pain, and proof signals in one place, you stop being an information broker and start being the pilot. You no longer have to piece together a narrative from three different departments. You see what’s happening, you understand why, and you can ship the next change before the current one goes stale.
The tools have caught up to the job description. It’s time to stop managing the process of waiting and start building products with confidence. To learn how Datadog can help you unify your product signals, check out our Experiments documentation and read more about Product Analytics. Or, if you’re new to Datadog, get started with a 14-day free trial.
此内容由惯性聚合(RSS阅读器)自动聚合整理,仅供阅读参考。 原文来自 — 版权归原作者所有。