

惯性聚合 高效追踪和阅读你感兴趣的博客、新闻、科技资讯
阅读原文 在惯性聚合中打开

推荐订阅源

钛媒体:引领未来商业与生活新知
钛媒体:引领未来商业与生活新知
U
Unit 42
GbyAI
GbyAI
M
MIT News - Artificial intelligence
美团技术团队
罗磊的独立博客
雷峰网
雷峰网
量子位
博客园 - 【当耐特】
Last Week in AI
Last Week in AI
D
Docker
小众软件
小众软件
S
SegmentFault 最新的问题
Blog — PlanetScale
Blog — PlanetScale
阮一峰的网络日志
阮一峰的网络日志
宝玉的分享
宝玉的分享
T
Tailwind CSS Blog
WordPress大学
WordPress大学
V
V2EX
博客园_首页
腾讯CDC
The Cloudflare Blog
A
About on SuperTechFans
Cyber Security Advisories - MS-ISAC

Datadog | The Monitor blog

Introducing our open source AI-native SAST Instrument and monitor Boomi integration flows with OpenTelemetry and Datadog Not all index scans are equal: How we cut query latency by over 99% Platform engineering metrics: What to measure and what to ignore Integrate Recorded Future threat intelligence with Datadog Cloud SIEM CI/CD security: threat modeling using a MITRE-style threat matrix CI/CD security: How to secure your GitHub ecosystem Ingress NGINX is EOL: A practical guide for migrating to Kubernetes Gateway API Operating agentic AI with Amazon Bedrock AgentCore and Datadog LLM Observability: Lessons from NTT DATA Introducing the Datadog Code Security MCP Capture and analyze custom heatmaps in Session Replay Understand session replays faster with AI summaries and smart chapters Monitor ClickHouse query performance with Datadog Database Monitoring How we designed empathetic alert sounds for on-call engineers Search and act across Datadog to resolve issues faster with Bits Assistant Measure the business impact of every product change with Datadog Experiments Analyzing round trip query latency Configuring JavaScript caches for better performance Introducing Bits AI Dev Agent for Code Security Datadog achieves ISO 42001 certification for responsible AI Monitor Nutanix clusters, hosts, and VMs with Datadog Monitor Juniper Mist in Datadog A new Host Map for modern infrastructure Annotate traces to improve LLM quality with Datadog LLM Observability What’s new in Cloud SIEM: AI-powered investigations, enhanced threat intelligence, and scalable security operations Explore Kubernetes with native OpenTelemetry data Monitor Oracle Fusion Cloud Applications with Datadog Announcing the Datadog Terraform provider v4.0.0 Scaling Kubernetes workloads on custom metrics How to design cloud environments for AI-powered threat analysis
Datadog Agent 5.0: dead-simple installation, large-scale ...
Alexis Lê-Quôc · 2014-08-22 · via Datadog | The Monitor blog

We’re pleased to announce the release of the new Datadog Agent (dd-agent 5.0.0). The new Datadog Agent expands OS support and metric collection for some new and existing integrations. We’ve also engineered the Agent to make the configuration of many Datadog integrations even simpler.

Expanded OS support

The new Datadog Agent 5.0.0 expands the list of supported operating systems to include three additional, widely-used operating systems: RedHat 7, CentOS 7 and the latest versions of Fedora. You can find installation instructions here.

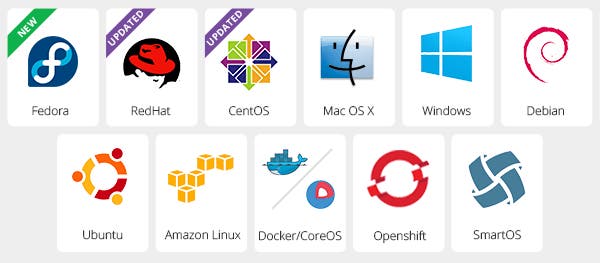
Datadog expanded OS support
Datadog’s supported OS
Datadog expanded OS support
Datadog’s supported OS

Additional metrics collected

This latest Agent release adds a new integration to collect metrics from SNMP and expands the metrics that Datadog collects from Docker. The SNMP capabilities will be explained in more detail in a future blog post but we wanted to give you a taste of what some of the new Docker metrics the new Datadog Agent monitors look like in our ScreenBoards.

Expanded Docker support

The Docker integration has been improved to monitor large numbers of containers providing more visibility into large-scale container-based platforms such as CoreOS. You can then use Datadog’s dashboarding capabilities to pull together some of your new Docker metrics such as the number of running and stopped containers and number of images on a ScreenBoard such as the one below.
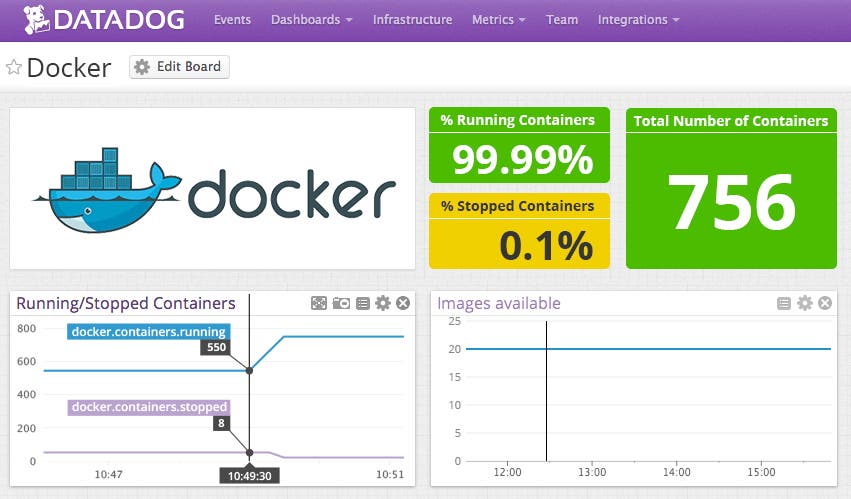
Additional Docker metrics in a custom Datadog dashboard.
Docker support with Datadog
Additional Docker metrics in a custom Datadog dashboard.

Aside from visualizing Docker metrics, you can use Datadog multi-alerts to find outliers among your containers running the same image.

Dead Simple Installations

The new Agent contains all libraries needed to run all agent-based integrations out of the box, so that you do not need to worry about dependencies. If you are interested in learning more about how we solved integration dependencies with one downloadable Agent, this blog, from our engineer Remi Hakim explains it in detail (spoiler alert: we use Omnibus).

If you’d like to be able to quickly collect, graph, analyze and alert on the new metrics and OS mentioned above, sign up for a free 14-day Datadog trial. You will have access to this data immediately after the new Agent is installed.

We’d like to also extend a hearty thank-you to the community. The contributions that we received from @wisqnet and @Tenzer, as well as, the feedback and beta testing support from many of you, made this new agent release possible.