






John Matson
If you’re running an application in the Microsoft Azure cloud, chances are you’re tying together several different Azure services to ensure that your application is fast, resilient, and scalable. But getting a comprehensive view of your application infrastructure can be a challenge, especially if you use a mix of both cloud-native Azure services and platform-agnostic open source or commercial applications.
So we’re pleased to announce that you can now monitor Azure Redis Cache with Datadog. Azure Redis Cache adds to the popular Azure services we already support, including Azure VMs, Azure App Service, Azure SQL Databases, and Azure Logic Apps, which we covered in a companion blog post. In total, Datadog integrates with more than 1,000 popular technologies, so you can monitor your entire application infrastructure in one place.
Redis is a widely used in-memory data store. It is often used as a cache, a message queue, and for database use cases where speed is more important than data durability. At Datadog, we use Redis extensively for caching, queuing background jobs, and assorted data storage tasks.
Azure Redis Cache is a highly available Redis deployment available as a managed service on Microsoft’s Azure cloud platform. It is comparable to Amazon’s managed cache service, ElastiCache. Azure Redis Cache is available in multiple service tiers; the highest-level Premium tier includes enterprise-focused features such as higher throughput, data migration functionality, enhanced security, and data persistence.
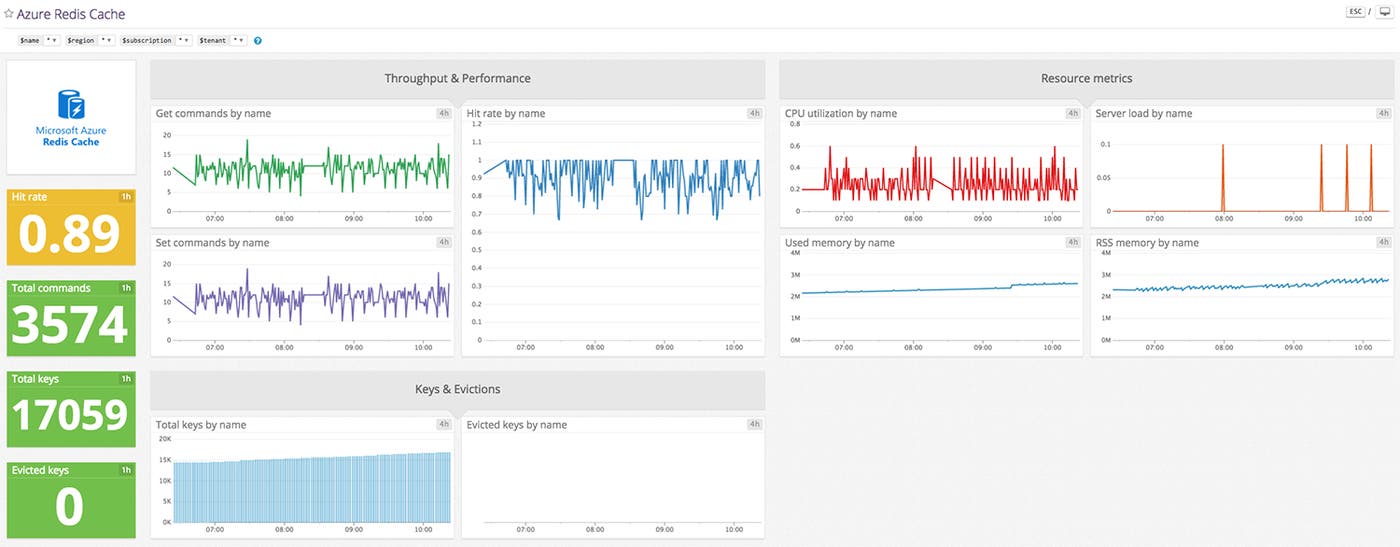
Our new integration lets you access more than a dozen metrics from Azure Redis Cache, including:
Commands processed (Get and Set)
Cache hits and misses
Total keys, keys evicted, and keys expired
Memory usage, CPU, and server load
As soon as you enable the Azure integration, you will see your metrics populating a customizable dashboard for Azure Redis Cache in Datadog.
You can take your monitoring a step further by building comprehensive dashboards that surface metrics from your caching layer, as well as from the applications or services that your cache supports. That way you can quickly determine how application performance correlates with the hit rate, throughput, or resource usage of Azure Redis Cache. You can also set alerts on any of your Azure Redis Cache metrics so you can be notified if, for instance, your cache starts to evict an unusually large number of keys.
The metrics from Azure Redis Cache are available thanks to our integration with Azure’s new Metrics API, which was announced this week at Microsoft Ignite. We will continue to add Azure integrations to Datadog as additional Azure services are connected to the new Metrics API.
If you’re already monitoring your infrastructure and applications with Datadog, Azure Redis Cache metrics are available for graphing, alerting, and correlation in Datadog today. If you’d like to see how Datadog can help bring observability to your Azure cloud infrastructure, you can sign up for a free Datadog trial here.
此内容由惯性聚合(RSS阅读器)自动聚合整理,仅供阅读参考。 原文来自 — 版权归原作者所有。