






Visibility into your Salesforce environment is crucial for keeping your data secure and ensuring a seamless user experience. That’s why we are excited to announce that Datadog can now collect Salesforce event logs via the Event Log File (ELF) API as well as directly from your Real-Time Event Monitoring stream. With more than 50 event types supported via ELF and 14 event types supported via real-time streaming, this integration helps you analyze your logs to get deep insights into the security and operational performance of your Salesforce environment.
Salesforce’s real-time event monitoring records all user actions that occur within your application, and you can supplement this data with requests to the ELF API to access even more event types. Once you’ve connected your Salesforce org to Datadog, Datadog will begin ingesting your Salesforce event logs and automatically parse out key information so you can search, filter, and analyze event attributes. You can specify the events you care about directly in the integration tile to avoid extraneous data. Salesforce data will populate an out-of-the-box dashboard, which you can use to visualize Salesforce activity without any further configuration. You can clone the dashboard to customize and add widgets depending on your needs.
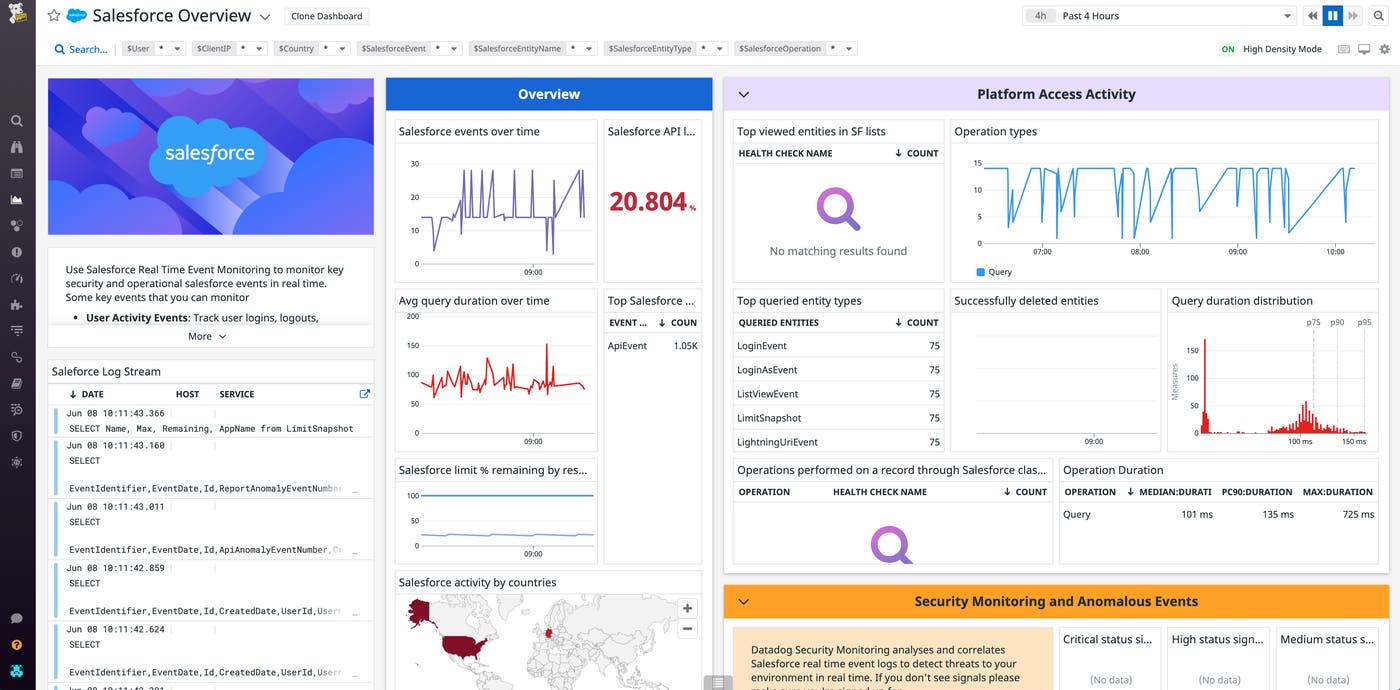
In this post, we’ll show how Datadog enables you to monitor, analyze, and alert on key types of Salesforce events, including:
user activity, such as user authentication events
platform access activity, including API calls and resource creations and deletions
security logs that track anomalous activity within your Salesforce application
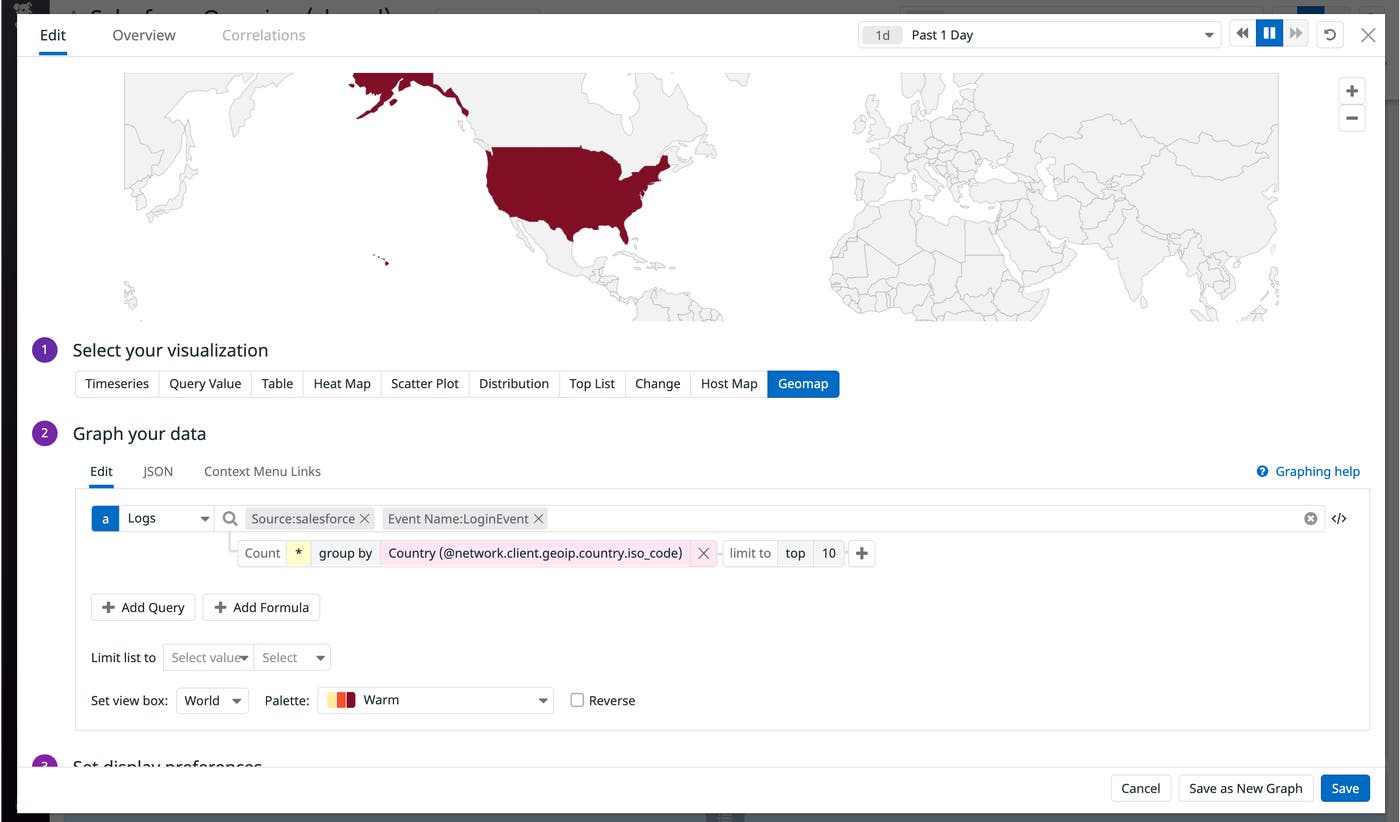
Salesforce events contain detailed information on user actions including logins (LoginEvent), logouts (LogoutEvent), identity verification (IdentityVerificationEvent), and delegated logins by SFDC admins (LoginAsEvent). Datadog’s processing pipeline parses the JSON-formatted logs to extract attributes like the ID of the user, their IP address, and the Salesforce entity that they accessed. Inside the Log Explorer you can query and filter your Salesforce logs using any of these attributes to spot suspicious trends and anomalies. For instance, you could visualize user login events by location to easily see if any are originating from an unexpected location. Or, by visualizing login attempts by user ID, you can easily determine if there are particular users with many failed login attempts.
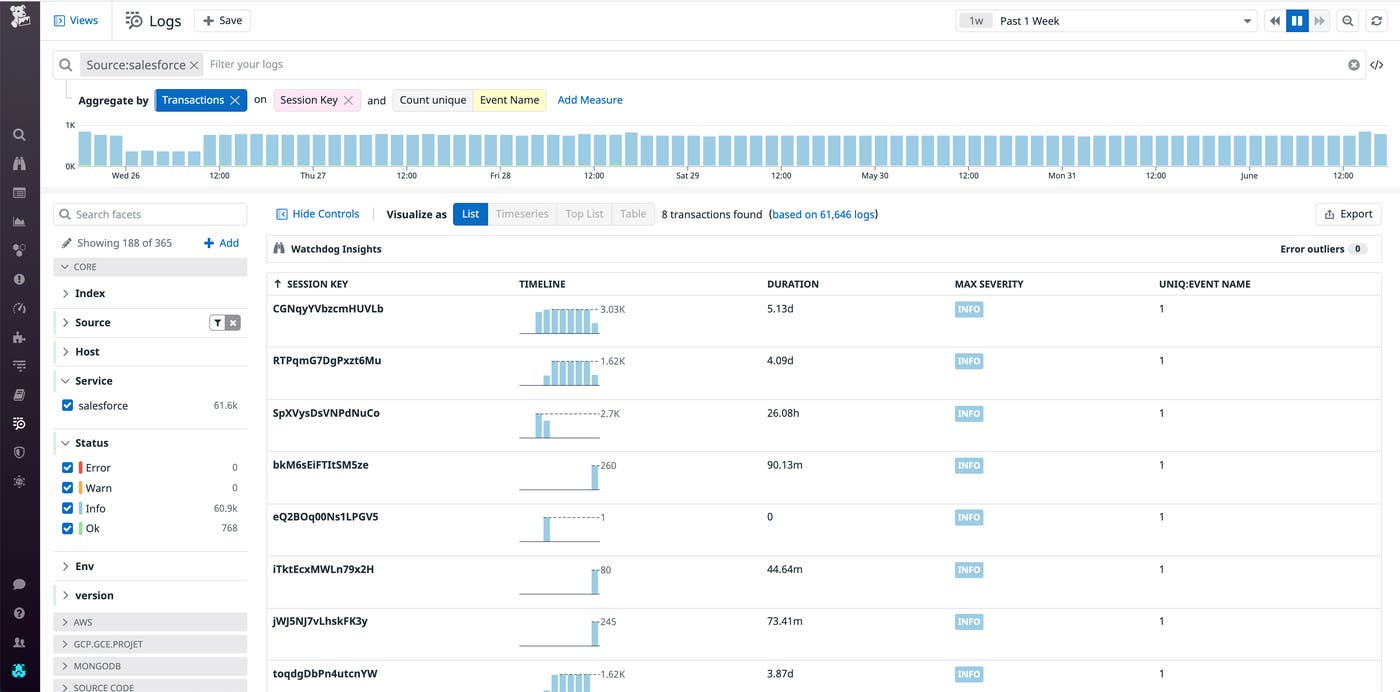
In addition to monitoring overall trends and anomalous user activity, it’s important to have a granular view of what users are doing within your Salesforce org, like what entities they’re viewing and the types of queries they’re making. Salesforce event logs are identified by a user session key (session_id). With Log Transaction Queries, you can aggregate all logs by one or more shared attributes. In the below example, we’ve aggregated Salesforce logs by session key and counted the unique Event Names. Each grouping represents a user session with a timeline of Salesforce events associated with that session, showing you the complete picture of what actions a user took and exactly what they queried. So, if you find a user gained access to your org after a suspicious number of login attempts, you can pivot to their session to see what actions they took and verify if their activity was legitimate. Using requests to the ELF API, you can access user activity logs on key actions such as searching, running reports, and document and attachment downloads. With records of these actions, you can spot when malicious users were able to access sensitive data.
Along with user activity, it’s important to have visibility into how users are accessing your Salesforce resources. Datadog lets you track and visualize key activity across your Salesforce resources, like which entities users are viewing or querying the most.
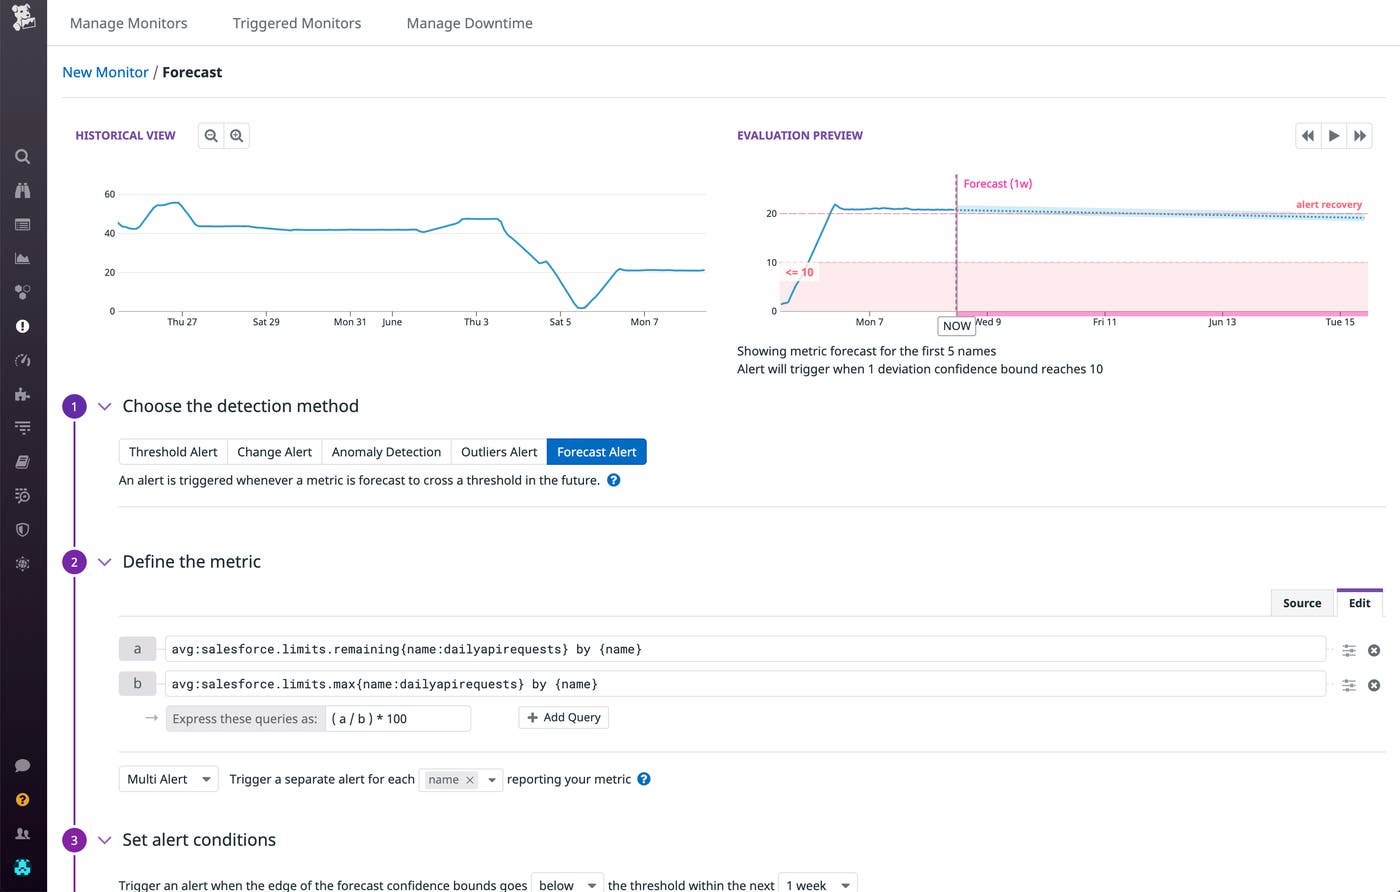
You can also monitor and alert on API usage trends to make sure your users don’t run into any issues. For example, creating a forecast monitor on your remaining allowed API calls (salesforce.limits.remaining) ensures you know ahead of time if you are approaching any limits (salesforce.limits.max). Or, you can set an anomaly alert on API operation type over time to alert you to unusual patterns of API activity. Using the dedicated ELF events for REST, SOAP, and Bulk API calls, you can drill down into individual calls to check the credentials of the user who issued them, as well as view their user ID, client IP address, and session key. This way, you can easily identify and track users who are performing suspicious API calls.
Salesforce generates events when it detects common security threats and vulnerabilities such as session highjacking and anomalous user activity. In Datadog, you can create Threat Detection Rules to generate a security signal as soon as Datadog receives any of these events.
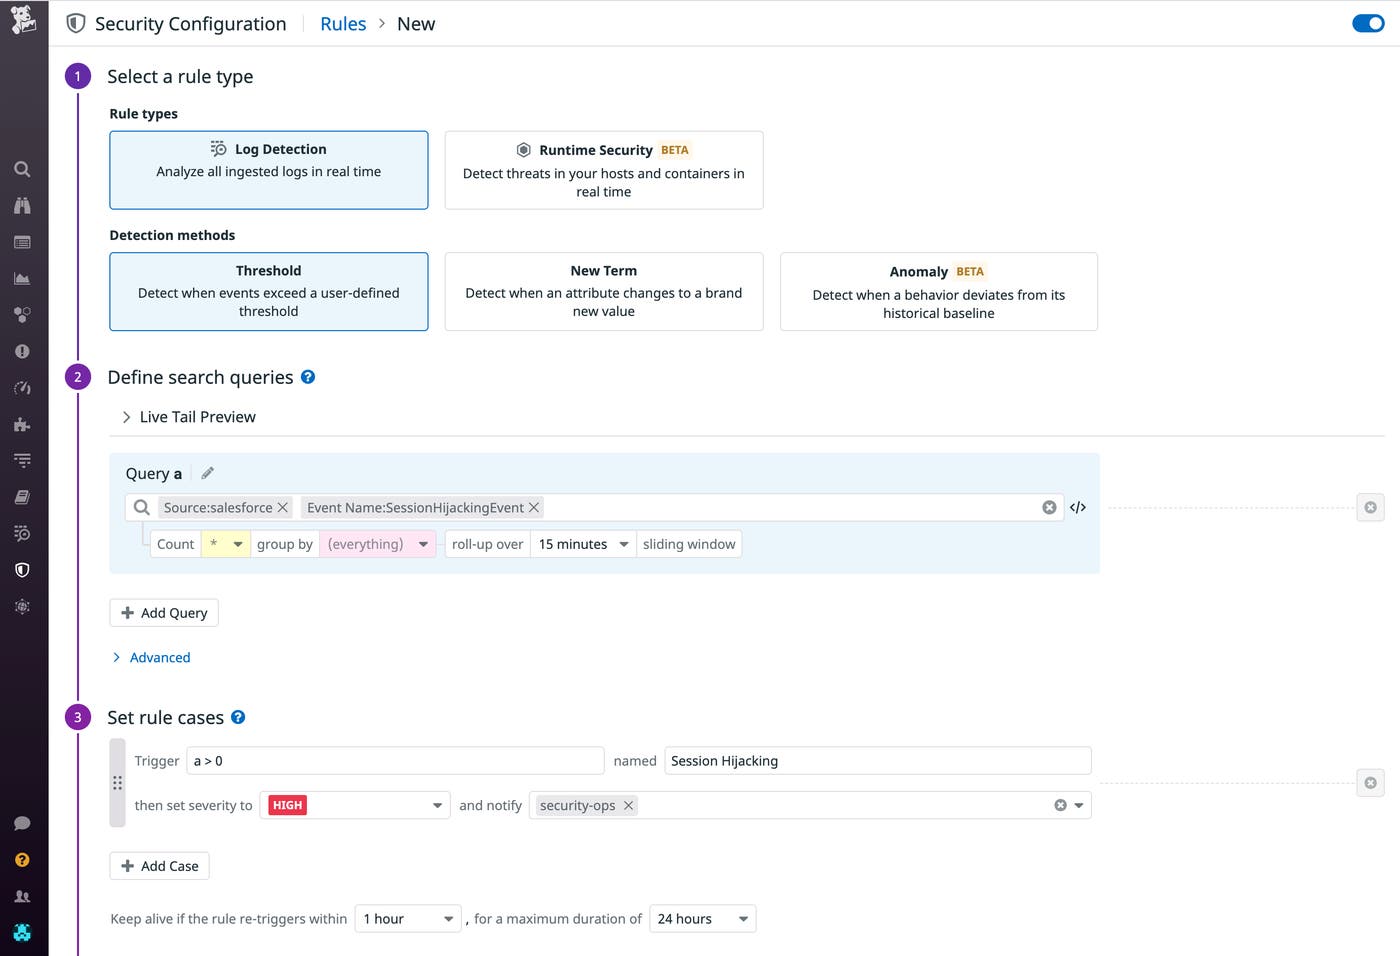
For instance, Salesforce logs a SessionHighjackingEvent when it detects a possible successful “Man in the Browser” attack, which is when an attacker compromises a user’s browser to obtain their session token and collect sensitive data. Below, we’ve created a rule to trigger when a log containing the evt.name:SessionHijackingEvent attribute appears in Datadog. Since the event log includes the user session ID, you can easily see which session needs to be investigated, and filter for it in the Log Explorer to see which resources were accessed around the time of the attack.
Datadog also provides out-of-the-box Threat Detection Rules to detect and alert you to other suspicious behavior in your Salesforce org, including:
Anomalous number of records deleted
Brute-force attack on a user
Successful credential stuffing attack after a number of failed user logins
Unusually large number of results from a Salesforce query
User login from a disabled account
Salesforce’s ELF API and real-time event monitoring capabilities let you access a broad swath of log reporting data on platform activity across your entire Salesforce environment. With Datadog’s new integration, you can aggregate all of your Salesforce logs to get deep insight into user activity, API usage, and potential threats or vulnerabilities, and correlate that data with telemetry from more than 1,000 other technologies. If you’re already signed up with Datadog, you can connect your Salesforce org today. Or, sign up for your 14-day free trial.
此内容由惯性聚合(RSS阅读器)自动聚合整理,仅供阅读参考。 原文来自 — 版权归原作者所有。