


惯性聚合 高效追踪和阅读你感兴趣的博客、新闻、科技资讯
阅读原文 在惯性聚合中打开

推荐订阅源

F
Full Disclosure
Recorded Future
Recorded Future
T
Tenable Blog
S
Securelist
C
CERT Recently Published Vulnerability Notes
T
Threatpost
S
Schneier on Security
A
Arctic Wolf
The Hacker News
The Hacker News
C
CXSECURITY Database RSS Feed - CXSecurity.com
Know Your Adversary
Know Your Adversary
P
Privacy International News Feed
Threat Intelligence Blog | Flashpoint
The Register - Security
Cisco Talos Blog
Cisco Talos Blog
AWS News Blog
AWS News Blog
K
Kaspersky official blog
T
True Tiger Recordings
T
Threat Research - Cisco Blogs
V
Vulnerabilities – Threatpost
P
Palo Alto Networks Blog
T
The Exploit Database - CXSecurity.com
小众软件
小众软件
B
Blog
Cyber Security Advisories - MS-ISAC
Microsoft Azure Blog
Cyberwarzone
Cyberwarzone
C
Cybersecurity and Infrastructure Security Agency CISA
T
Tor Project blog
Spread Privacy
Spread Privacy
Malwarebytes
Malwarebytes
P
Proofpoint News Feed
F
Fox-IT International blog
F
Fortinet All Blogs
P
Privacy & Cybersecurity Law Blog
G
GRAHAM CLULEY
量子位
Latest news
Latest news
OSCHINA 社区最新新闻
OSCHINA 社区最新新闻
博客园 - 叶小钗
Project Zero
Project Zero
T
Tailwind CSS Blog
N
Netflix TechBlog - Medium
Martin Fowler
Martin Fowler
IntelliJ IDEA : IntelliJ IDEA – the Leading IDE for Professional Development in Java and Kotlin | The JetBrains Blog
I
Intezer
博客园_首页
腾讯CDC
H
Hackread – Cybersecurity News, Data Breaches, AI and More
D
Darknet – Hacking Tools, Hacker News & Cyber Security

Datadog | The Monitor blog

Introducing this year’s new Datadog Ambassadors and the new Datadog Champions program How to measure developer experience (DevEx) in the AI era Improve API authentication detection with Datadog Securing AI agents: Why guardrail placement is a key design decision Project and manage cloud spend with Datadog budget forecasting Reduce CVE noise with OpenVEX assessments in Datadog How we made a SQL query optimization agent 59% more accurate using autoresearch and LLM Observability How to audit and clean up monitors effectively Diagnose slow PostgreSQL queries faster with explain plan correlation Explore Datadog metrics with Natural Language Queries Toto 2.0: Time series forecasting enters the scaling era Simplify micro-frontend observability with Datadog RUM Attribute AI costs across providers with Datadog Cloud Cost Management Diagnose and resolve database performance issues faster with Database Investigator Datadog for Government achieves FedRAMP® High certification Analyze cloud costs with flexible spreadsheets in Datadog Sheets Inside Datadog’s AI Research Lab: Meet two PhD candidates behind Toto Connect triage and investigation in a single workflow with Datadog Cloud SIEM This Month in Datadog - April 2026 Monitor and optimize Supabase query performance with Datadog Database Monitoring Add dynamically updating context to logs with Reference Tables and Observability Pipelines Introducing ARFBench: A time series question-answering benchmark based on real incidents The product signal latency gap slowing your growth Test network paths with TCP, UDP, and ICMP in Datadog Turn developer feedback into operational insight with Datadog Forms and Sheets How to investigate cloud credential compromise with Bits AI Security Analyst Evaluate, optimize, and secure your Google Cloud AI stack with Datadog Bringing observability data hosting to the UK on AWS Identify and fix code issues faster with Datadog’s Azure DevOps Source Code integration Steganography at scale: Embedding share URLs in Datadog widget screenshots Every team should be A/B testing Centralize observability management with Datadog Governance Console Spotting CI/CD misconfigurations before the bots do: Securing GitHub Actions with Datadog IaC Security Route OTel data from AI apps to ClickHouse and Datadog using Observability Pipelines Manage service tracing across hosts with Single Step Instrumentation rules Offline evaluation for AI agents: Best practices Detect runtime threats in Python Lambda functions with Datadog AAP Introducing our open source AI-native SAST Instrument and monitor Boomi integration flows with OpenTelemetry and Datadog Not all index scans are equal: How we cut query latency by over 99% Platform engineering metrics: What to measure and what to ignore Integrate Recorded Future threat intelligence with Datadog Cloud SIEM CI/CD security: threat modeling using a MITRE-style threat matrix CI/CD security: How to secure your GitHub ecosystem Ingress NGINX is EOL: A practical guide for migrating to Kubernetes Gateway API How we built a real-world evaluation platform for autonomous SRE agents at scale Operating agentic AI with Amazon Bedrock AgentCore and Datadog LLM Observability: Lessons from NTT DATA Introducing the Datadog Code Security MCP Capture and analyze custom heatmaps in Session Replay Understand session replays faster with AI summaries and smart chapters Monitor ClickHouse query performance with Datadog Database Monitoring How we designed empathetic alert sounds for on-call engineers Search and act across Datadog to resolve issues faster with Bits Assistant Measure the business impact of every product change with Datadog Experiments Analyzing round trip query latency Configuring JavaScript caches for better performance Introducing Bits AI Dev Agent for Code Security Datadog achieves ISO 42001 certification for responsible AI Monitor Nutanix clusters, hosts, and VMs with Datadog Monitor Juniper Mist in Datadog A new Host Map for modern infrastructure When upserts don't update but still write: Debugging Postgres performance at scale Annotate traces to improve LLM quality with Datadog LLM Observability What's new in Cloud SIEM: AI-powered investigations, enhanced threat intelligence, and scalable security operations Explore Kubernetes with native OpenTelemetry data Monitor Oracle Fusion Cloud Applications with Datadog Announcing the Datadog Terraform provider v4.0.0 Scaling Kubernetes workloads on custom metrics How to design cloud environments for AI-powered threat analysis Monitor Aruba Central in Datadog How we centralize and remediate risks with Datadog Case Management Accelerate incident response with Datadog and ServiceNow Monitor your application and network load balancer logs Understanding Karpenter architecture for Kubernetes autoscaling Tools for collecting metrics and logs from Karpenter Monitor Karpenter with Datadog What your product data is actually saying Key metrics for monitoring Karpenter Securing Datadog's platform in the AI age: The role of observability data Closing the verification loop: Observability-driven harnesses for building with agents When an AI agent came knocking: Catching malicious contributions in Datadog’s open source repos Closing the verification loop, Part 2: Fully autonomous optimization Four ways engineering teams use the Datadog MCP Server to power AI agents Approaching your observability migration with the right mindset Meet the new Bits AI SRE: Deeper reasoning, twice as fast Designing MCP tools for agents: Lessons from building Datadog's MCP server Key learnings from the 2026 State of DevSecOps study Use plain English to query your multi-cloud infrastructure in Resource Catalog Simplifying troubleshooting across the user journey with Datadog Synthetic Monitoring Protect your OCI resources with Datadog Cloud Security This Month in Datadog - February 2026 Fine-tune Toto for turbocharged forecasts Amazon EC2 security: How misconfigured and public AMIs expand your cloud attack surface Enable end-to-end visibility into your Java apps with a single command Measure and improve mobile app startup performance with Datadog RUM Evaluating our AI Guard application to improve quality and control cost Identify untested code across every level of your codebase Make use of guardrail metrics and stop babysitting your releases Monitor Versa Networks SD-WAN performance in Datadog How we reduced the size of our Agent Go binaries by up to 77%
Measure the real impact of AI coding tools on software delivery with Datadog AI Impact
2026-05-26 · via Datadog | The Monitor blog

Engineering teams have rapidly adopted AI coding tools, but organizations still struggle to understand their impact. Existing dashboards focus on activity, such as daily active users, acceptance rates, or lines of generated code, but these metrics don’t answer a more important question: Are teams actually shipping more, faster, and with fewer issues?

Datadog AI Impact connects AI usage data with your software delivery and DORA metrics so that you can evaluate how AI affects both velocity and stability. By correlating AI-assisted code with outcomes such as lead time and change failure rate, you can move beyond adoption metrics and understand how AI tools influence real engineering performance.

In this post, we’ll show you how to:

- Measure how much faster your teams are shipping with AI

- Evaluate the stability of AI-assisted code in production

- Compare AI coding tools by using delivery outcomes

- Test new models before rolling them out broadly

Measure how much faster your teams are shipping with AI

To evaluate AI’s impact on delivery, you first need to connect usage data with the code changes that reach production. Datadog AI Impact brings together telemetry data from AI coding tools with your DORA metrics, so each commit can be associated with the tool and model that contributed to it.

As commits move through pull requests and into deployments, AI attributes persist alongside them. AI Impact allows you to analyze delivery performance across AI-assisted and unassisted work without requiring manual tagging or custom instrumentation. This foundation makes it possible to analyze how AI influences both speed and reliability, using the same metrics you already rely on to measure engineering performance.
View showing commits enriched with AI tool and model metadata across the delivery pipeline.

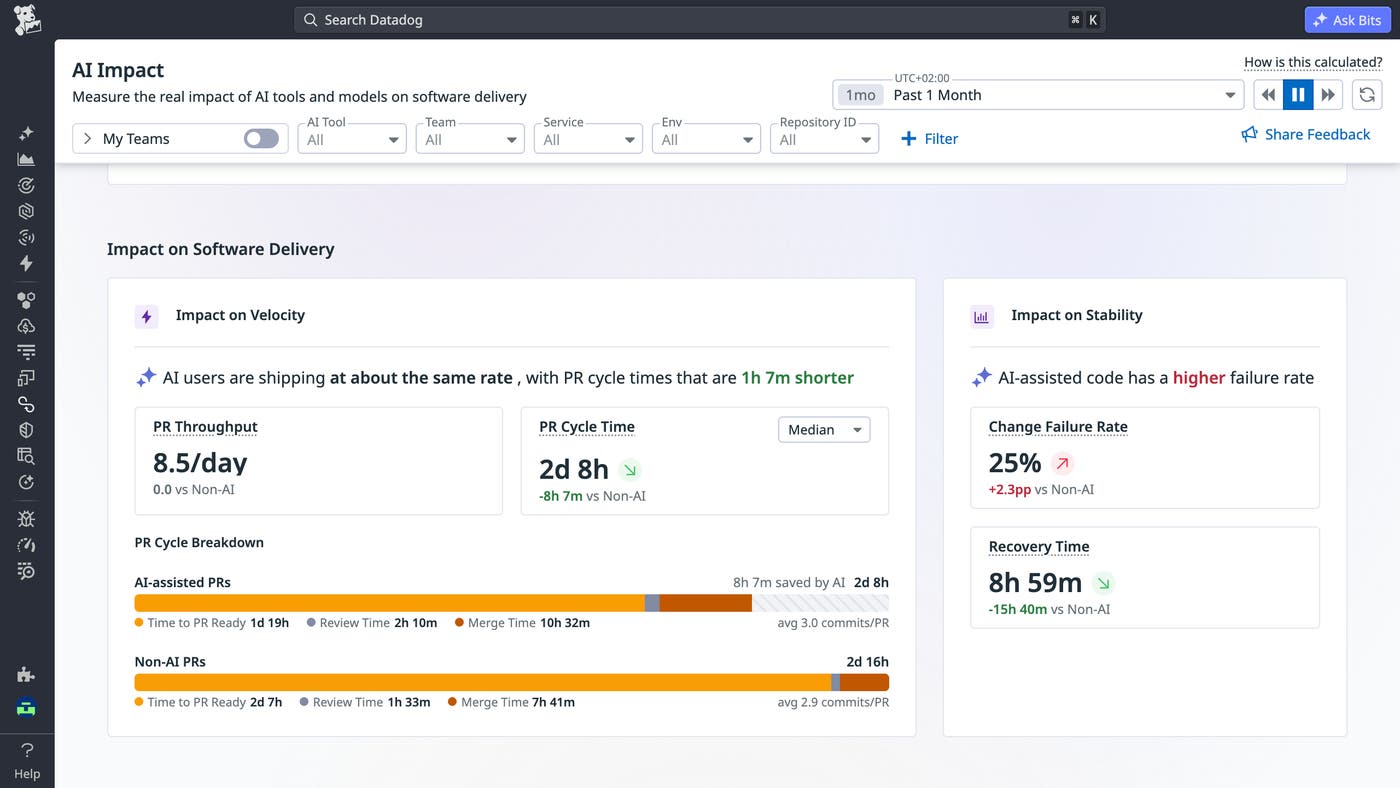
With AI-tagged commits, you can break down delivery performance metrics by whether changes were AI-assisted. AI Impact enables direct comparisons between AI-assisted and unassisted work across your organization.

You can start by analyzing PR cycle time to see how quickly pull requests get merged. Pairing this with review time helps you understand whether AI reduces development effort, shifts effort into review, or changes how teams collaborate.
Dashboard comparing change lead time and pull request metrics for AI-assisted versus unassisted code

AI Impact also lets you evaluate throughput gains such as pull requests deployed per developer each day. This clarifies whether faster development translates into more shipped work or whether gains are offset by factors like larger changes or longer reviews (or amplified by developers working on more tasks in parallel). Because these comparisons are based on your own teams, codebases, and workflows, they reflect real-world performance rather than synthetic benchmarks.

Evaluate the stability of AI-assisted code in production

Speed alone does not tell the full story. If AI-assisted code reaches production faster but introduces more failures, teams may shift effort from development to incident response.

AI Impact helps you evaluate this trade-off by measuring change failure rate (CFR) across AI-assisted and unassisted code, attributing failures proportionally based on the composition of each deployment. For example, consider a deployment containing 80% AI-assisted commits and 20% unassisted commits. If that deployment causes a production failure, AI Impact attributes 80% of the failure impact to AI-assisted code. Over time, these attributions accumulate across deployments, so you can compare failure rates at scale rather than reasoning from individual incidents.

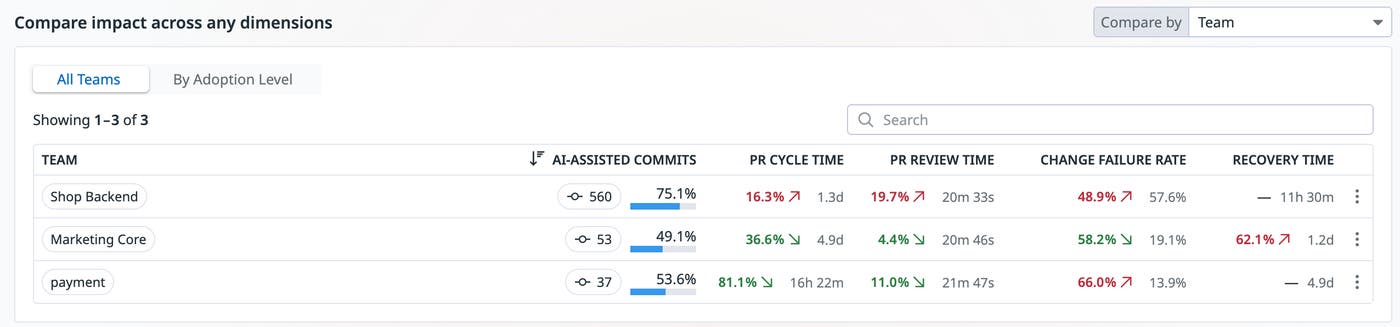
If AI-assisted changes show a higher failure rate, you can investigate further by drilling into specific teams, services, or repositories where the gap is most pronounced. This analysis helps you understand whether AI is improving delivery overall or introducing risks that require additional guardrails.

Compare AI coding tools by using delivery outcomes

Once you understand how AI impacts your delivery metrics, you can extend that analysis to compare different tools and models, such as the Claude Code API, Cursor, and GitHub Copilot. Because AI Impact tags each commit with the associated tool, you can analyze performance across tools by using the same impact metrics. This enables side-by-side comparisons of how different assistants affect throughput, cycle times, and production stability.
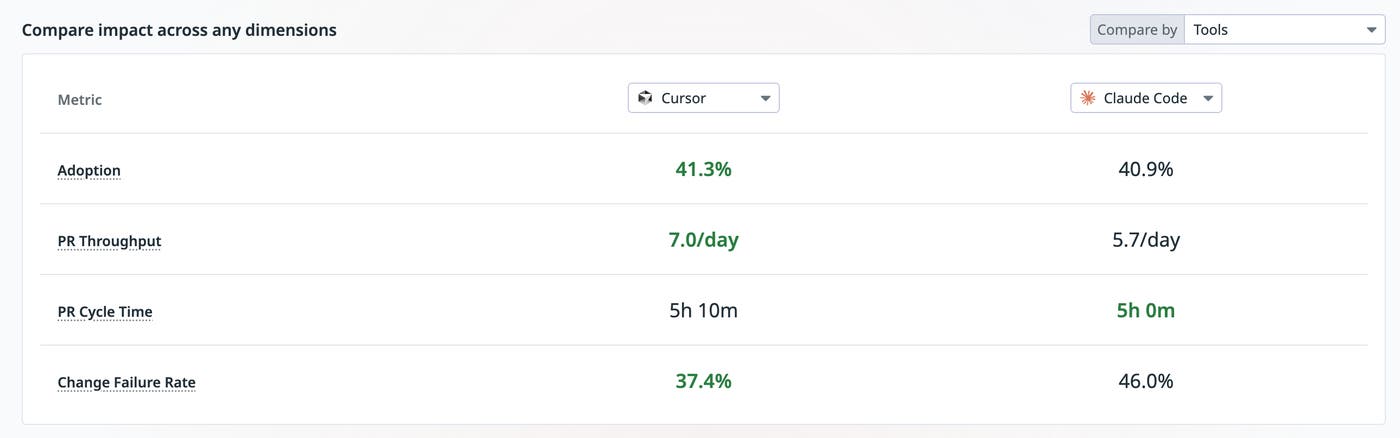
Comparison view showing delivery metrics segmented by AI coding tool across teams and services.

You can also break down results by team, repository, or language to identify where each tool performs best. For example, one assistant may reduce cycle time for backend services, while another may be more effective for frontend development. These comparisons turn tool selection into a data-driven decision grounded in engineering outcomes rather than subjective preference.

Test new models before rolling them out to all teams

AI models evolve quickly, and new releases often promise improved performance at higher cost. Evaluating these trade-offs in your own environment is critical before adopting them widely.

With AI Impact, you can roll out a new model to a subset of teams and monitor its effect on delivery metrics over time. By observing changes across velocity and stability, you can determine whether the model provides meaningful improvements.

For example, a model that reduces coding time but increases review time or failure rates may not deliver overall gains. Similarly, a model that improves performance marginally but increases cost significantly may not justify broader adoption.
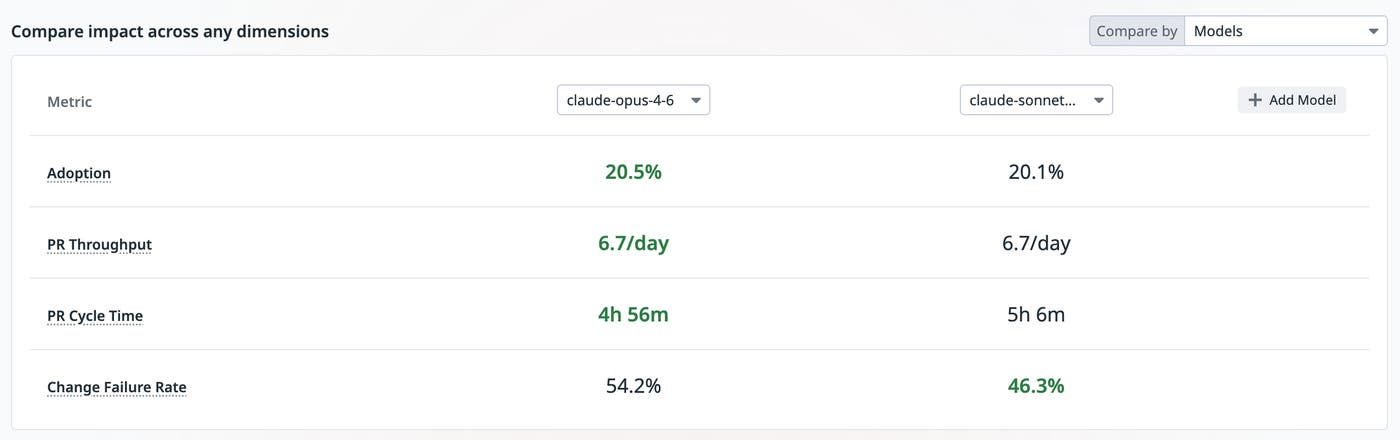
Experiment view tracking DORA metrics for a subset of teams using a new AI model.

By testing changes in a controlled way, you can make informed decisions based on observed outcomes rather than external benchmarks.

Measure and optimize the impact of AI in your organization

AI coding tools are becoming a core part of the software development process, but understanding their impact requires more than tracking usage. By connecting AI telemetry data with delivery metrics, Datadog AI Impact provides a clear view of how these tools affect both speed and reliability.

With this visibility, you can evaluate tools, guide adoption, and make decisions based on real delivery outcomes rather than assumptions. To get started, set up DORA metrics in Datadog and connect your AI coding tool integrations. For more information, see the AI Impact documentation.

If you’re new to Datadog, sign up for a 14-day free trial.