






Managing the software development lifecycle of your applications is a complex task. Releasing software updates in a large and ever-changing ecosystem requires visibility into the state of your services and insight into how changes to these services impact the reliability, performance, security, and cost of your application. The stages of software delivery are often sharded across multiple tools, each purpose-built for a specific slice of your application lifecycle.
Historically at Datadog, our software delivery process was bifurcated into separate build and deployment systems. Configuration for each part of the delivery pipeline was managed separately, requiring a high level of manual coordination to deliver simple changes to our runtime. Telemetry was inconsistent through the pipeline, dropping context during the “handoff” between tools and hindering incident response. These gaps required engineers to become experts in the internal implementation details of our CI/CD systems, reducing the time they could dedicate to building new features for our customers.
This post describes how we improved our software delivery processes by using Datadog to unify disparate processes and ensure our software is updated frequently and safely—with full end-to-end visibility throughout the cycle. We’ll cover a few critical points, including how we:
Define the end-to-end delivery pipeline for an application using the Datadog Software Catalog
Track pipeline speeds and developer experience using CI Visibility
Monitor deployment progress and impact using CD Visibility and DORA metrics
To start addressing these issues in our developer experience, we took a page from Datadog’s product strategy and asked ourselves the following questions: How can we provide a single pane of glass for end-to-end software delivery at Datadog? How can we ensure applications are deployed frequently and safely while providing our engineering teams with the at-a-glance observability they need to know the state of their services?
Our answer began with a new, internal software delivery system called Conductor. You can think of Conductor as an orchestration platform designed to stream changes to our runtime infrastructure using safe release strategies. It provides out-of-the-box visibility for all developers, allowing them to easily track their changes all the way from branch to production. And Conductor is deeply integrated into the Datadog product using the same tools available to our customers.
Datadog’s Software Catalog provides a handy abstraction for isolating “slices” of your runtime in a complex and ever-evolving microservice-based ecosystem. We dogfood heavily at Datadog; as we’ve discussed in previous blog posts, every service at Datadog has a Software Catalog definition, regardless of repository or language. When we started designing Conductor, we wanted to avoid the trap of “yet another YAML” and the subsequent migration work that would inevitably get externalized to each of our teams.
Using the Software Catalog’s private-to-your-organization extensions feature for custom metadata, we created a configuration that was specific to our engineering team’s deployment needs. For each service using Conductor, we give them the ability to define certain parameters, including the following:
Environment
CI pipeline and deployment execution target
Slack channel for notifications on operations
Associated team and on-call rotation
Schedule for executions (optional)
Feature branch (optional)
Because we’ve defined this information in the Software Catalog, we have access to it in the Datadog application. You can see an example of our configuration here:
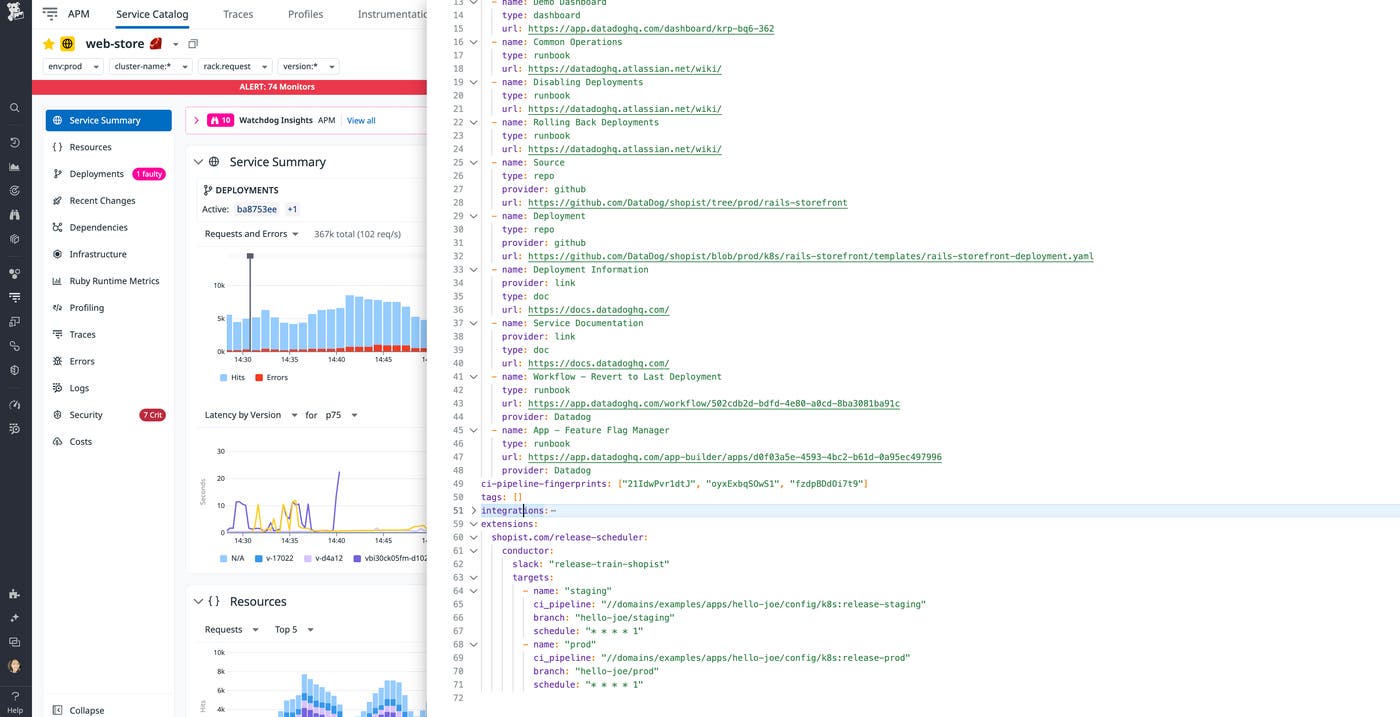
Our engineers now have one location where they can find the service name and details, team ownership, version metadata, description, and the build and deployment pipelines associated with a service. All of this information is available in the Datadog application, so engineers can see at a glance how and when a service is released without tabbing away to another application or wasting critical time during an incident.
Now that we’ve defined the release pipeline in a service’s configuration, we can use this file to direct our orchestration systems. Conductor’s core engine runs on our workflow execution engine—the same engine that powers Datadog Workflow Automation. Users can “signal” Conductor in a variety of ways, such as from a developer merging a PR to a repository, a user running a command from our CLI or triggering a release in our internal developer portal, or on an automated cron. Regardless of input, the release is executed consistently—pulling the service’s configuration, sending a signal to the underlying CI provider to trigger a build pipeline, and dispatching messages to the team’s associated Slack channels to notify the team of the progress of the release. Once the pipeline is successful and the artifact is built, Conductor deploys the associated artifact in sequence across each of our various datacenters, propagating changes slowly across increasing failure domains to minimize the blast radius.
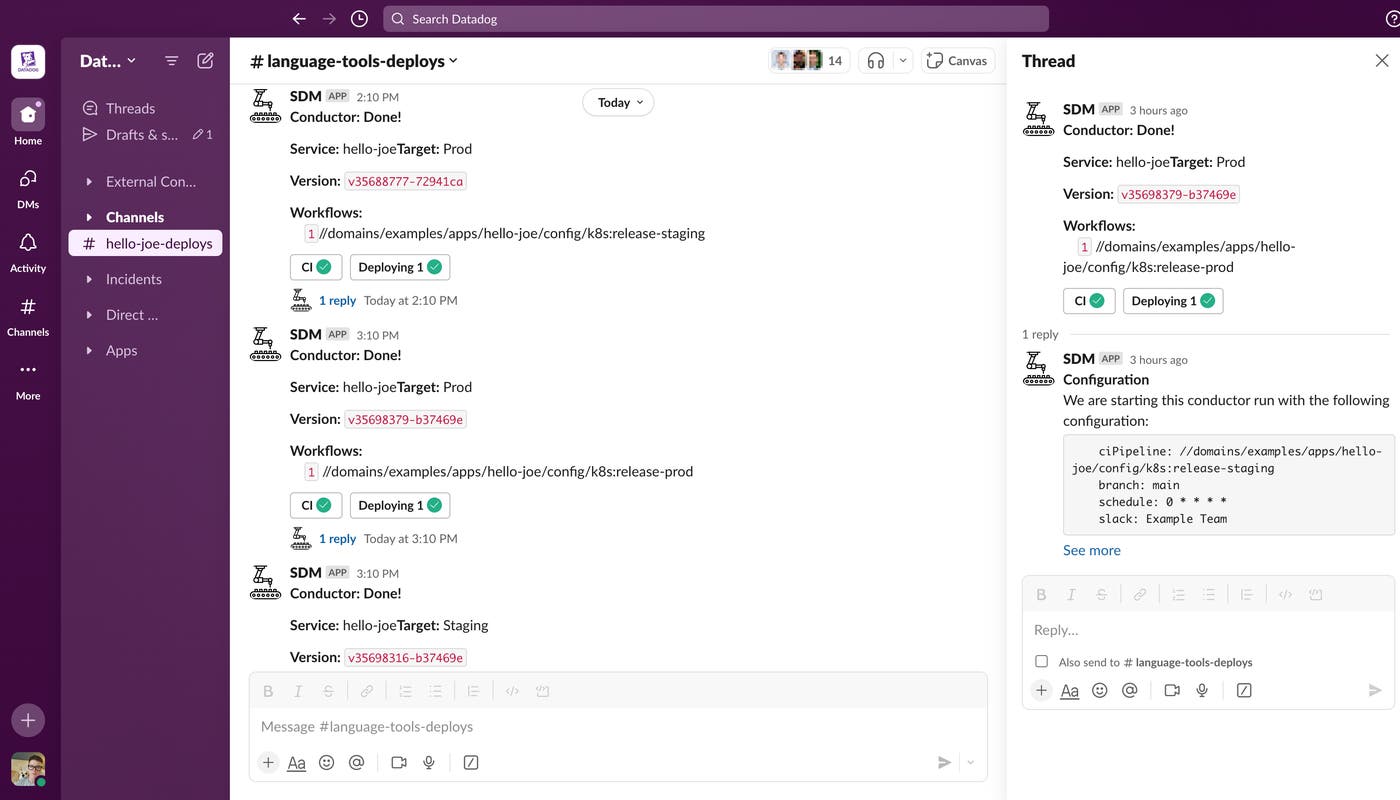
As you can see in the preceding example, Conductor lets us know at a glance what code is getting released and the current pipeline stage, and links to the underlying service providers for troubleshooting. Conductor will also report if anything goes wrong during the execution, notifying our engineers at critical stages to let them know their attention is needed.
Even better, putting Conductor’s configuration into Datadog’s Software Catalog provides us with an abstraction layer between our users and the underlying infrastructure primitives that run our CI pipelines or the deployment execution engine that triggers our rollouts. This makes migrations from one service provider or system to another—or even one version to another—seamless and straightforward, and something that our users no longer need to worry about.
Fundamentally, a deployment represents a scheduled disruption of a service. It’s a moment when developers apply a changeset to a live production environment while minimizing any risk to their systems and the customer experience. Safety and reliability are the most important metrics for any of our software deployments, so as we designed Conductor we knew that we wanted to ensure we were monitoring deployments using the same tooling and telemetry we use to monitor overall system health and performance.
A release of software starts with the commit SHA and the pipeline that builds the artifact. At Datadog, we have services that live in both standalone repositories as well as shared repos with dozens or even hundreds of services. Whereas previously, we struggled to isolate telemetry on a single service’s CI pipeline executions within a shared repository, we can now use Conductor to append the Software Catalog information as a custom tag to Datadog’s CI Visibility product. This allows us to drill down using “service” as a facet to identify flaky tests and regressions and more quickly troubleshoot problems in our build pipeline setup.
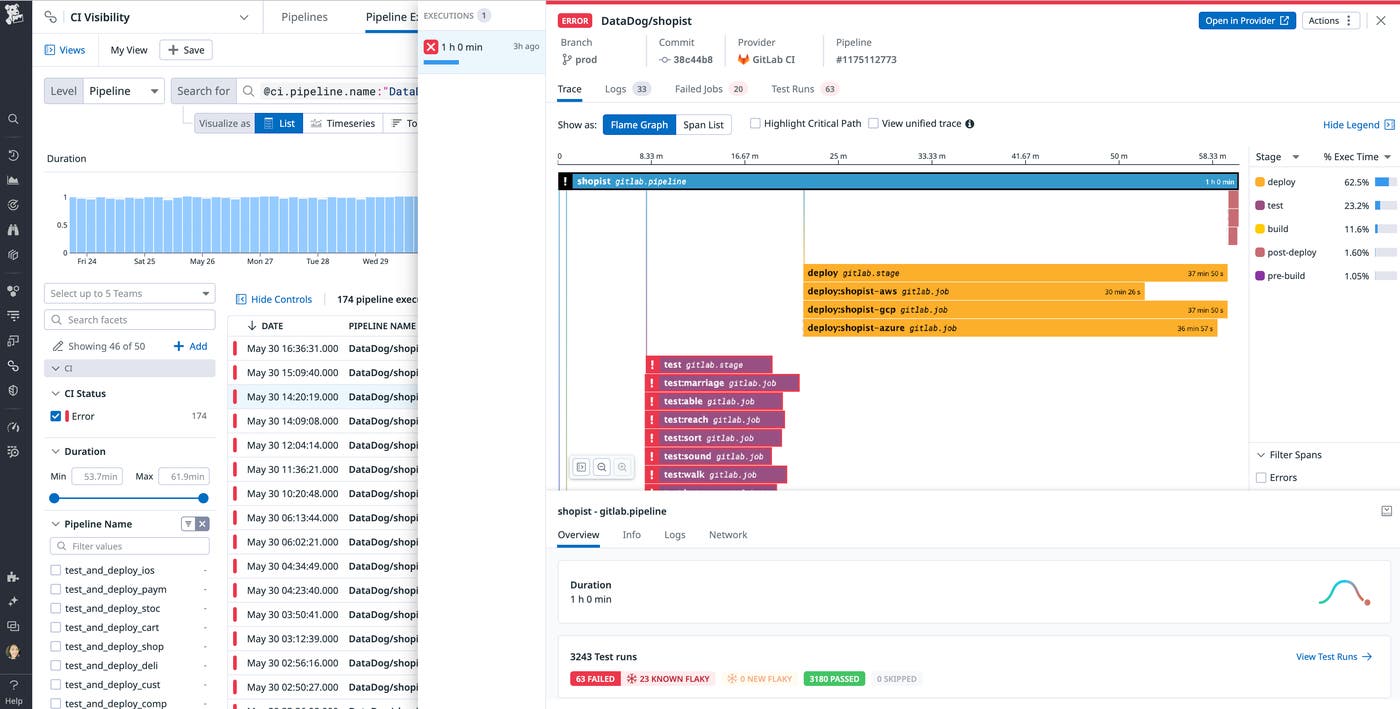
Similarly, because we’re using a Software Catalog entry as the source of truth for an isolated piece of runtime, we can link a service directly to pre-populated dashboards that aggregate deployments, surfacing any unintended service disruptions quickly and helping our users identify remediations if necessary.
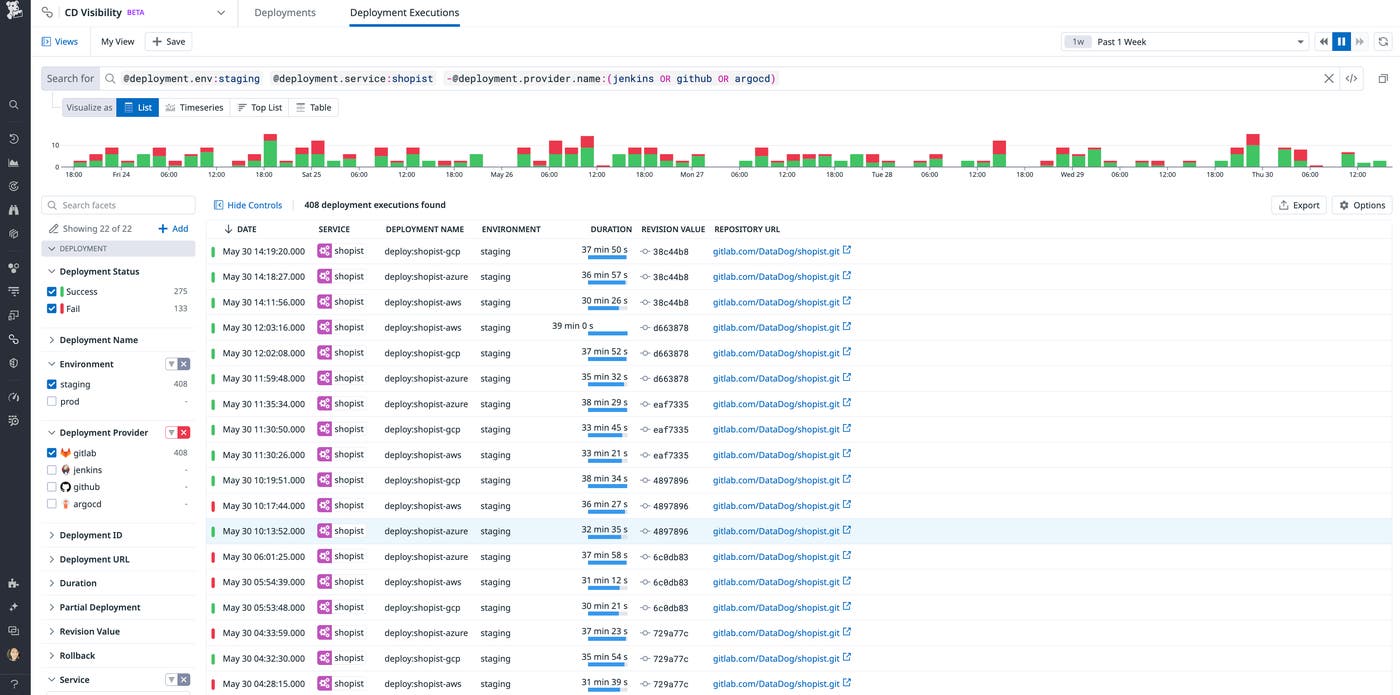
This means that Datadog engineers know at a glance the status of their change, what pipeline it was built in, when and where it was deployed, whether the deployment was successful, and more—all without leaving the application. Important information like what commit SHA is contained within an artifact or what branch an artifact was built from is maintained for our engineers through to deployment time.
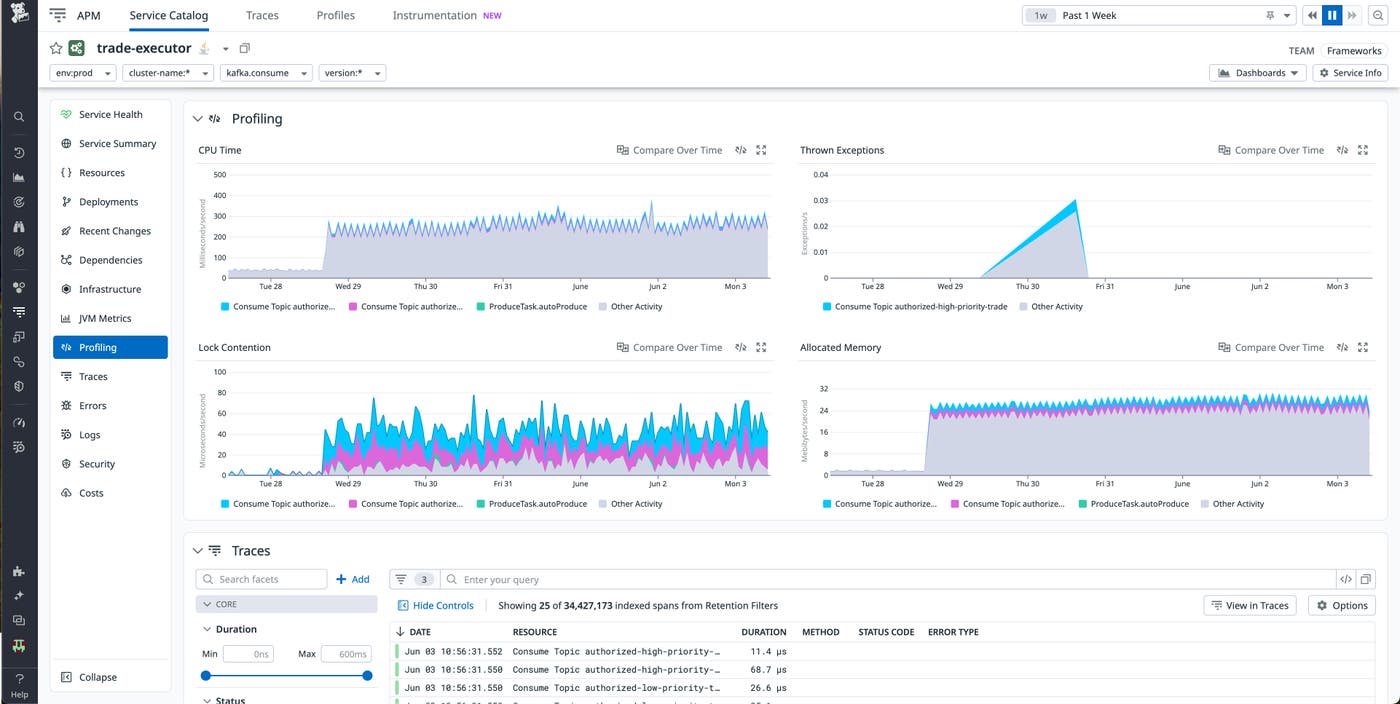
We’ve combined the management and observability workflows of our developers into a single pane of glass, with all of Datadog’s tooling at their disposal to see the impact of their changes in production. Developers can correlate the timing of deployments with their telemetry data to see whether code had the desired effect: improving performance, saving money on cloud cost, or closing a CVE.
Our culture of continuous iteration and improvement at Datadog means our developers ship hundreds of changes a day across thousands of services. As platform owners on internal Infrastructure teams, we know that tracking cycle time and the frequency of releases is an effective way to make sure our developers maintain a robust cadence of deployments without regressing on our tier zero priorities of reliability and deployment safety.
That’s why we’re working directly with Datadog’s product teams on our new DORA tracking metrics feature, currently in public beta. DORA metrics track four key measures: deployment frequency, lead time for changes, change failure rate, and time to restore service.
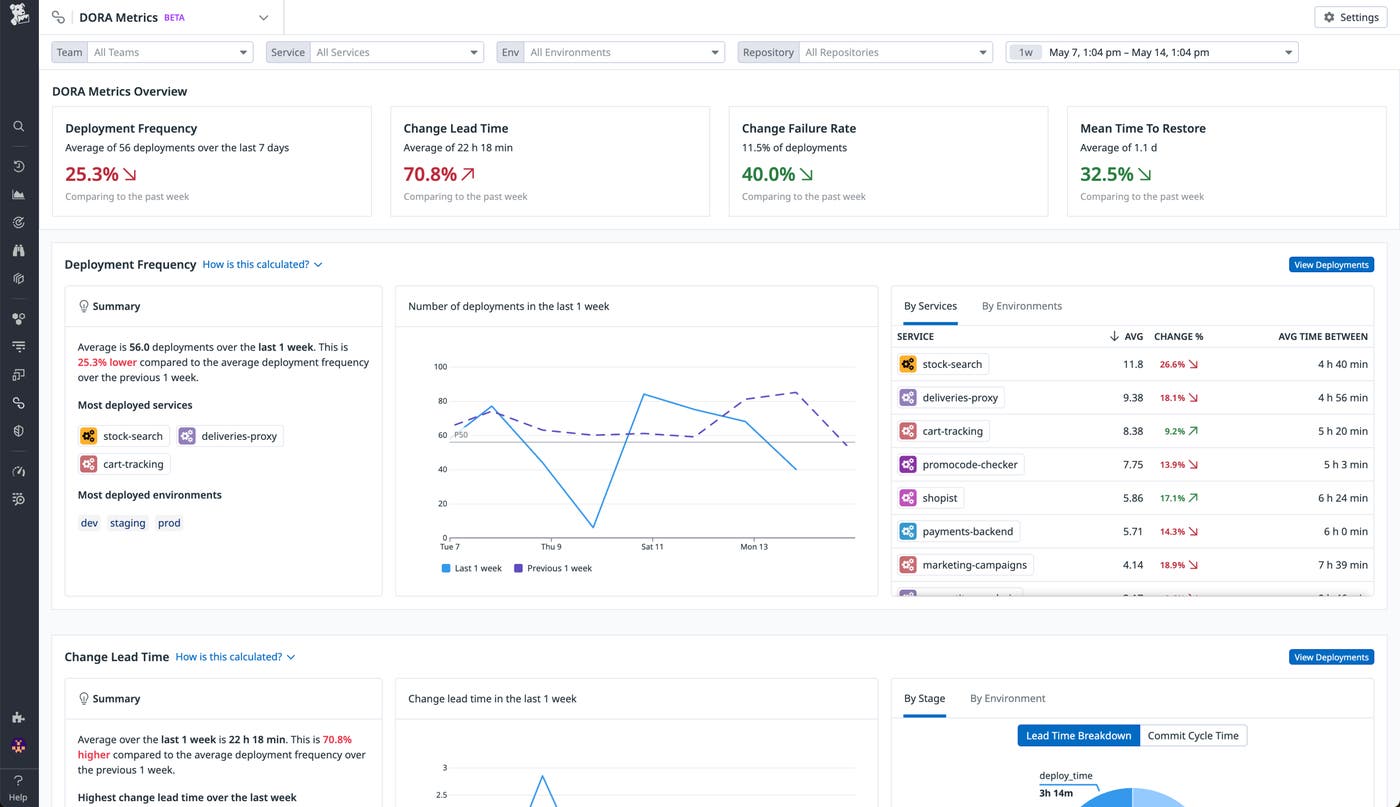
Viewing these trendlines holistically and across individual services, applications, or departments gives our Infrastructure teams important insights into the developer experience at Datadog. If we see deployment frequency or change lead time slowing, we can drill down to determine whether this is impacting a specific subset of our users—releases in a specific repository, for example—or all users, and take the appropriate action. It also allows us to set a baseline target that we can use to drive our planning as we strive to continually improve the experience of our customers.
## A holistic approach to service management
Our work on Conductor and internal service delivery collapses the management and observability planes of our ecosystem, dramatically improving developer experience as well as business critical outcomes like the frequency and reliability of service delivery. By embedding service delivery into Datadog’s Software Catalog and monitoring the performance of our pipelines using CI and CD Visibility, we can provide our engineers with a single pane of glass for software delivery and minimize the context switching and leaky abstractions that hinder focus and quality.
Check out our documentation to learn more about streamlining your software delivery with the Software Catalog and CI Visibility. If you’re new to Datadog, get started with a 14-day free trial.
此内容由惯性聚合(RSS阅读器)自动聚合整理,仅供阅读参考。 原文来自 — 版权归原作者所有。