





When building applications that ingest and analyze millions of data points per second, developers as a rule require good observability data on workload performance. That principle certainly holds true for us on the Cloud SIEM team, where delivering a highly reliable and responsive product to our customers is central to our day-to-day operations. Whether we pursue this goal by detecting and resolving bottlenecks or by measuring the impact of code updates on performance, we depend heavily on the observability data provided by Datadog’s Continuous Profiler. With only a couple of lines of code needed to set it up, the product offers amazing visibility into the performance of our services in production. It is much better than local profiling or benchmarking because it shows how the code performs in real-world conditions, which are always challenging to reproduce in unit tests.
However, when classes and methods are widely reused across the codebase, it can sometimes be hard to determine only from profiles, in a granular way, what is consuming the most resources. For example, in Cloud SIEM’s backend, the same methods are called regardless of the customer owning the log being processed. Under circumstances such as these when methods are shared, profiles by default cannot help you detect when function calls originating from a particular context are consuming a disproportionate amount of resources and therefore require isolation.
To surface these kinds of details and unlock the next level of Continuous Profiler’s potential, custom context attributes are extremely useful. They enable software engineers to label their code with additional runtime data, which is then included in the analytics computed by the profiler and made visible in Datadog.
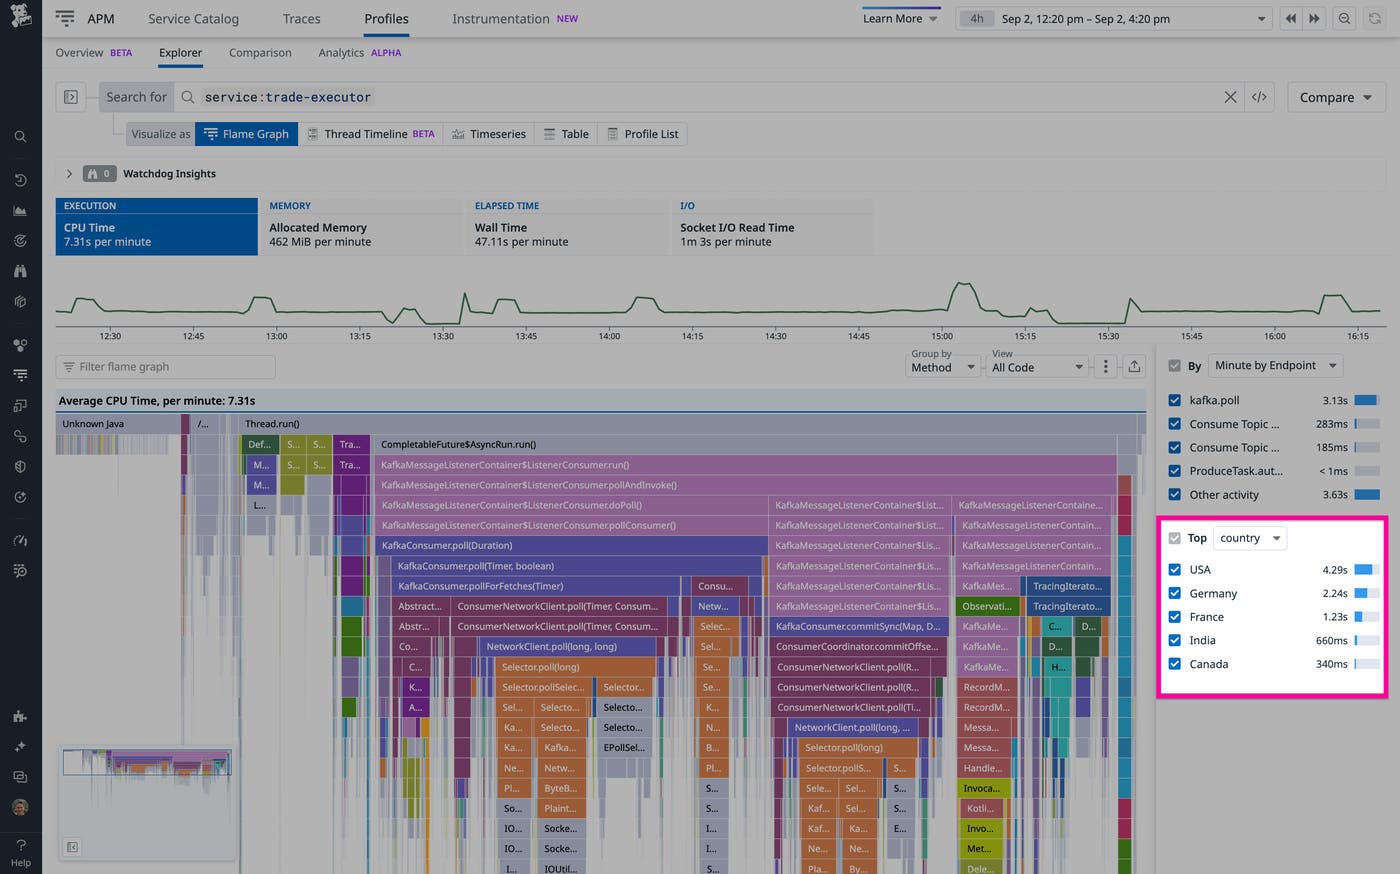
This post describes how the Cloud SIEM team uses custom context attributes to enrich profiles with business-logic data and thus make profiles even more actionable. First, it provides key details about how Cloud SIEM’s detection engine works and then explains how Cloud SIEM backend engineers use custom context attributes to help identify performance bottlenecks. Next, it covers how custom context attributes are also useful to investigate and mitigate incidents. Finally we’ll look at how you can add custom profiling attributes to your own code.
To understand how we use context attributes in Continuous Profiler to help us with our troubleshooting, you first need to understand some basic details about how Datadog Cloud SIEM’s detection engine works. The first thing to know is that the engine consists of a MapReduce system, a very common architecture used for analyzing data in a distributed way.
Within this MapReduce system, the mapper receives customers’ logs, filters out the irrelevant ones, and then routes them by using Kafka to the right reducer node based on the matched rule and its log grouping fields (e.g., “user ID,” “host,” or “client IP”). This routing mechanism ensures that all logs matched by a given rule and grouped by a given field are received by the same reducer node, which can then aggregate them and trigger alerts based on the rule definition.
The reducer component, for its part, spends most of its CPU time performing two main tasks:
Serializing and deserializing its state, which is composed mostly of log samples and “in-flight” security signals.
Analyzing logs, which could entail a simple log count or a more advanced computation, such as a sum or a maximum based on specific log field values.
A second key point to understand about the Cloud SIEM engine is that it triggers alerts via different detection methods. The most common detection method is threshold-based detection, which means that an alert is triggered when a given log count is exceeded. Another detection method is anomaly detection, which occurs when there’s a spike in error logs. Yet another detection method is “impossible travel” detection, which occurs when a user connects from two different locations that are too far from each other for the user to have traveled between them. (This behavior triggers an alert because it is interpreted to be a sign of an account takeover.)
Despite their many differences, all our detection methods rely on a lot of shared Java code. These shared classes, in fact, appear as the largest resource consumers in our profiles. As a result, when we see that one of these shared classes is associated with a performance bottleneck, this information is neither surprising nor specific enough to be of much use in our troubleshooting. Continuous Profiler by default cannot drill down into this information to show us which detection methods within these shared classes consume the most resources.
Fortunately, with custom context attributes, data collected by the profiler can be enriched with detection method names. This technique allows us to clearly see which detection methods consume the most resources—helping us better direct our efforts to uncover the root causes behind performance bottlenecks. Additionally, context attributes help us with our serialization code to get an approximation of the state size, and having this data sorted by detection method is extremely useful to prioritize our efforts when trying to improve our data storage. The state size is the main driver of memory consumption and disk pressure, and therefore it can hinder the reliability of our services if it grows uncontrollably.
The takeaway here is that our various detection methods are at the core of our business logic, but Continuous Profiler doesn’t surface this information by default. Being able to include these detection methods within profiling data via custom context attributes makes all the difference in allowing us to diagnose performance bottlenecks and implement performance improvements.
Another use case for custom context attributes also involves using them to label specific profiling data associated with detection rules—but as a way to investigate traffic surges during incidents.
To understand how this technique works, you first need to know that some of our incidents are triggered by a single detection rule. The culprit in this case is typically a huge burst of logs—more than our autoscaling system can keep up with—that all match the same rule. When this sort of event occurs, our reducer sometimes starts to lag because the rule generates very large states. Under these conditions, the reducer cannot process new logs because it spends too much time serializing and deserializing that state. If we start to experience this type of lag because of a single detection rule, we redirect its traffic to a dedicated Kafka topic and process it with a different Kubernetes deployment of the reducer. By doing this, we prevent a single rule from delaying all the security alerts of a customer.
In such a situation, it’s important to identify the offending rule quickly and mitigate the incident as fast as possible. But how can we isolate traffic from a noisy rule if we don’t know which one it is?
Profiling contexts are extremely helpful here: we can add the rule ID as a custom attribute, making it easy to identify any suspicious rule in terms of resource consumption. And while profiles from the previous 5 to 10 minutes are not perfectly accurate (profiling, like any other statistical analysis, needs a lot of data points), they are usually enough to spot an outlier. By the time the on-call engineer is paged and opens their laptop, enough time has passed for profiles to be usable to investigate.
As an illustration of this strategy, let’s look at a real-world incident we faced in which we solved a problem with the help of custom context attributes. In this incident, our team got paged because some of our Kafka partitions were lagging. This meant that at least one detection rule for a particular customer was being processed with delays. There was also a mild increase in CPU, and we suspected a large state was causing issues. However, the custom metrics in our dashboard did not allow us to determine whether a single rule was causing the problem.
We then went to Continuous Profiler and used the “focus” feature to visualize only serialization classes. Because we had previously defined the rule ID as a custom context attribute, the profiler showed us how much CPU time each rule ID was consuming within those classes. The offending rule immediately appeared as an outlier. We then used that rule’s associated rule ID to further filter the profiles and discovered that a specific serialization method was taking more CPU time than we would have normally expected. Based on the code within this method, we understood which specific part of the state grew too large, so we improved our data structure to trim it down.
Of course, we could have extracted the information we need by other means, such as by using custom metrics or APM tracing, but this method would have taken longer to implement and might not have been as accurate. The profiler was already running within our service, and adding custom attributes to make it usable to investigate incidents was a no-brainer.
Now, let’s see how to implement custom context attributes.
Custom context attributes are available for services in Java and Go. In Java, they can be defined via a try-with-resources block:
class ReducerProcessor {
static final ProfilingContextAttribute DETECTION_METHOD =
Profiling.get().createContextAttribute("detectionMethod");
static final ProfilingContextAttribute RULE_ID =
Profiling.get().createContextAttribute("ruleId");
// ...
public Result processLog(Log log) {
var rule = log.getMatchedDetectionRule();
try (var profilingScope = Profiling.get().newScope()) {
profilingScope.setContextValue(DETECTION_METHOD, rule.getDetectionMethod());
profilingScope.setContextValue(RULE_ID, rule.getRuleId());
// ...
}
}
}
It is possible to pass the profilingScope variable as an argument to other methods, but it must not be passed across threads. For performance reasons, the library itself doesn’t determine whether the variable is passed across threads, so developers need to be careful: if a profiling scope is shared between threads, the profile tagging would become indeterministic, leading to incorrect profiling metrics per custom context attribute. All the attribute names also need to be passed as an argument to the Java process.
Attribute values are stored in a per-thread buffer with 2^16 slots. We need to pay attention to cardinality (otherwise some contexts would be dropped), but as the limit is per-thread and our computation is sharded, the buffer size is enough for our needs.
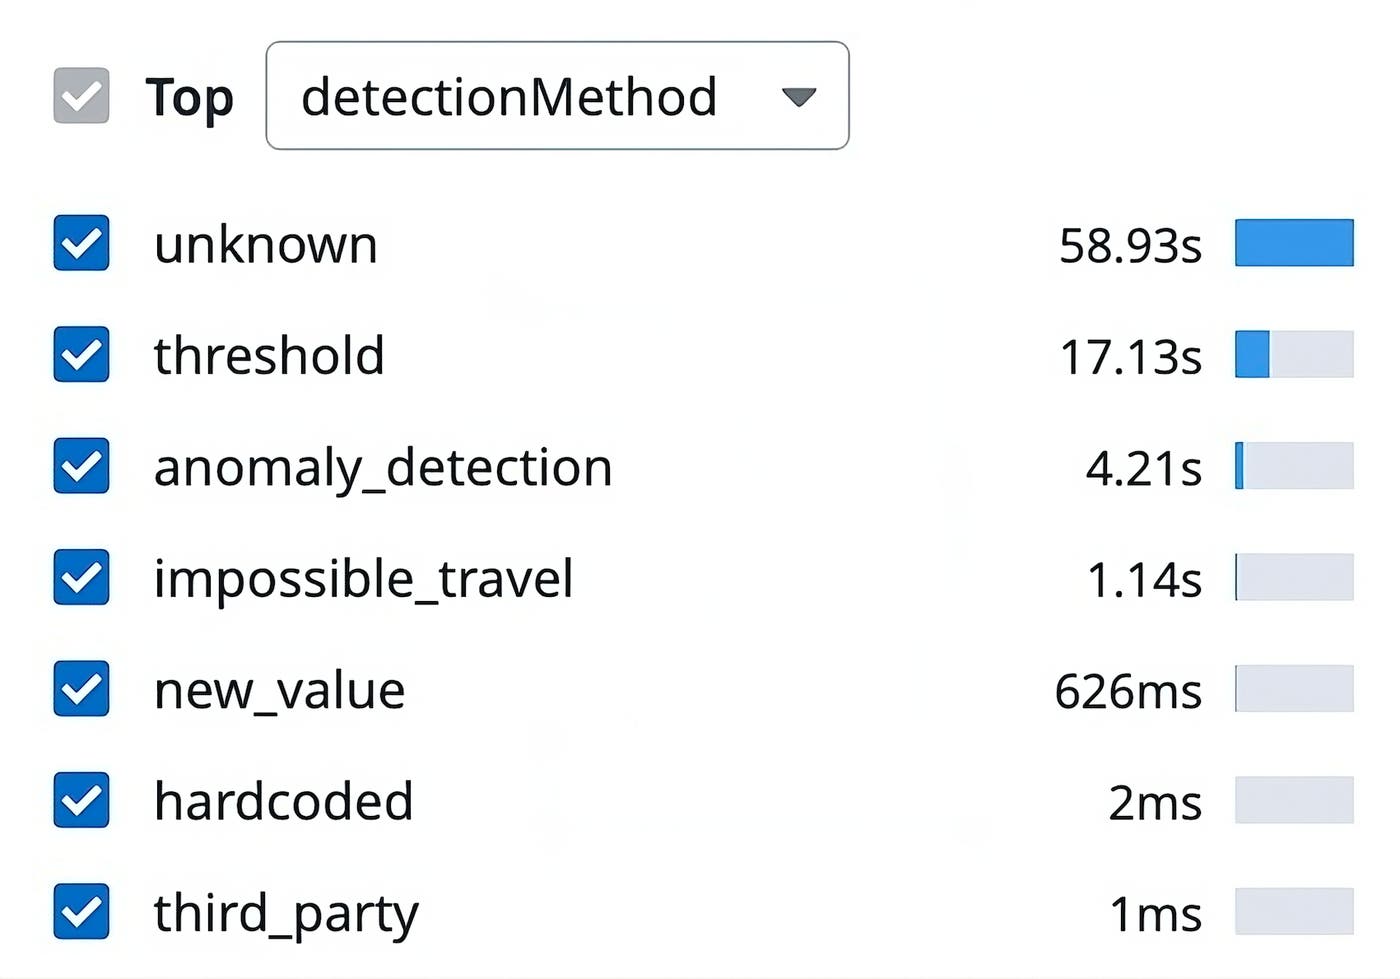
Once you have added your custom context attributes to your code, you can use them to filter profiles, as shown in the following screenshot:
To get the most out of your attributes, remember also that the profiler integrates well with APM tracing. Specifically, it is possible to filter profiles by endpoint, which is based on the resource.name tag of APM spans. On Java services, it is also possible to filter by trace operation name. And as with custom context attributes, you can associate these resource name and trace operation name fields with business logic information to help you home in on the root causes of performance issues.
Datadog Continuous Profiler is a highly useful tool that, with almost no overhead, gives you visibility into the performance of your applications in production at the code level. In certain circumstances, however—such as when the same classes in your codebase are shared among widely different contexts—seeing the execution time spent on each method or line of code might not give you the detail you need. For these situations, custom context attributes allow you to label profiling data so that you can see the specific context (such as the detection method, user ID, or location) in which a method or line of code has executed. Custom context attributes are very easy to implement, and for us on the Cloud SIEM team, they have allowed us to greatly expand Continuous Profiler’s capabilities as a troubleshooting tool while avoiding complex alternatives such as implementing custom metrics via code changes.
For more information about Datadog Continuous Profiler, see our documentation. And if you’re not yet a Datadog customer, you can sign up for our 14-day free trial.
此内容由惯性聚合(RSS阅读器)自动聚合整理,仅供阅读参考。 原文来自 — 版权归原作者所有。