



Coding agents such as Claude Code and Codex can handle much of the actual coding work involved in AI agent development, but they aren’t as well-equipped for other key tasks, such as setting up experiments and evaluations, analyzing errors and experiment results, and creating datasets. These activities require some level of human judgment, which makes the full AI agent development workflow hard to automate. While teams often develop and maintain custom scripts, skills, and runbooks to help them in these efforts, engineers still spend hours on manual work.
Bits Evals, available in Preview, is a set of agentic features that handles the repetitive parts of the agent development loop while keeping engineers in control of the decisions that matter. This helps your team move from a production failure to a validated fix and a shipped improvement in hours, not days. For example, instead of spending hours combing through traces to find examples to add to your offline evals, Bits Evals can do the first-pass error analysis for you. Based on online evals or customer input like thumbs up or down, it generates candidate dataset records and evaluators, while leaving the choice of which ones to pull into your experiments up to you.
In this post, we’ll outline the full agent improvement workflow, then look at how Bits Evals supports this loop by helping you:
Capture user feedback directly in traces
Analyze production failures with structured root cause analysis
Generate evaluators and interpret experiments
Most AI engineering teams already follow some version of the same operational loop for building and improving AI agents. Teams collect signals from users, investigate failures in production traces, make changes to prompts or workflows, validate those changes with evaluations and experiments, and then monitor the results after deployment.
The challenge is that each step in this loop relies on different types of expertise (such as observability, eval design, experimentation, and deployment) and different toolsets. Production traces live in observability systems, evaluator logic often exists in custom scripts, and experiment analysis frequently depends on manual interpretation. As a result, teams spend significant time repeating operational work during every iteration of the loop.
For example, if end-user feedback lives in a different system than traces, there’s no direct connection between a user frustration signal and the spans that caused it. Analyzing errors means manually combing through traces with no structured way to surface what’s actually failing. Evaluators are often written from scratch based on intuition instead of production behavior, and experiment results require manual interpretation. This same workflow gets kicked off manually after every deployment, and the cycle begins again.
Bits Evals automates many of the repeatable steps in this workflow while preserving the human checkpoints that require engineering judgment. Engineers still decide which failures are important, which examples belong in a golden dataset, and whether a candidate build is ready for production. Bits runs the analysis so engineers can spend their time on decisions, not on gathering the inputs to make them.
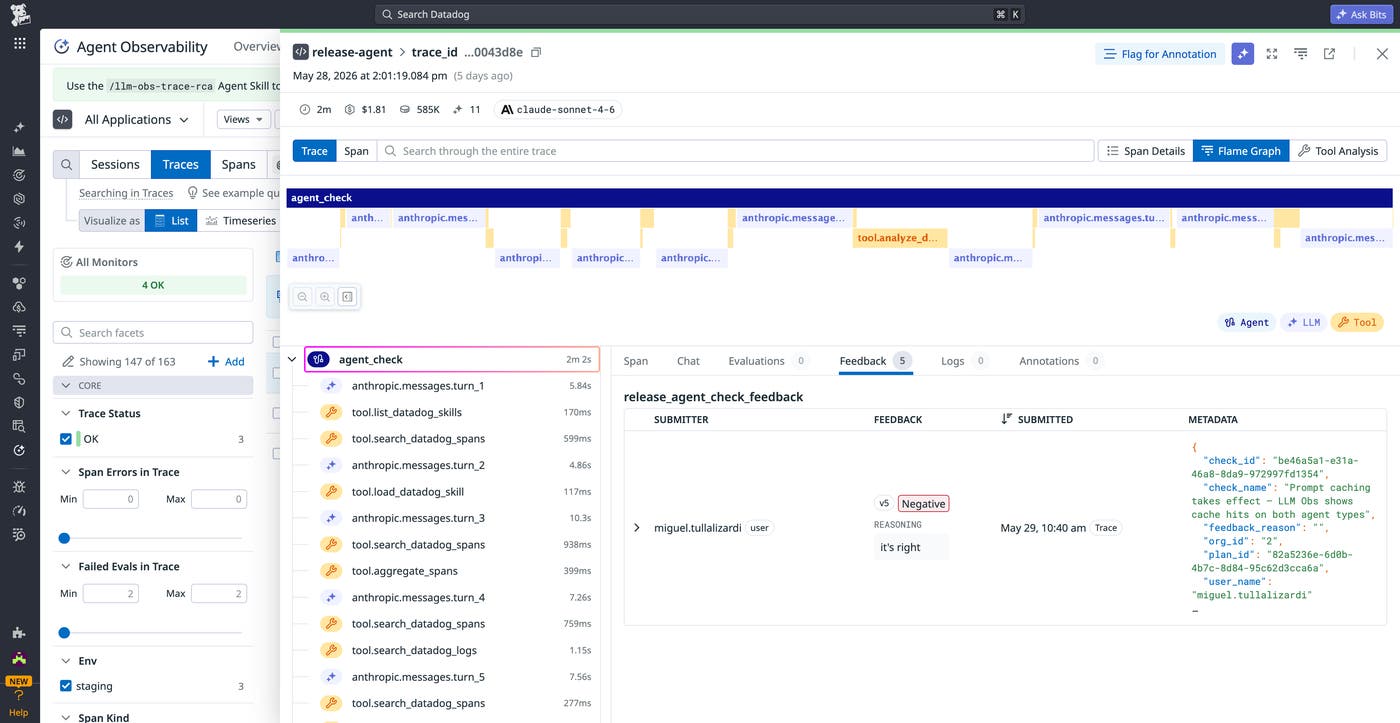
Reliable evaluation starts with understanding what users actually experienced. Production traces can capture request flows, tool calls, and latency, but they do not always indicate whether the interaction was successful from the user’s perspective. For example, a support assistant may complete every tool call successfully while still returning an unhelpful answer. Without explicit user feedback, that interaction may appear operationally healthy even though it represents a quality failure. Adding user feedback to traces helps Bits Evals identify those cases earlier.
Teams can capture thumbs up/down feedback and structured user feedback events through the ddtrace SDK or the Agent Observability API, attaching them directly to Agent Observability traces as a first-class signal alongside operational telemetry and evaluation results. You can then query this feedback alongside spans, tool calls, and eval scores.
The ability to attach user feedback to traces as a signal is what makes downstream Bits Evals workflows more accurate. Without this signal, error analysis is limited to operational signals like latency and tool errors, which show that something went wrong but not whether the interaction satisfied the user’s intent. User feedback closes that gap, giving Bits Evals the input it needs to classify failures and generate evaluators that reflect real user outcomes rather than proxy metrics.
Once production feedback and online evaluations are attached to traces, Bits Evals can perform structured analysis on failing interactions. Instead of manually reviewing long trace lists, teams can use Bits Evals to classify sessions, group failures, and identify likely root causes.
The /llm-obs-session-classify Claude skill included in Bits Evals evaluates whether user intent was satisfied across an individual trace, a session, or a larger set of sessions associated with an application. To improve accuracy, the analysis combines multiple signal sources, including Agent Observability traces, data on user behavior from Datadog Real User Monitoring (RUM), Audit Trail events, and evaluation results where available. The skill returns a concise classification result—yes, partial, or no—with a one-sentence supporting reason. Engineers can also use verbose mode to get a markdown report that summarizes the failure patterns observed across sessions.
Teams can then use the /llm-obs-trace-rca Claude skill to perform root cause analysis on failing traces. The analysis produces a structured failure taxonomy that includes failure categories, supporting evidence from traces, and specific fix proposals grounded in the actual trace data. Rather than generating generic suggestions, the workflow analyzes prompt structure, routing logic, tool arguments, and system behavior captured in the trace. And when you run this skill inside Claude Code with access to the application codebase, it can also identify relevant source files and propose concrete code diffs tied to the observed failures.
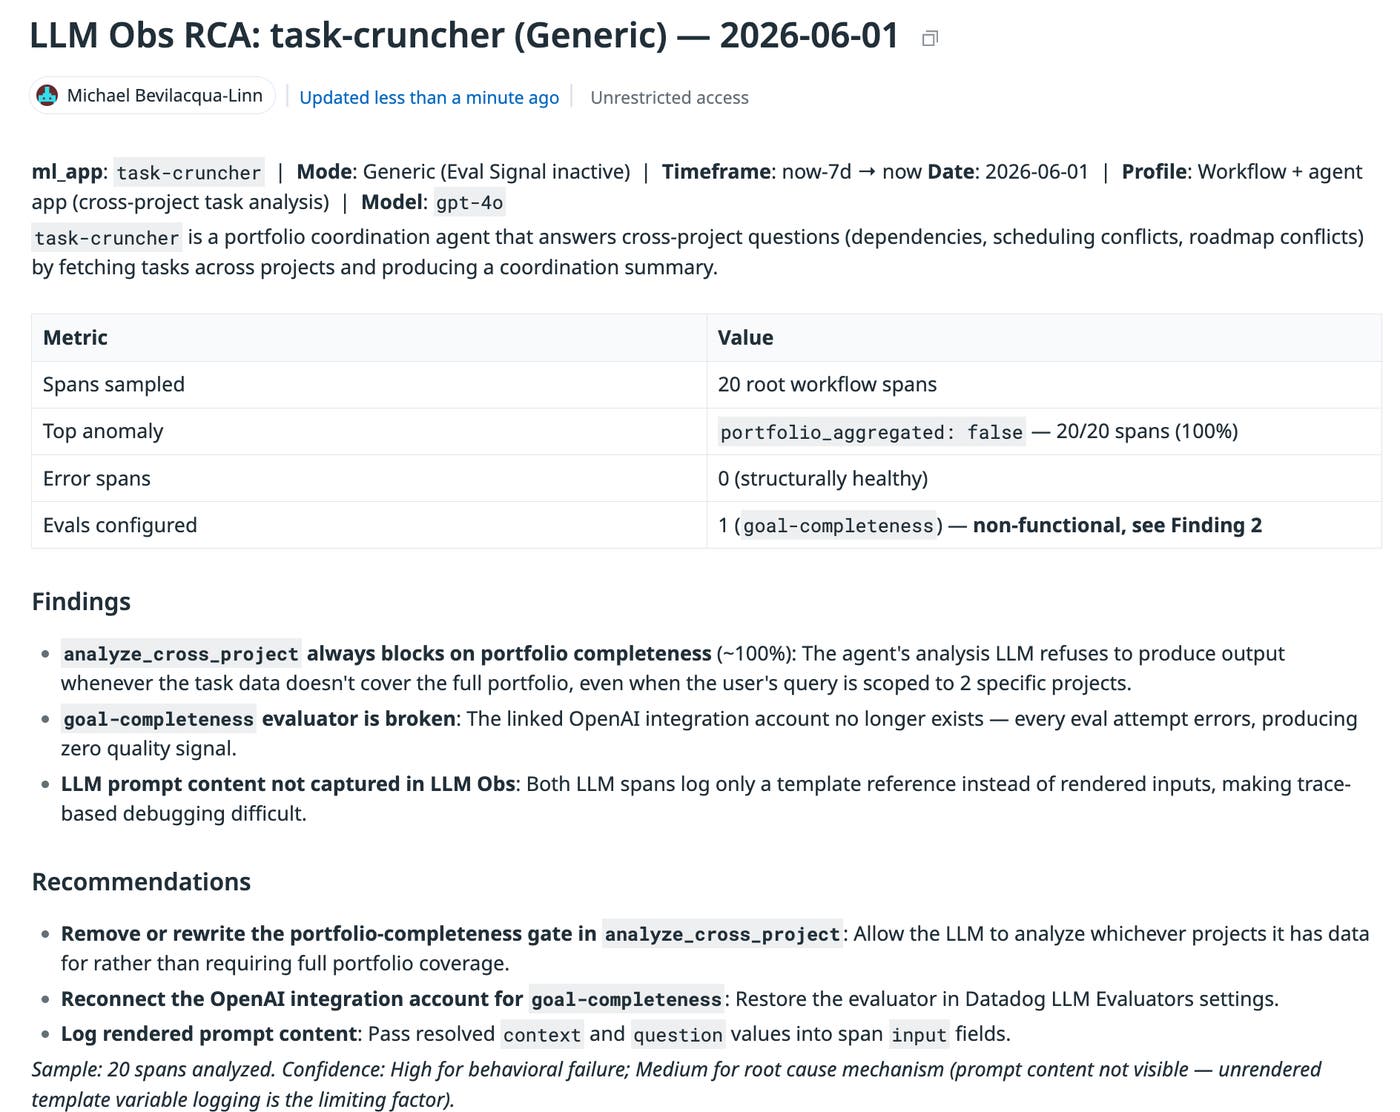
Even with automated analysis, human review remains important. Engineers still decide which failure groups represent high-priority issues and which traces should become part of the evaluation dataset.
These workflows are powered by the Agent Observability MCP Server, which gives coding agents direct access to traces, evaluations, and experiment data from within the development environment. Instead of switching between dashboards, notebooks, and local tooling, engineers can investigate failures directly from the environments where they build and debug agents.
After identifying failure patterns, teams need a reliable way to validate fixes before deployment. Writing evaluators and curating datasets manually can become a bottleneck, especially when teams are iterating quickly on prompts, retrieval pipelines, or agent workflows.
Bits Evals helps speed up and improve these workflows by generating evaluator candidates directly from production traces and root cause analysis reports. The /llm-obs-eval-bootstrap Claude skill analyzes production failures and proposes evaluators that align with the observed failure modes.
You can use this skill to generate evaluators in several formats depending on your workflow, including as:
Python LLMJudge or BaseEvaluator classes ready for integration into experiment harnesses or CI/CD systems
JSON specifications for manual implementation
Online judges published directly into Datadog
Because the generated evaluators are based on production behavior instead of hypothetical edge cases, teams can focus experiments on issues that are already affecting users. This reduces the amount of manual setup required before running offline evaluations.
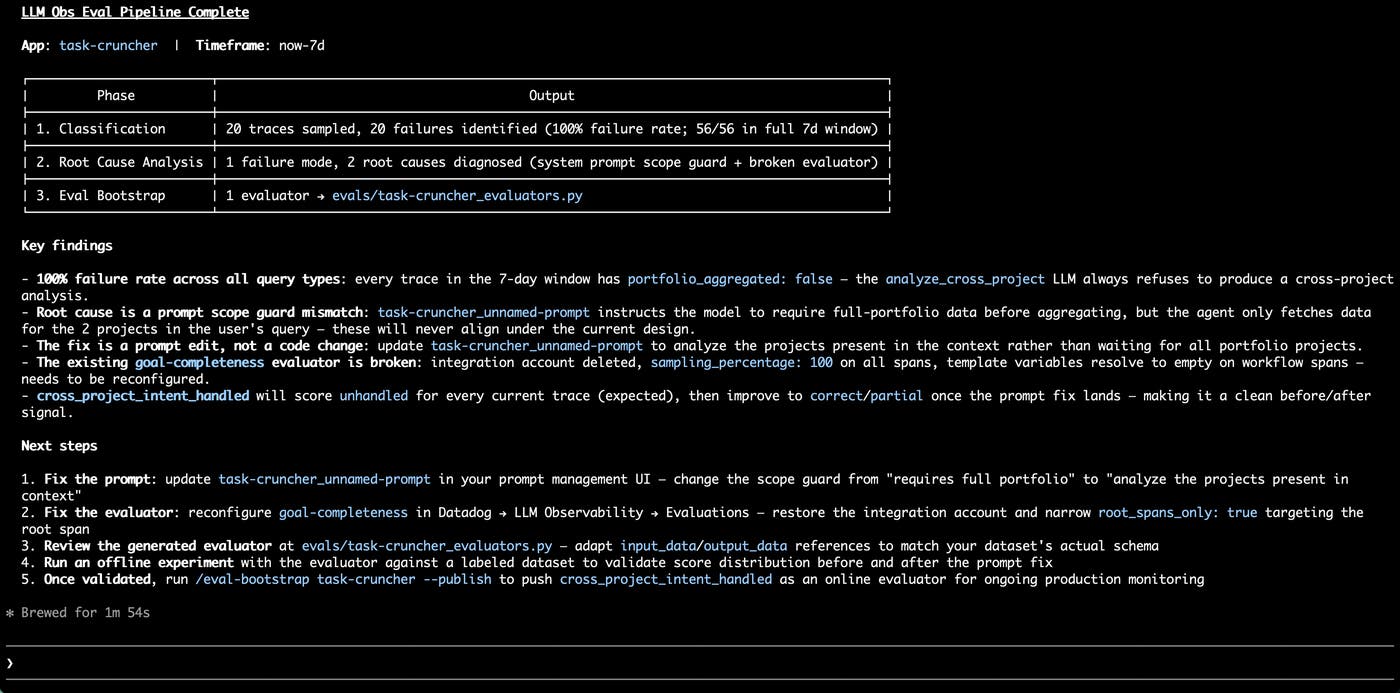
The final, hard judgment calls still take place via human review: Engineers evaluate dataset quality, remove noisy examples, and validate evaluator logic before it runs.
Once experiments run, you can use the /llm-obs-experiment-analyzer Claude skill to help interpret the results. This skill compares baseline and candidate experiments, highlights regressions and improvements, and summarizes where the candidate system underperformed.
This analysis helps make deployment decisions more concrete. Instead of manually comparing metrics across dashboards and notebooks, teams receive a structured summary of what changed and whether the candidate appears ready for production rollout.
After changes are deployed, teams can use Agent Observability to monitor production traces, collect feedback, and identify new failure modes as usage patterns evolve—going back to the first step of the AI agent development loop as new signals emerge. Over time, this feedback loop helps teams refine their agents and evaluation coverage.
Bits Evals helps reduce the operational overhead involved in this cycle by connecting production signals, root cause analysis, evaluator generation, and experiment interpretation into a unified workflow built on Datadog Agent Observability.
To learn more, sign up for the Preview, and read our documentation on Agent Observability Claude Skills and the Agent Observability MCP Server. If you’re new to Datadog, you can sign up for a 14-day free trial.
此内容由惯性聚合(RSS阅读器)自动聚合整理,仅供阅读参考。 原文来自 — 版权归原作者所有。