





Modern-day engineering teams rely on continuous integration and continuous delivery (CI/CD) providers, such as GitHub Actions, GitLab, and Jenkins to build automated pipelines and testing tools that enable them to commit and deploy application code faster and more frequently. However, improving the performance of CI/CD systems and troubleshooting failures can be challenging when teams within the same organization rely on different providers (with varying levels of visibility and terminology) and are unable to proactively maintain their pipelines and CI workflows.
In order to address these challenges, tools like CI Visibility help give teams shared context around CI/CD workflows. However, it can be difficult to leverage these tools to effectively troubleshoot pipelines and set up sustainable practices for the future. In this post, we’ll discuss the challenges of monitoring complex CI/CD systems and share strategies for how you can:
Effectively troubleshoot CI/CD issues
Alert on critical scenarios
Monitor CI/CD trends over time
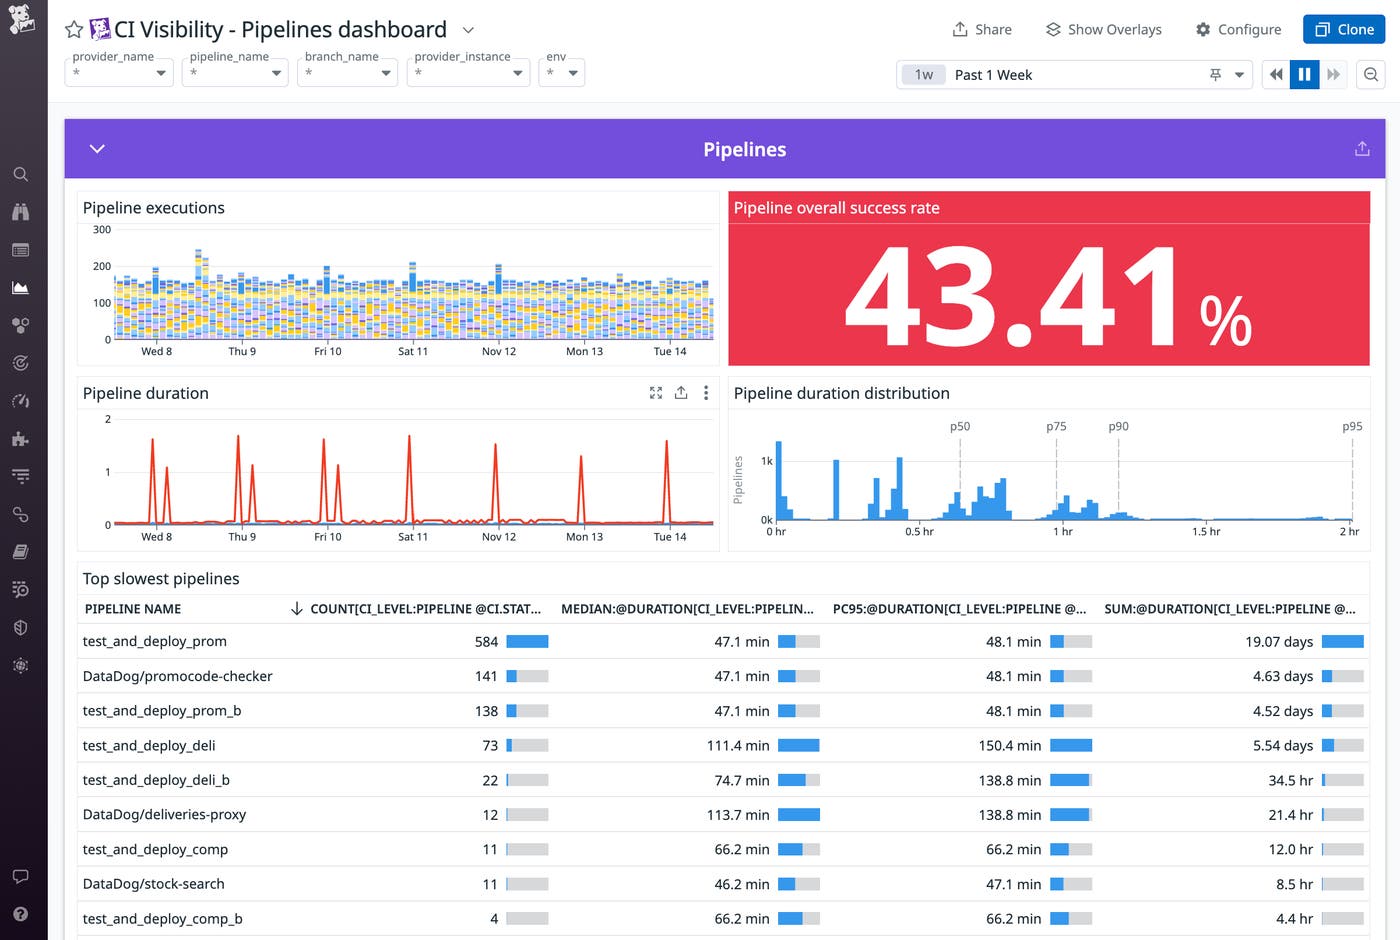
Even if developers are writing application code at high velocity, they need a healthy CI/CD system in order to consistently and efficiently deliver these changes to end users. But as engineering teams grow in size and maturity, it becomes increasingly difficult to manage and maintain the performance of CI/CD systems. Over time, the number and complexity of pipelines typically increase along with the size of test suites. Developers may also commit more frequently to ensure that issues are discovered quickly—and that these issues are smaller when they arise. All of these factors add stress to the CI/CD system and increase the risk of broken pipelines. When a pipeline breaks, it can completely halt deployments and force teams to troubleshoot by manually sifting through large volumes of CI provider logs and JSON exports. Without the proper observability tools in place, a development outage can last for days and delay the delivery of new features and capabilities to end users.
In order to address these hurdles, an increasing number of organizations have dedicated platform engineering teams that are responsible for implementing and operating CI/CD systems. Platform engineers are tasked with ensuring that CI/CD infrastructure is properly provisioned, improving pipeline performance, and configuring tools to help development teams operate efficiently. In order to do this, platform engineers can use dashboards, alerting, and more to monitor all of the components of their CI/CD system.
By implementing the following best practices, you can maintain the speed and reliability of your pipelines, even as you scale your teams and CI/CD workflows. You’ll also be able to monitor your pipelines over time and debug performance regressions.
When something goes wrong in your CI/CD system, having access to the proper dashboards can help you quickly identify and resolve issues. We’ll discuss how to guide your investigation with dashboards and how to visualize pipeline executions to home in on the root causes of issues.
Dashboards serve as the perfect launching point for investigating issues in your CI/CD system. We recommend creating a quick reference dashboard that provides a high-level overview of key components of your CI/CD system and common areas of failure.
When an issue arises, this dashboard should help you quickly narrow your investigation to your provider, infrastructure, pipelines, or other dependencies before you begin to troubleshoot deeper. For example, the following dashboard includes status checks for verifying system operations and provider metrics such as provider health (GitLab), code sync and intake events, API requests, and successful/finished CI jobs—all of which can highlight common areas of failure.
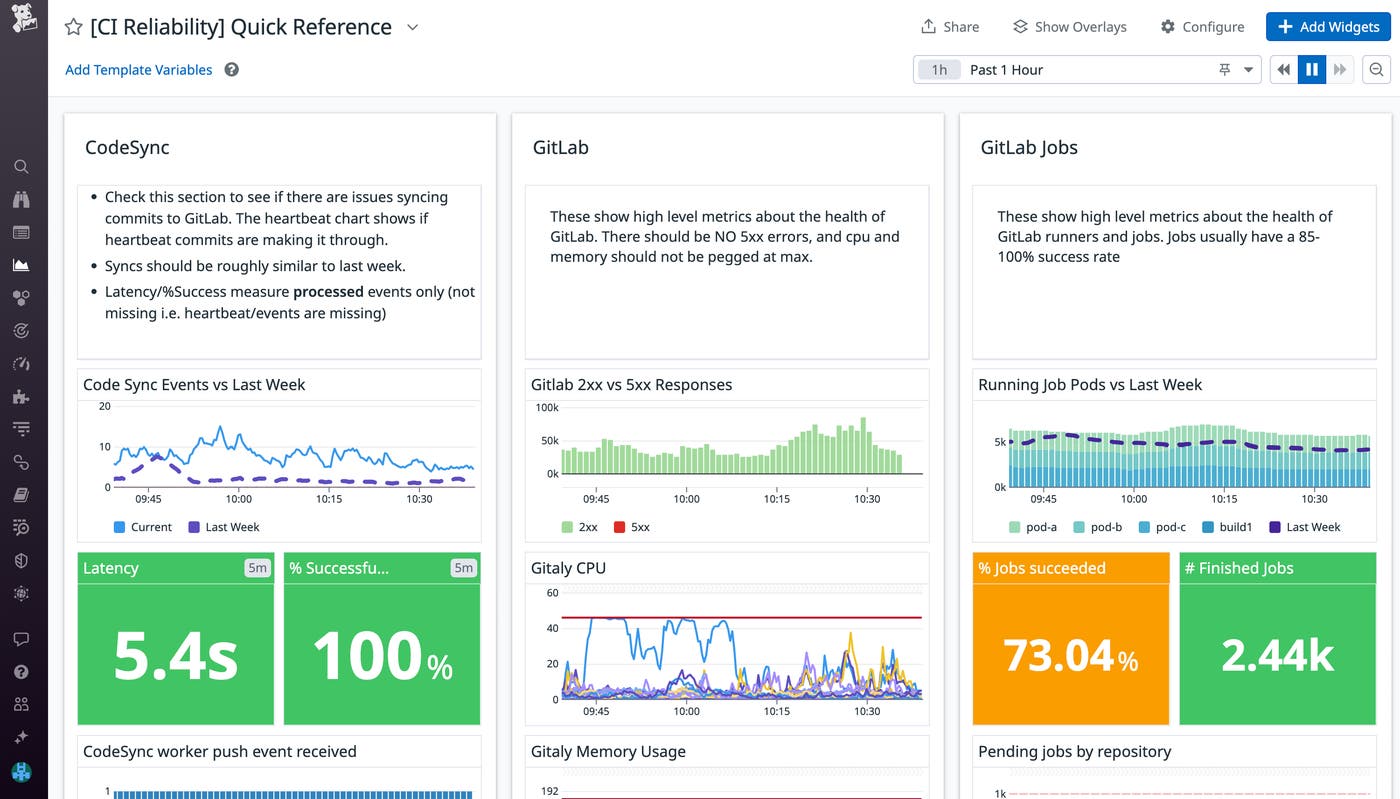
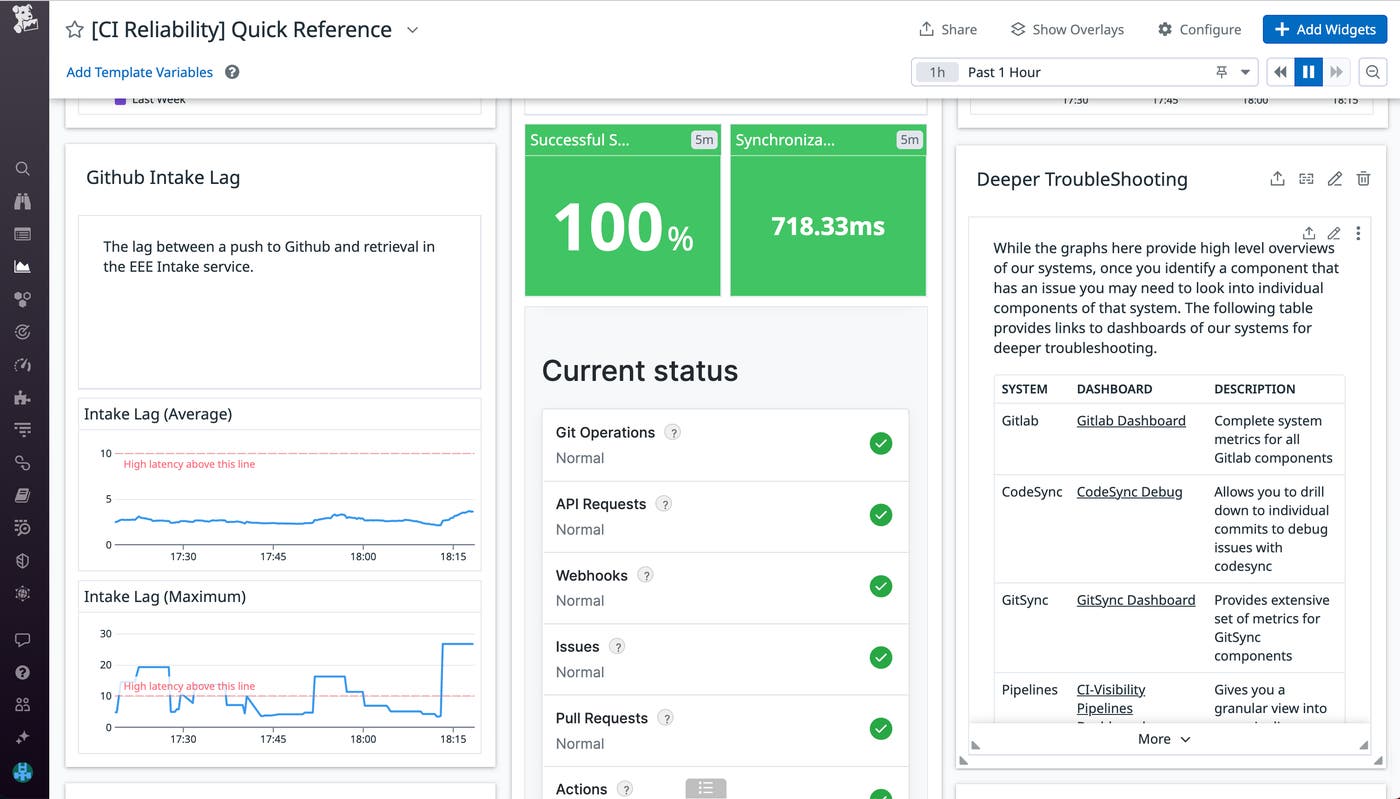
If the dashboard indicates that all API requests, Git operations, and other system checks are operational, and you’ve verified the health of your CI build instances and pods, your issue is likely linked to a code deployment rather than an issue with your CI provider or infrastructure. In this case, you’ll want to investigate the specific pipeline(s) that are facing issues. We recommend including links to more granular dashboards that are useful for guiding further investigations, as shown below. You should also include text that introduces each section (e.g., what the metrics are measuring and visual indicators to look out for) to help guide users across your organization who are less familiar with your CI/CD setup.
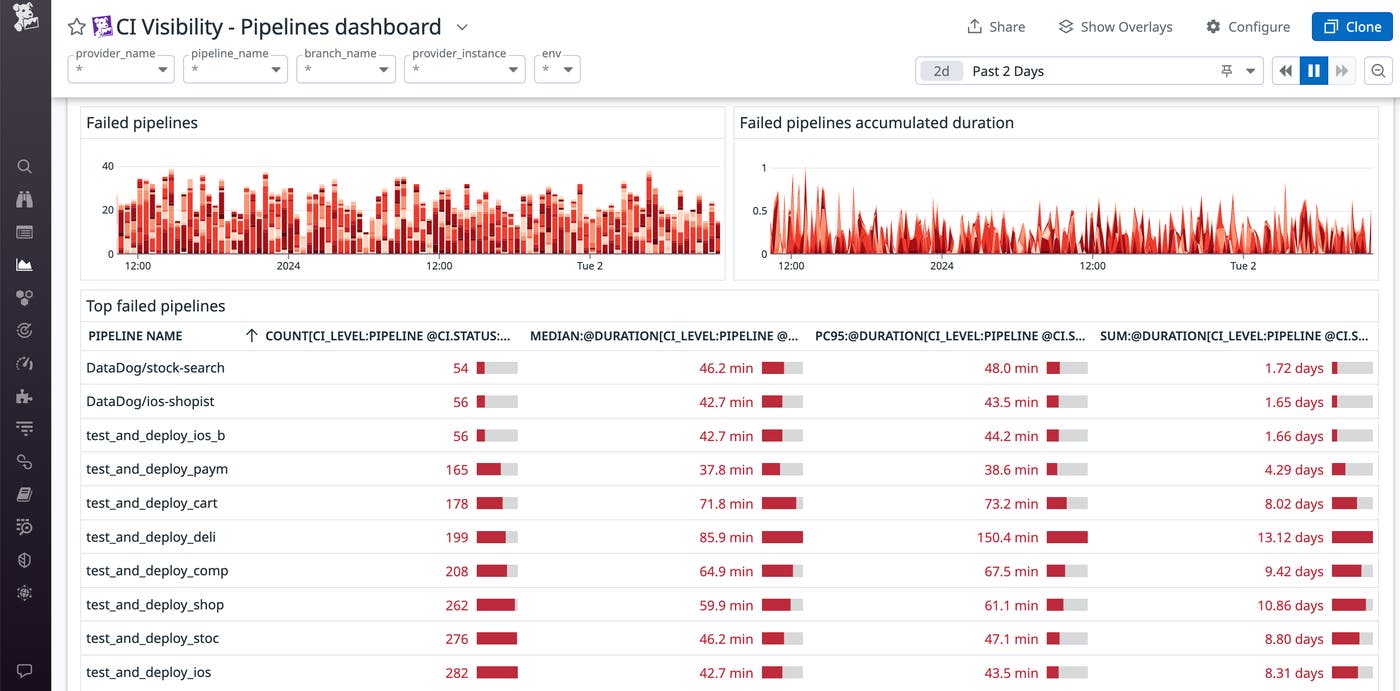
As teams across your organization update code more frequently and rely on an ever-increasing number of pipelines to test and deploy their changes, it’s important for product engineers and platform engineers to have shared access to dashboards that reflect the latest state of CI/CD pipelines. A CI/CD monitoring tool like Pipeline Visibility can provide out-of-the-box (OOTB) dashboards that serve as a good starting point for troubleshooting issues in your CI/CD workflows, especially as they scale.
In the screenshot below, Datadog’s OOTB pipelines dashboard gives you visibility into the top failed pipelines and shows you the extent to which they are slowing down your pipelines’ duration. If you select a pipeline, you can see its recent failed executions, which provide more granular context for troubleshooting the root cause of the issue.
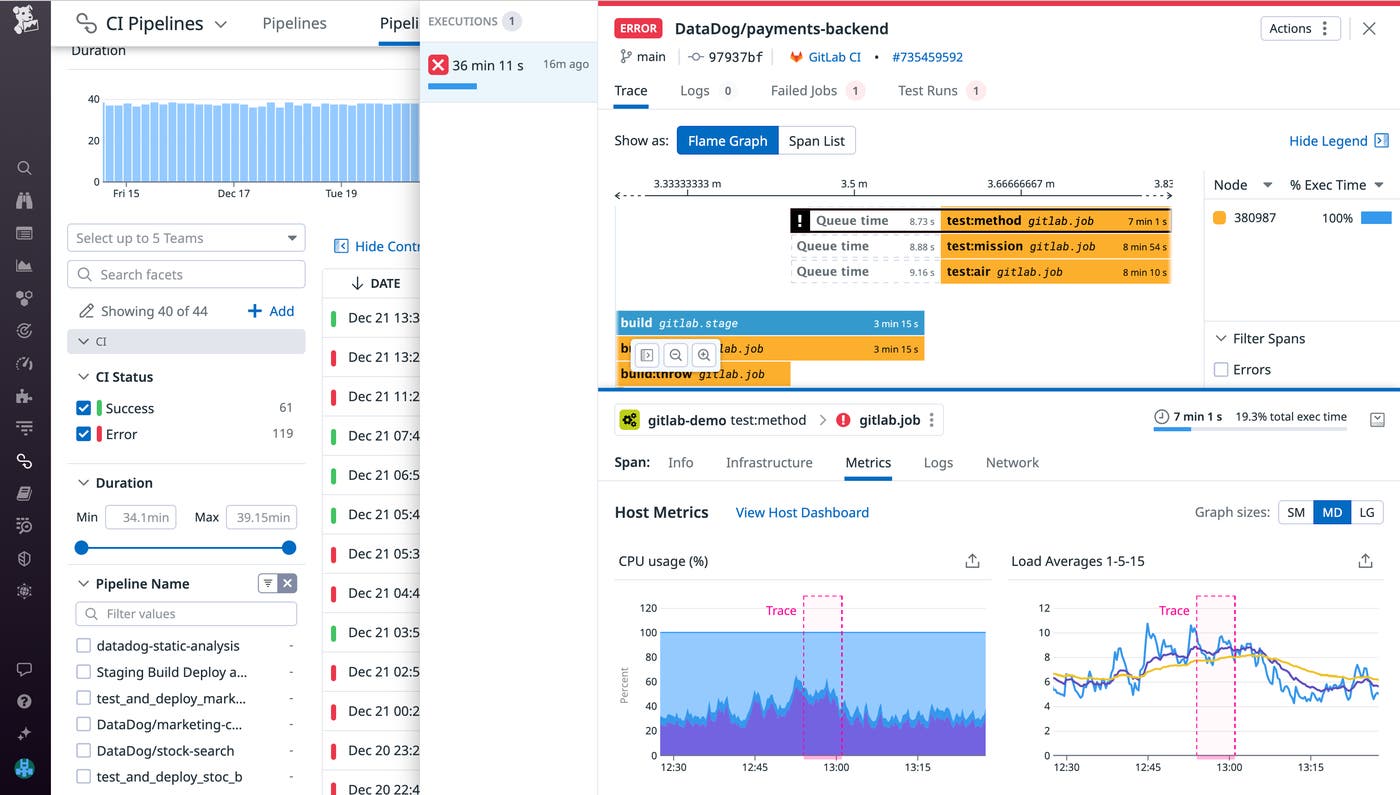
By inspecting a pipeline execution, you’ll be able to visualize the entire execution within a flame graph, where each job is represented as a span. This helps you contextualize the duration of each job within its request path and identify jobs with high latency or errors (which Datadog will highlight) that need to be optimized or remediated. In the example shown below, you can click on an individual GitLab job to see its underlying span tags and view details about the Git commit and CI provider-specific information. Investigating a particular span’s metrics can also give you insight into the underlying host’s CPU usage, load, network traffic, and other details about how the job was executed. These infrastructure metrics can give you clues into whether your job was impacted by heavy load on the server or a lack of available resources.
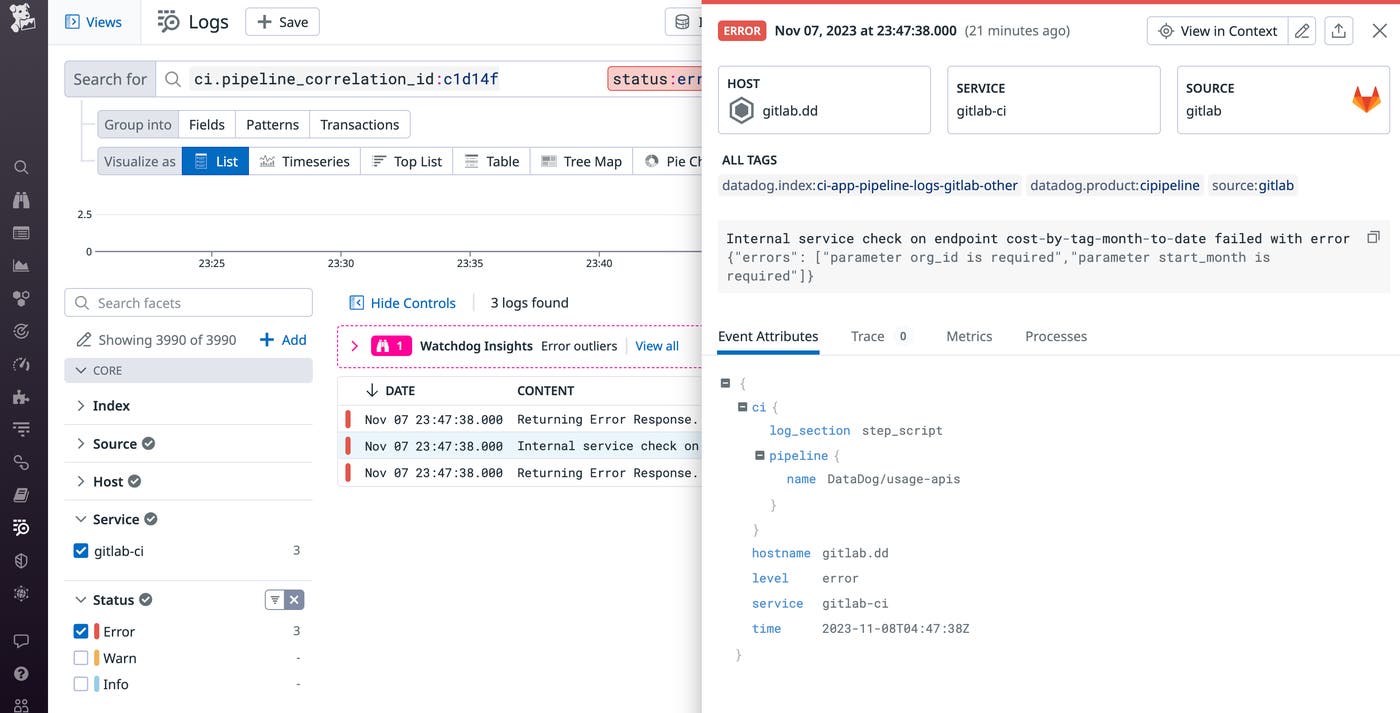
For deeper troubleshooting, you can quickly inspect relevant logs to see the step-by-step details of your execution. You can also filter for logs tagged with status:error to view the error messages for each failed job (e.g., internal server error codes or assertion errors that highlight an incorrect number of parameters entered). The following example indicates that a service check is executed without the required org_id and start_month parameters, causing the endpoint to return an error.
Up until now, we’ve walked through workflows to investigate issues. However, it’s impossible for platform engineers to spot CI/CD issues with dashboards alone. A robust network of automated monitors will enable you to detect CI/CD issues more quickly, which helps shorten development cycles and the time spent waiting for pipelines to be fixed.
To catch critical issues, you’ll need to configure a broad range of monitors that span your entire CI/CD system. For example, if you use GitLab as your CI provider, you’ll want to alert on the health of your GitLab infrastructure, along with any dependencies, such as Redis (for caching), Sidekiq (for job processing queues), and etcd (for storage of jobs running on Kubernetes pods).
Creating a wide range of monitors helps you avoid missing issues—and it can also shorten your time to resolution. For example, GitLab will periodically check for orphaned pods and delete them via a pod cleanup application that runs inside your Kubernetes cluster. If, for any reason, the request is unable to succeed (e.g., due to issues communicating with Kubernetes API, or if a runner is redeployed before the cleanup process can finish), it can result in orphaned pods that continue to consume resources which may slow down other GitLab jobs and cause pipeline slowdowns. A monitor that specifically tracks this issue will be more actionable than a monitor that simply notifies you to a general slowdown in your pipeline.
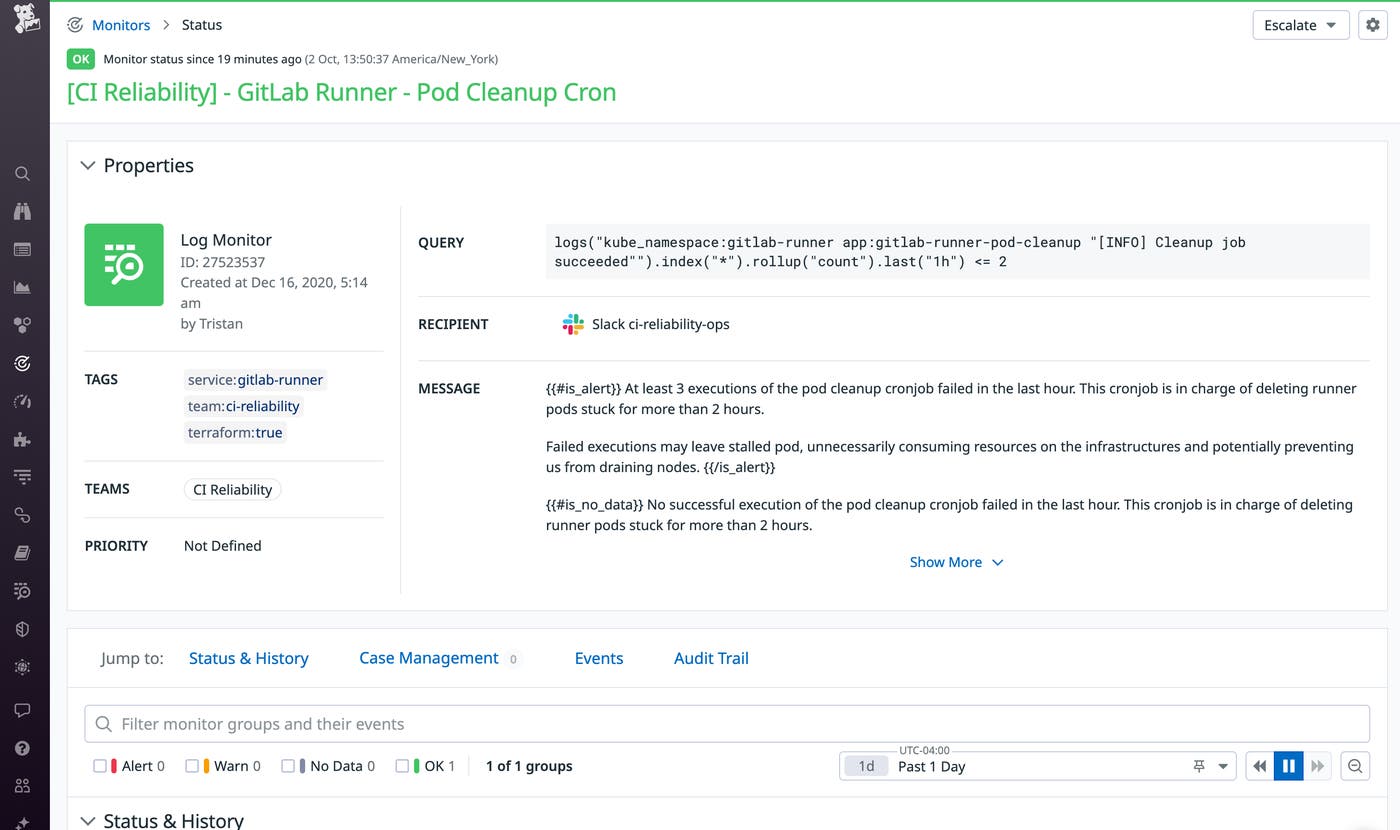
Using Datadog’s GitLab integration, we’re able to collect runner logs that help us track the number of cleanup jobs that succeed. The screenshot above shows a log monitor that triggers when fewer than three successful cleanup jobs have been executed in the past hour. If your platform engineering teams are responsible for creating your organization’s CI/CD monitors, they can configure each monitor to notify the appropriate team’s Slack channel (whether it’s a CI reliability team or another team that owns a particular repository).
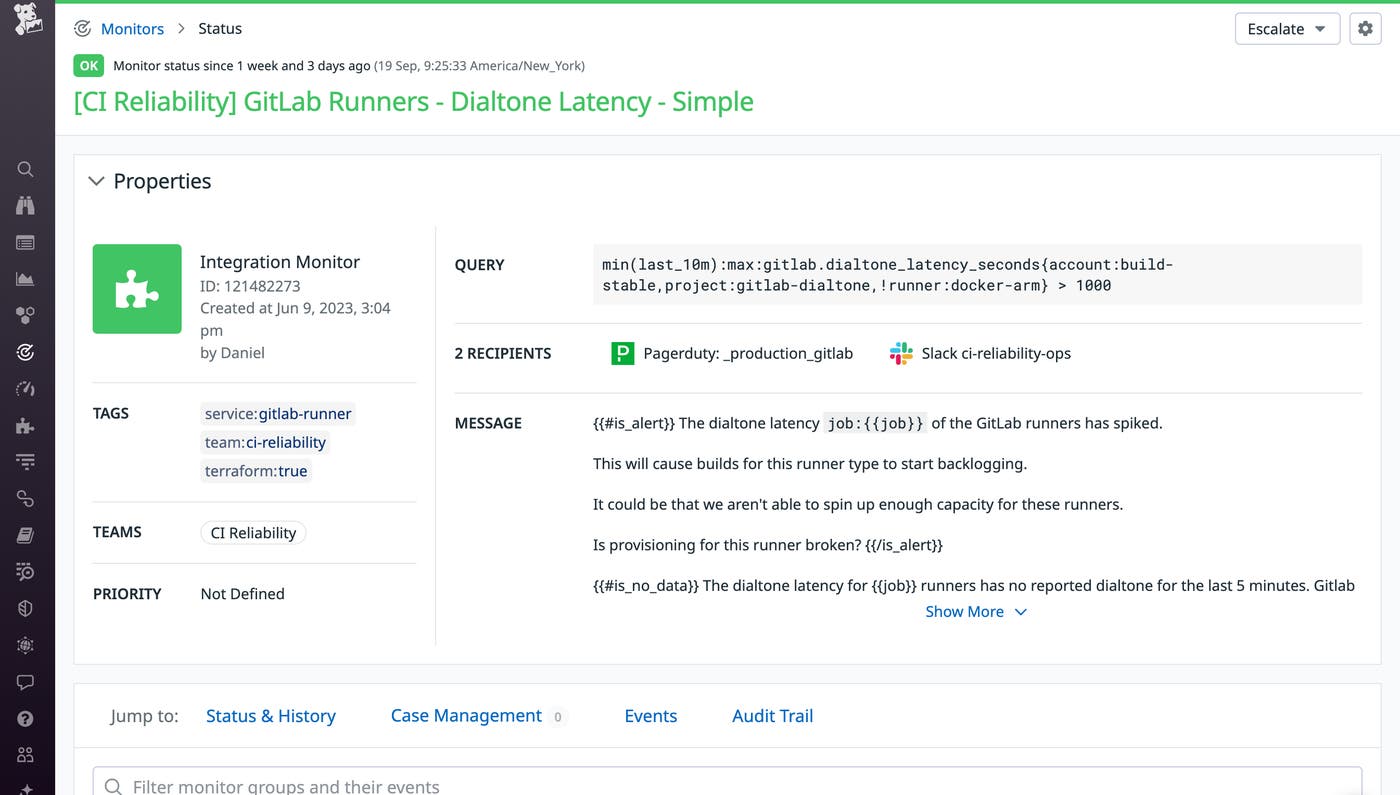
As your CI/CD system scales, it can be difficult to determine if an issue is tied to a code change or something unrelated to code, such as a capacity issue or a CI provider outage. To quickly identify CI provider and infrastructure issues, you can run a simple job as a dial tone that checks the baseline health of your CI/CD system. This job can be something as simple as echoing “hello world.”
If your dial tone is exhibiting high latency or fails to return any data, it likely indicates problems that are unrelated to your developers’ code changes. For example, high dial tone latency can be caused by backlogged CI runners or the inability to provision additional runners. You can also alert on a lack of data, which may indicate that your CI provider is down. This monitor can effectively serve as a primary indicator of CI/CD issues—and it narrows the scope of your investigation to CI/CD infrastructure or external provider issues.
We’ve discussed how you can address CI/CD issues after they surface. However, in order to maintain a healthy CI/CD system, you should also proactively assess your pipelines and take preventative measures before things break. In this section, we’ll discuss how you can establish baselines to monitor pipeline health over time and address performance regressions.
In order to proactively improve your pipelines, you’ll need to start by determining their current baseline performance. You can do this by configuring dashboards dedicated to tracking the health of your CI/CD system and monitors that alert you on different pipelines, stages, and jobs across CI providers. These tools should help you measure how different parts of your CI/CD system typically perform so you can easily identify performance and reliability regressions. Establishing baselines for different parts of your CI/CD system can also be helpful for gauging the progress of any optimizations you put in place.
Platform engineering teams often use development branches to test their optimizations (e.g., removal of unnecessary jobs or splitting up a larger job into several jobs that run in parallel). Establishing the baseline performance for each of these test branches can help you compare their performance to the default branch. A dashboard like the one shown below can help you gauge each branch’s average, median, p50, and p95 durations. If you notice that a development branch is consistently outperforming the default branch, you can slowly phase in those changes to bolster the speed and reliability of your production pipeline.
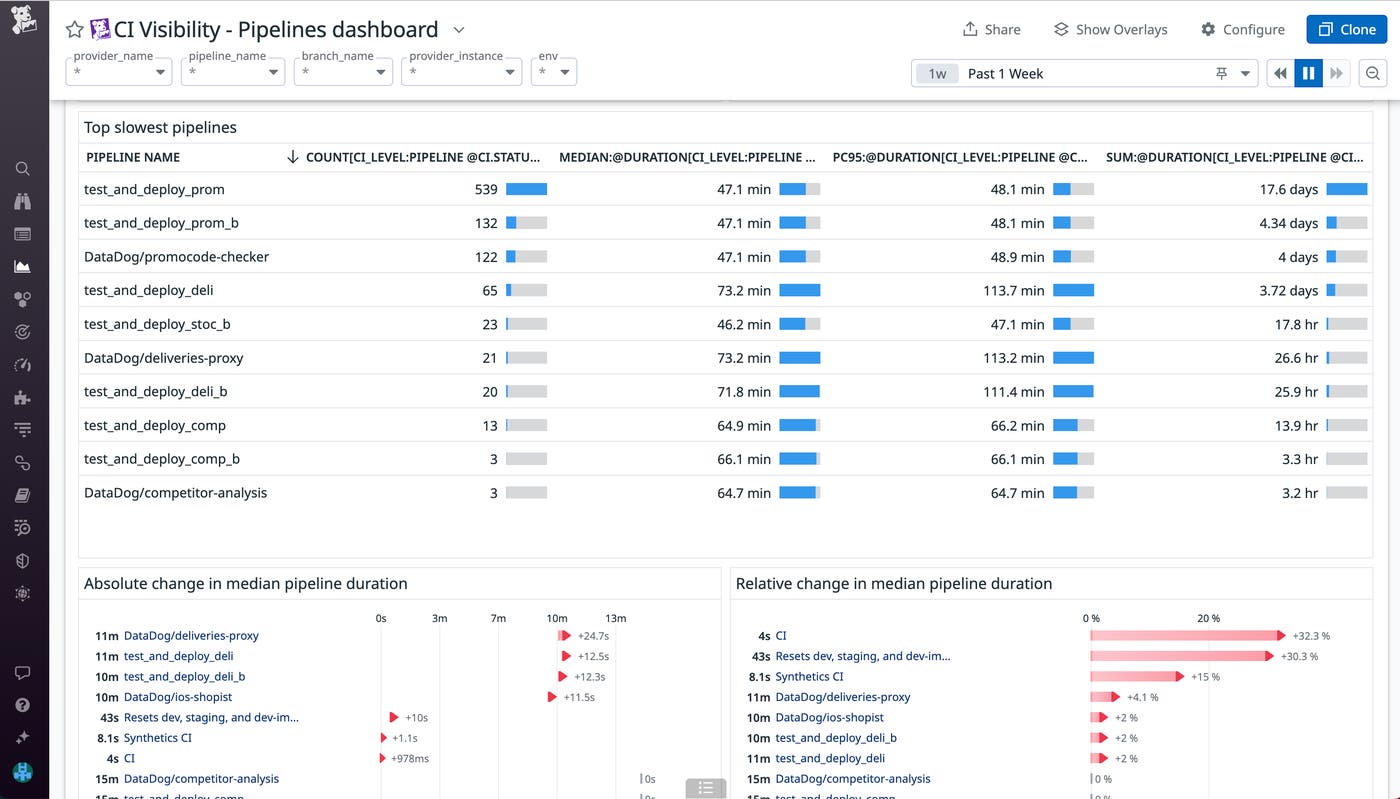
Similarly, establishing baselines of performance for different pipelines can help you weigh the benefits of using different CI providers. By doing so, platform teams can quantitatively compare the performance and reliability of pipelines from different providers in order to help drive decisions, such as having development teams switch over to using a single provider. Perhaps you’re using Jenkins for some more legacy areas of the organization, but migrating to GitHub Actions in other areas. The duration, job queue time, and failure rate for pipelines on each of these providers directly affect your monthly CI bill and the amount of infrastructure you’re able to provision, so tracking these metrics will help you better understand their compute times and infrastructure costs.
As developers focus on writing and shipping code, they may unknowingly deploy changes that negatively affect pipeline performance. While these changes may not cause pipelines to fail, they create slowdowns related to the way an application caches data, loads artifacts, and runs functions. It’s easy for these small changes to go unnoticed, especially when it’s unclear if a slow deployment was due to changes introduced in the code or other external factors like network latency. However, as these commits compile over time, they begin to create noticeable downturns in development velocity and are difficult to retroactively detect and revert. When one developer deploys slow tests or other changes that degrade the pipeline, it affects the software delivery pace of other team members. This is especially relevant when multiple development teams share a pipeline, which is a common setup for organizations that use monorepos.
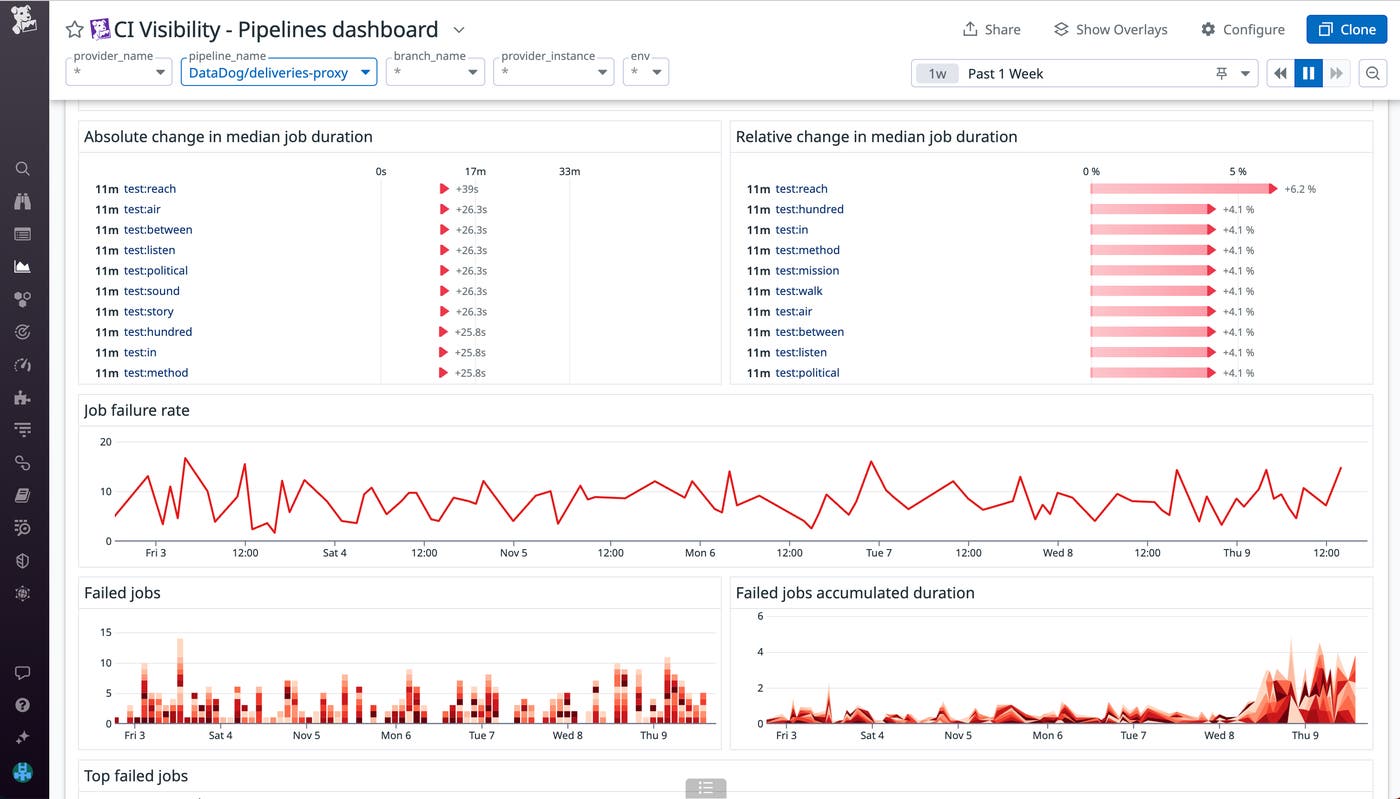
By consistently monitoring both absolute and relative changes in job duration and failure rates, development teams can help prevent pipelines from degrading and prioritize jobs in need of optimization. In the example shown below, the test:reach job has exhibited 6 percent higher (+39s absolute change) median duration times over the past week, compared to the prior week. The median duration times for other jobs in the test stage have also risen over the same time period. Development teams that own this pipeline can proactively prioritize this issue by identifying and reverting the commit responsible for these changes.
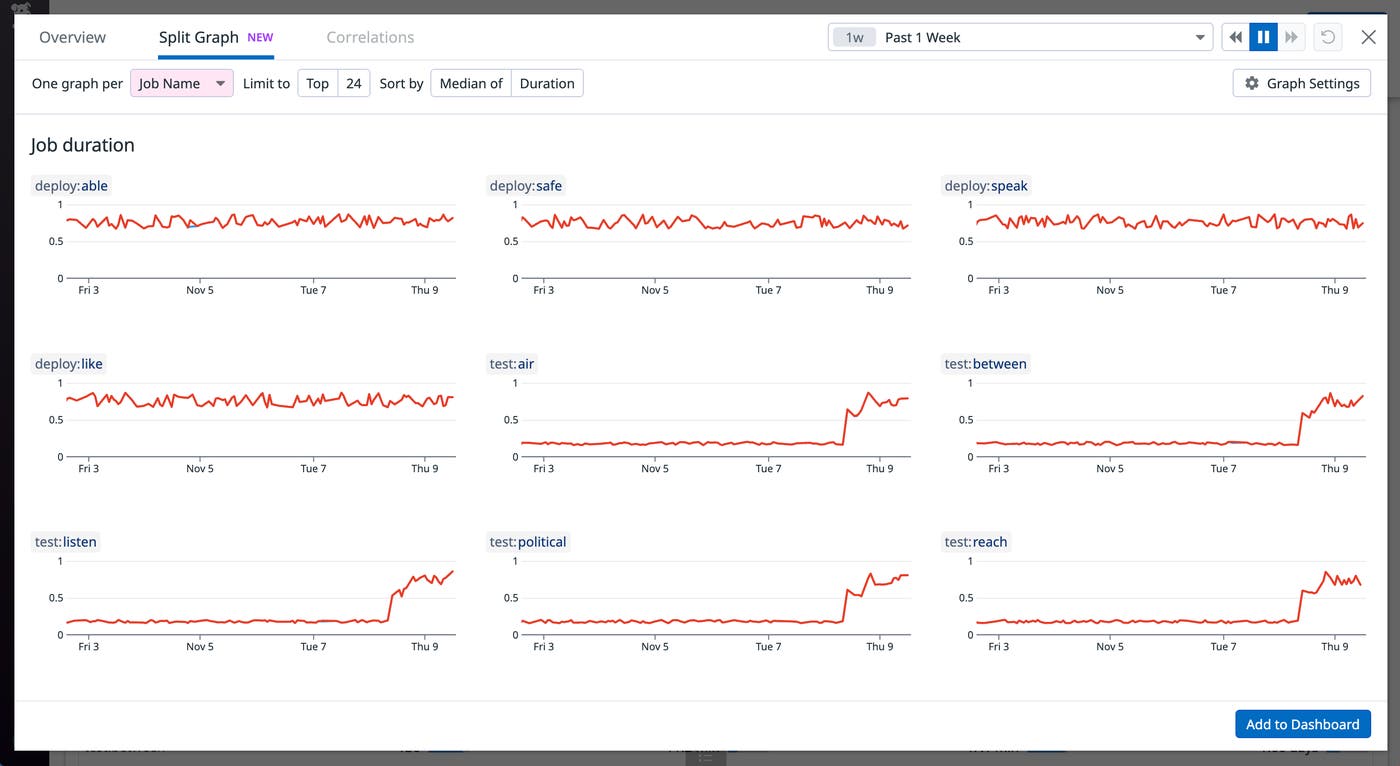
With CI/CD observability tools, you gain granular visibility into each commit and see how it affects the duration and success rate of each job. For example, let’s say we are alerted to a slowdown in one of our pipelines. By visualizing individual job durations as a split graph (shown below), we can identify that a recent issue has caused slowdowns across all jobs in our test stage.
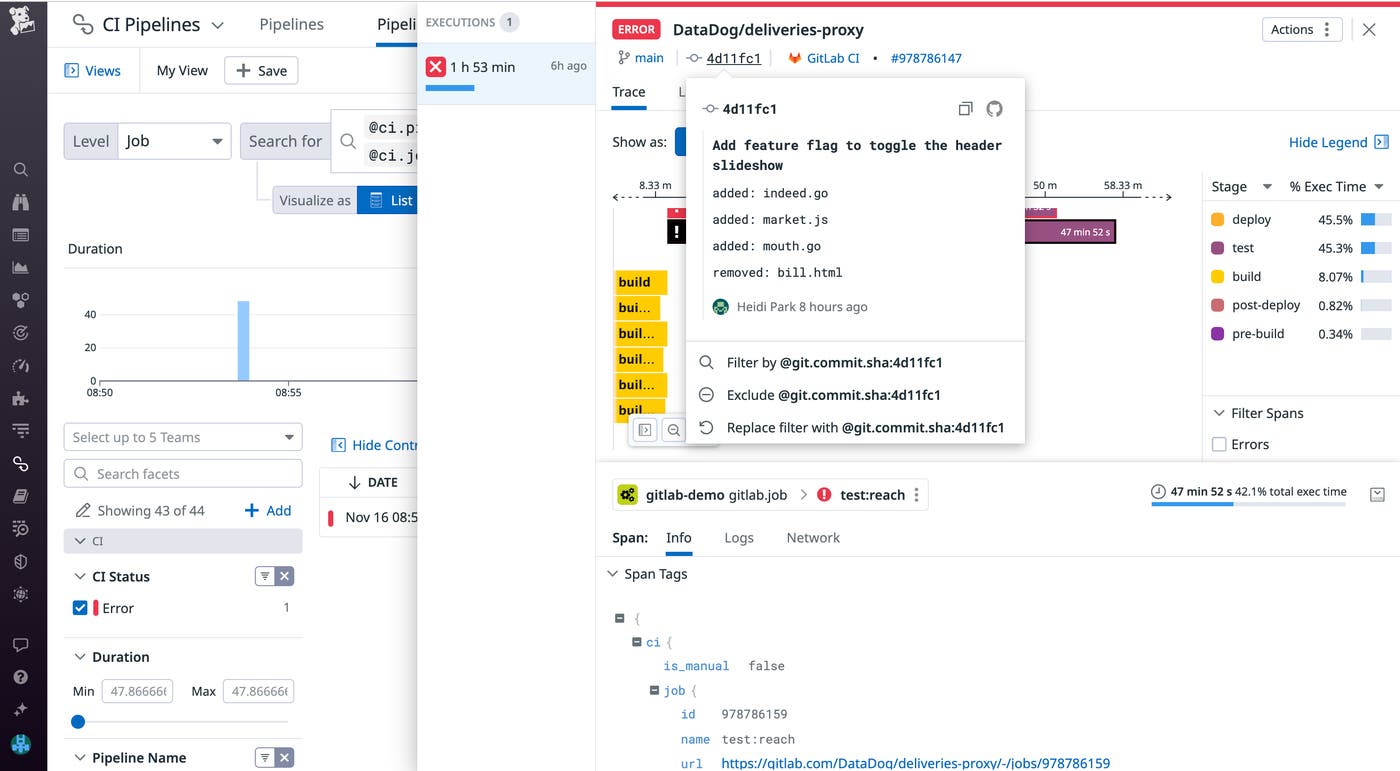
To identify the commit that introduced this slowdown, you can query a list of pipeline executions during the corresponding time frame, as shown below. Platform teams can then reach out to the corresponding engineer to have them remediate the issue. Since this change affects all jobs in the test stage, it may be an issue with how our application loads data when initiating tests or other systemic changes rather than an issue with individual unit tests. This case also creates an opportunity for platform engineers to collaborate with developers to address the issue and work on implementing best practices for future changes.
In this post, we looked at how to investigate CI/CD issues, configure granular monitors to help resolve pipeline issues faster, and proactively detect opportunities for optimization. You can learn more about monitoring your pipelines and tests with Datadog CI Visibility in this blog post or in our documentation.
If you don’t already have a Datadog account, you can sign up for a 14-day free trial.
此内容由惯性聚合(RSS阅读器)自动聚合整理,仅供阅读参考。 原文来自 — 版权归原作者所有。