


If you are running a user-facing web application, you likely implement some form of authentication flow to allow users to log in securely. You may even use multiple systems and methods for different purposes or separate groups of users. For example, employees might use OAuth-based authentication managed by a company-provided Google account to log in to internal services while customers can use a username and password system or their own Google credentials. Being able to log, monitor, and analyze all authentication events is key for identifying security threats and managing customer records for compliance purposes.
Authentication logs from these different sources and parts of your environment might have different formats and be managed by different teams or implemented using different third-party services like Google, Okta, or Auth0. This can make meaningful analysis of all authentication activity difficult.
Making sure that your applications write authentication logs that contain enough information and that use a standard, easily parsable format makes it easier to perform complex analysis on all authentication logs. For example, you can quickly identify users or IP addresses associated with the most failed login attempts. Or, you might want to track trends in login sources (e.g., username vs. Okta vs. Google Workspace) and flows (e.g., password vs. OAuth vs. SAML). A second benefit of standardizing your logs is that it makes it easier to quickly audit or delete authentication events for specific users for compliance purposes.
In this post, we’ll look at:
Best practices for managing and formatting your authentication logs
Some key security threats that authentication events can help you identify
How you can use Datadog to get the most out of your authentication logs
In order to extract the most information from your authentication events in a way that is useful, you should:
Make sure to log everything from all authentication flows
Write logs that include all the information you may need
Make sure your logs use a standardized, easily parsable format
You are probably logging events from authentication flows that you manage internally, such as when your employees log in using company-provided Google credentials. But if, for example, your application allows customers to create accounts and log in with their own Google credentials, which you don’t manage, you are likely not collecting those logs.
In order to get visibility into all of your authentication activity, you should make sure you log events for all login flows at the application level. This ensures that you’re logging everything, eliminating gaps in your monitoring coverage. It also gives you more control over how you log authentication events and what data you are collecting.
Logs that don’t include all the data you might need about an authentication event may not be very useful. For example:
2020-01-01 12:00:01 John Doe logged in
This log provides the “who” (John Doe), the “what” (logged in), and the “when” (2020-01-01 12:00:01) of the authentication event. But it doesn’t give you information like “how” (e.g., did John use a username and password, or did he log in with his Google account?) or “where” (e.g., what IP address did John log in from?). You would also need a separate log event to indicate a login failure. Without this data, you can’t, for example, monitor trends in login sources and methods, or identify potential authentication attacks. Next, let’s look at a log that includes that information:
2020-01-01 12:00:01 google oauth login success by John Doe from 1.2.3.4
This log provides more details about the event that you can use to perform complex analysis more easily. By logging all authentication events at the application level, you can ensure that your logs contain this level of information.
Even if you’re collecting detailed logs for all authentication events, if they all are written as simple strings, parsing them or searching for the logs you need is cumbersome. You can instead have your application write logs in a key-value format, using = as a separator. Using this format means that a key-value parser, such as Datadog’s Grok Parser can easily process them. Let’s take the log we saw above:
2020-01-01 12:00:01 google oauth login success by John Doe from 1.2.3.4
If we log this using a key-value format, it might look like the following:
INFO 2020-01-01 12:00:01 usr.id="John Doe" evt.category=authentication evt.name="google oauth" evt.outcome=success network.client.ip=1.2.3.4
Datadog can then parse this as the following JSON:
{
"usr": {
"id": "John Doe"
},
"evt": {
"category": "authentication",
"name": "google oauth",
"outcome": "success",
},
"network": {
"client": {
"ip": "1.2.3.4"
}
}
}
Using the same format across all of your authentication logs means you can easily use these attributes to slice and dice log data to view exactly the information you need. For example, you can easily look for which users (usr.id) have the highest number of failed logins (evt.outcome:failure). A key-value format also makes it easy to add custom attributes to logs. For example, you might want each log to include a reCAPTCHA v3 score to identify possible bot activity. Another important point is to use quotes to wrap any attribute values that may contain spaces. This ensures that you capture the full value in a way that is easily parsable.
It’s important to use a standard naming convention for the attributes in your logs to ensure that you can search and aggregate data across all of them, regardless of where they come from. We recommend making sure your authentication logs include the following standard attributes:
usr.id
evt.category
evt.name
evt.outcome
network.client.ip
This attribute identifies the user who is requesting authentication. You should make sure that the value for usr.id is a username or email address rather than any unique identifier you might use to identify users in your database. You should also make sure to include a unique username even if the user does not have one in your database. This allows you to track which user IDs are failing to login, which can be used to detect an attack.
Setting this to authentication makes it easy to search for authentication events and filter them out from the rest of your event logs.
The evt.name should include more detailed information about the source and method of authentication, such as whether it used SAML (evt.name="saml") or was a Google login using OAuth (evt.name="google oauth").
This should be set to either success or failure. You can use this attribute to easily look for patterns in login failures across your applications.
This is the IP address of the user or client who is requesting authentication. Recording this provides insight into where requests are coming from.
Now that you are collecting and parsing key data out of your authentication logs, you can use them to detect possible security threats. For example, if you see a significant number of failed login attempts from a single user within a short period of time, it could indicate a brute force attack. If those failed login attempts are followed by a successful one, it could be a successful account takeover that you should investigate immediately.
Another common authentication attack technique that you can easily look for in your logs is credential stuffing. Credential stuffing is when an attacker mixes and matches breached login credentials to try to match a real user account. In order to detect this type of attack, you can look for logins using multiple usr.id values all coming from the same network.client.ip.
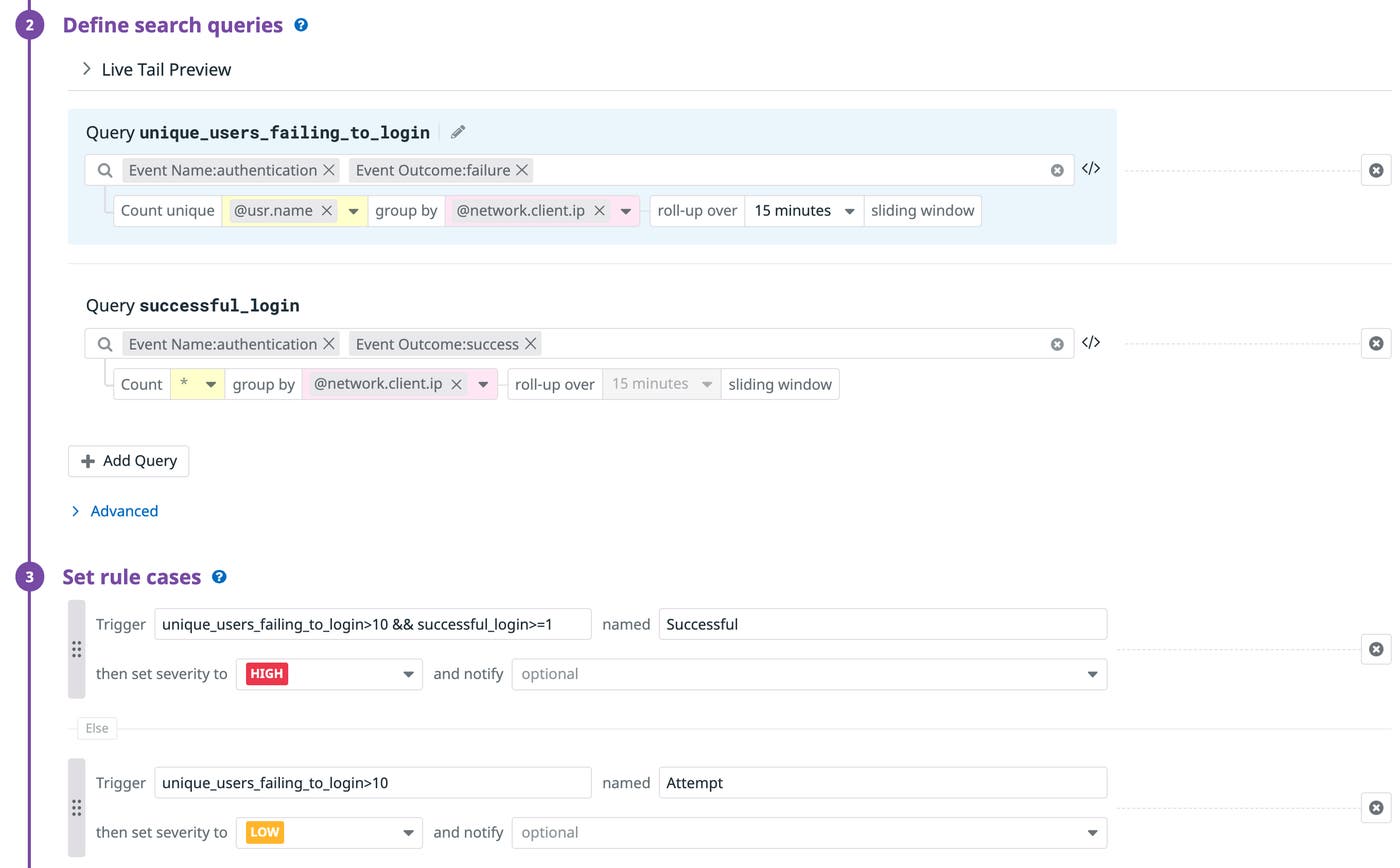
Next, we’ll look at how Datadog can help you automatically detect malicious activity like these and other attacks by monitoring your authentication logs.
With Datadog Cloud SIEM you can easily monitor your authentication logs and get alerted to possible attacks or other suspicious activity.
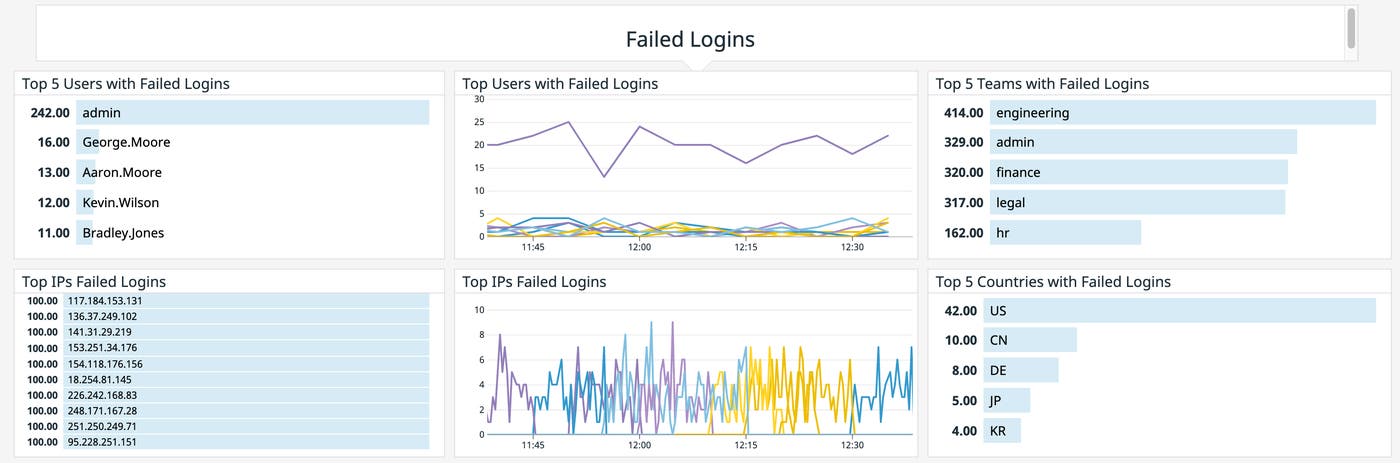
You can create custom dashboards to visualize key authentication data like counts of logins by source and outcome. This provides you with a high-level view of activity across your entire user base and helps you see trends in how users are logging in and the top sources of failed logins, so you can identify suspicious spikes that you need to investigate.
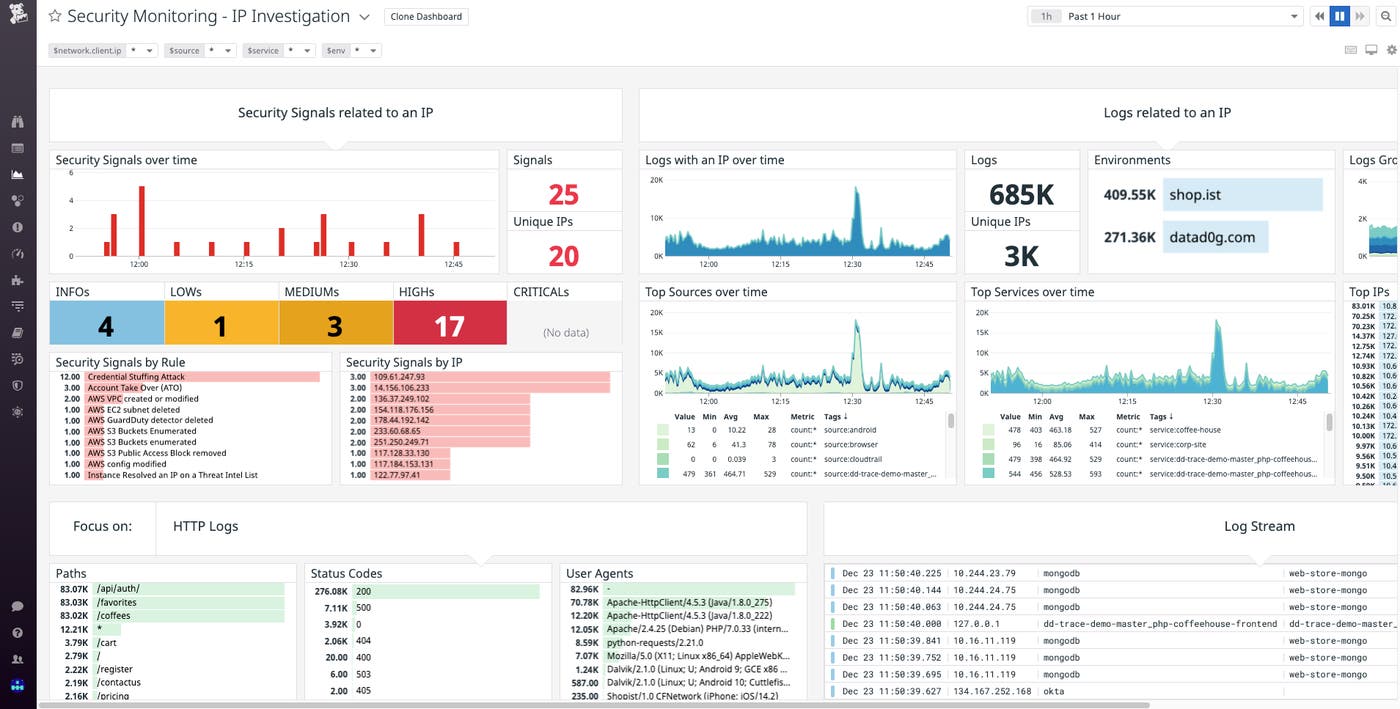
Datadog also provides out-of-the-box dashboards, such as the IP investigation dashboard and User investigation dashboard. These correlate key data from your authentication logs with relevant data from the rest of your environment to assist your investigations.
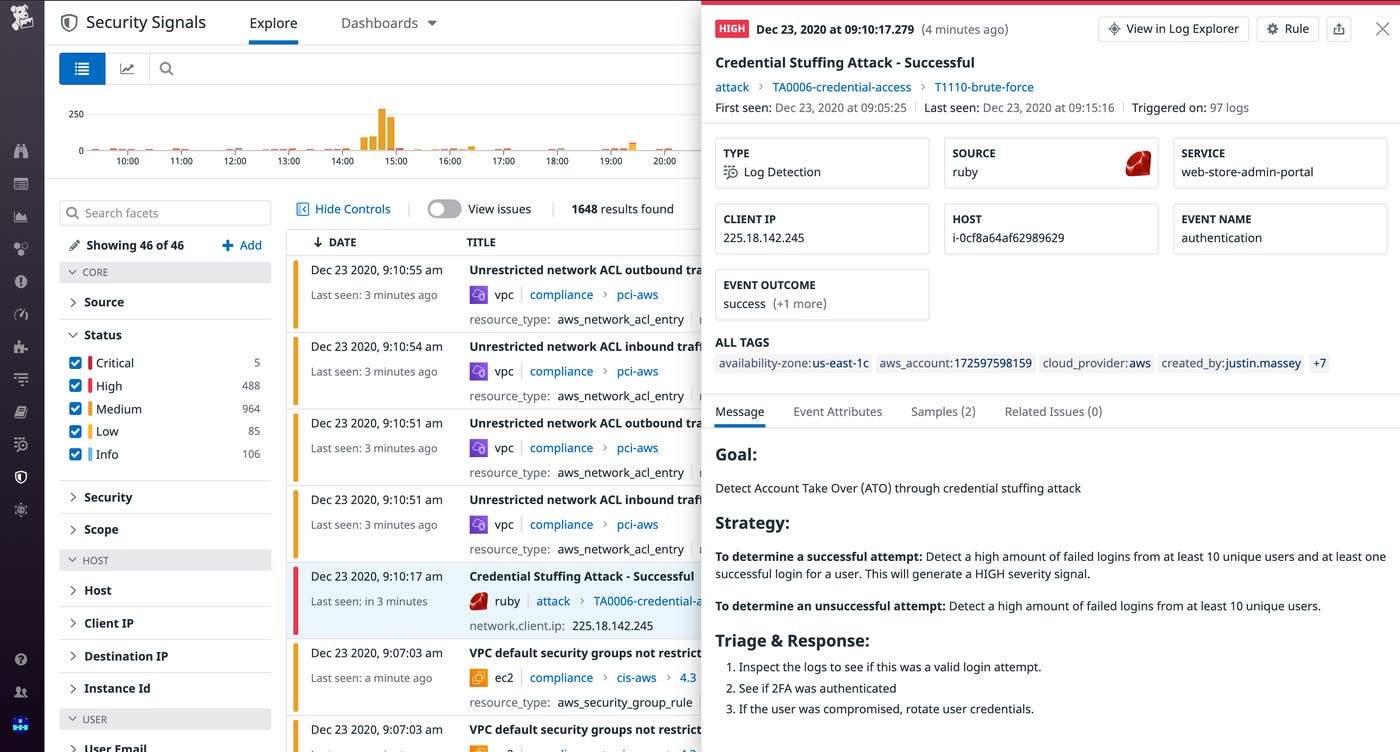
Datadog includes turn-key Detection Rules that scan 100 percent of your ingested logs in real time for common attacker techniques. If any log triggers one of these rules, it generates a Security Signal that includes key data about the event, such as the type of attack detected and suggestions on a response strategy. You can easily view, filter, and sort all of your Security Signals in the explorer to triage them and see where to focus your efforts.
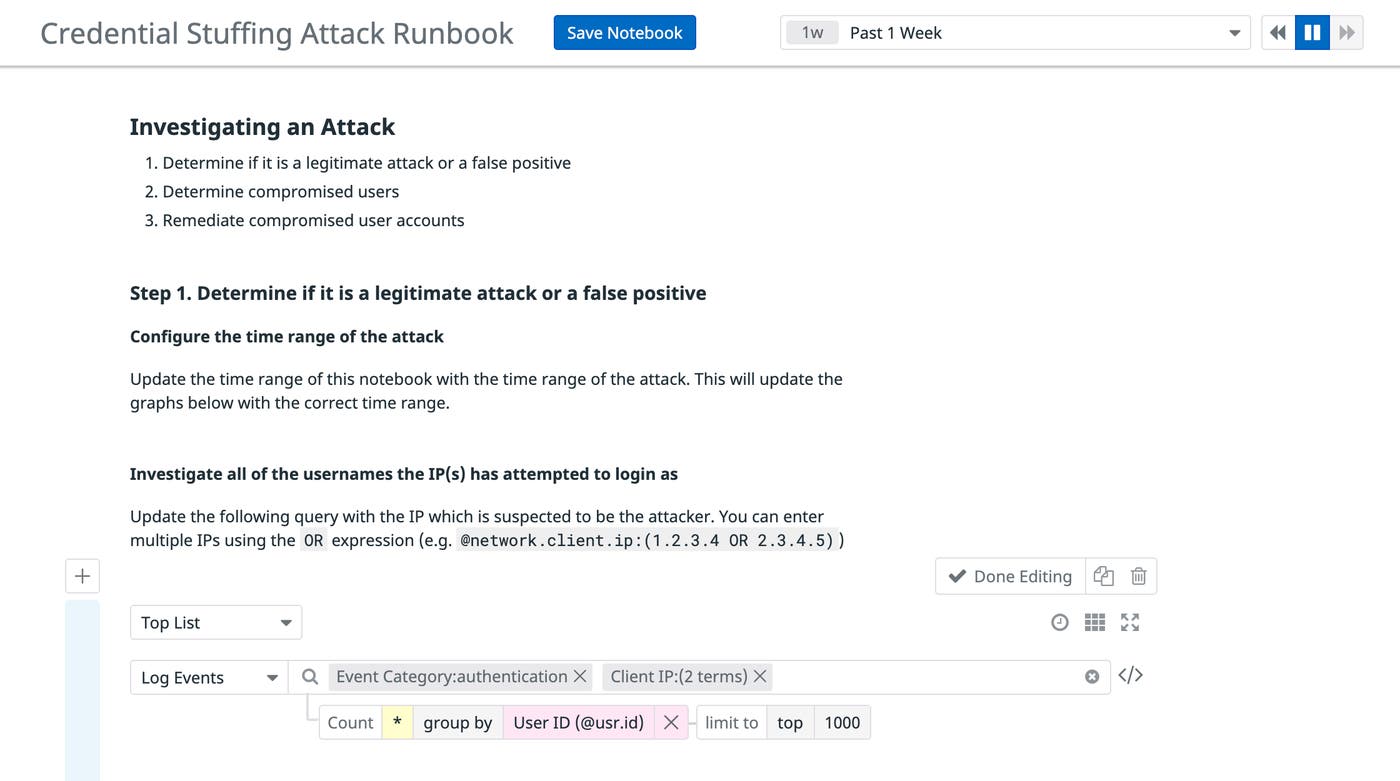
For signals triggered from the Credential Stuffing Attack Detection Rule, Datadog includes an out-of-the-box runbook designed to help you with response and remediation. The interactive runbook guides you through investigation strategies alongside graphs of your own logs. You can save a copy of the runbook and set the the time frame, document your investigation in markdown, and easily share it with teammates for comment.
Datadog ingests and analyzes all of your logs, ensuring that you can detect threats across your entire environment. You can archive any logs that you don’t want to index, and then quickly rehydrate them in the future for investigations, audits, and compliance purposes.
In this post we looked at some best practices for managing authentication logs that can help you easily track and analyze user activity and identify security threats across your environment. With Datadog, you can get even more insight into the security of your applications as well as the health and performance of the rest of your stack, all from a unified platform. If you’re not a Datadog user, sign up for a free trial to start monitoring your authentication logs today.
此内容由惯性聚合(RSS阅读器)自动聚合整理,仅供阅读参考。 原文来自 — 版权归原作者所有。