





When a critical application starts throwing latency alerts, the network is often one of the hardest places to investigate. Application teams can see latency in traces and service dashboards, while network teams often need to inspect device metrics, traceroutes, NetFlow data, and configuration changes in separate tools. This separation slows investigations because teams have to determine whether the issue came from a degraded device, congested path, misrouted connection, or recent configuration change before they can decide what to fix.
Datadog Network Monitoring brings application teams, SREs, and network specialists into the same workflow. New capabilities connect application issues to the specific device or hop responsible and let any engineer act on the fix. From an APM trace or an alert, you can pivot down the stack from L7 to L1 to a Network Path comparison view to spot the hop that changed, drill into a Network Device Monitoring (NDM) view that surfaces device-level anomalies and configuration changes side by side, surface the associated configuration change in Network Configuration Management (NCM), and ask Bits Chat to translate the findings into plain English. When the root cause is a recent configuration change, you can roll it back from the same view, without leaving Datadog.
In this post, we’ll show how Datadog helps you:
Correlate application issues to the network
Pinpoint the bad hop with Network Path comparison
Investigate affected devices with Network Device Monitoring
Trace the root cause to a configuration change
Translate the network language with Bits Investigation
Remediate network issues without leaving Datadog
The connection between application behavior and network performance is often the hardest link in the investigation chain to establish. When a service shows elevated latency in APM, engineers typically lack the context to know whether the delay is in the application layer or somewhere deeper in the network. Datadog bridges this gap with a direct pivot from an APM trace to Network Path.
From a trace showing elevated latency, engineers can navigate to the Network Path view in one click. Network Path automatically traces the route between the source and destination, sending packets at the host level and measuring latency and packet loss at each hop along the way. The result is a full hop-by-hop map of exactly where traffic is flowing: across transit gateways, virtual private clouds (VPCs), cloud resources, and on-premises devices. When a hop is degraded, the problem becomes visible immediately, and the investigation moves from “something is wrong in the network” to “this specific hop is the problem.”
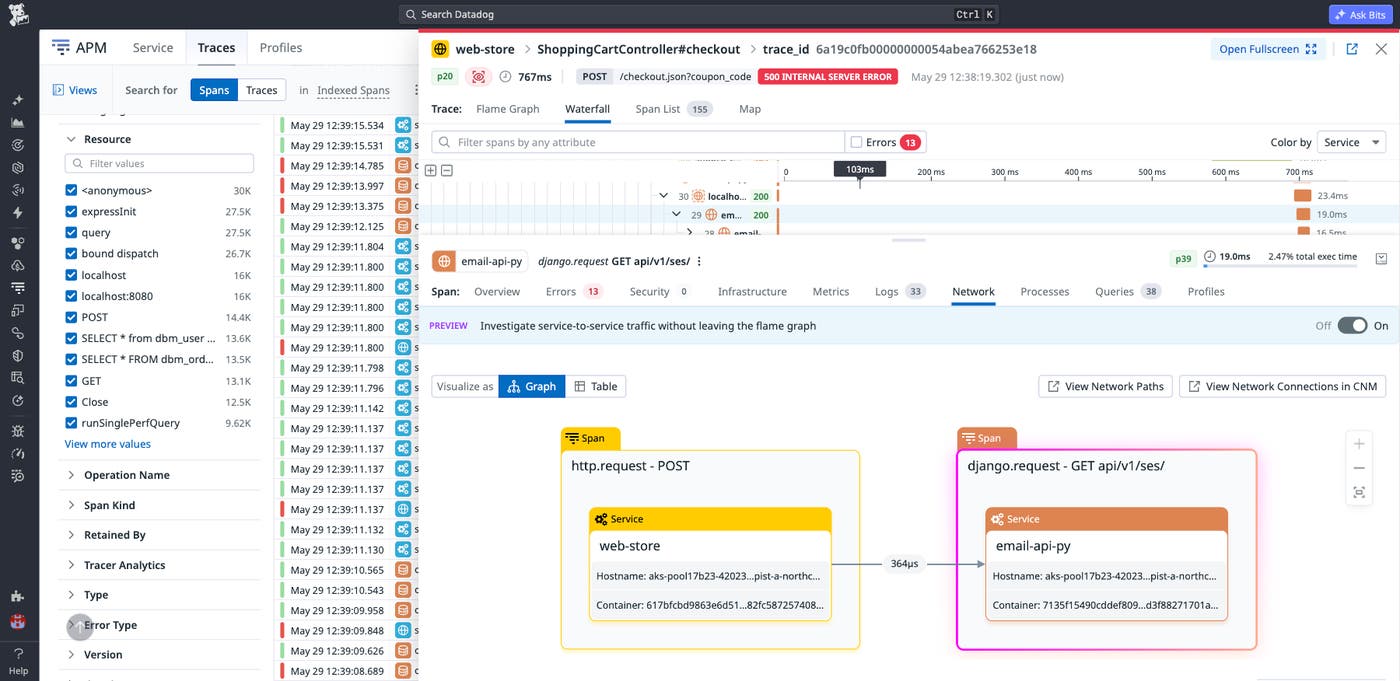
Network Path shows the route that traffic follows from its source to its destination, including latency at each hop. During an incident, that hop-by-hop view helps teams determine whether a problem originates inside their own infrastructure, with an external provider, or from misrouting. But teams also need historical context: What changed between the healthy path and the degraded path?
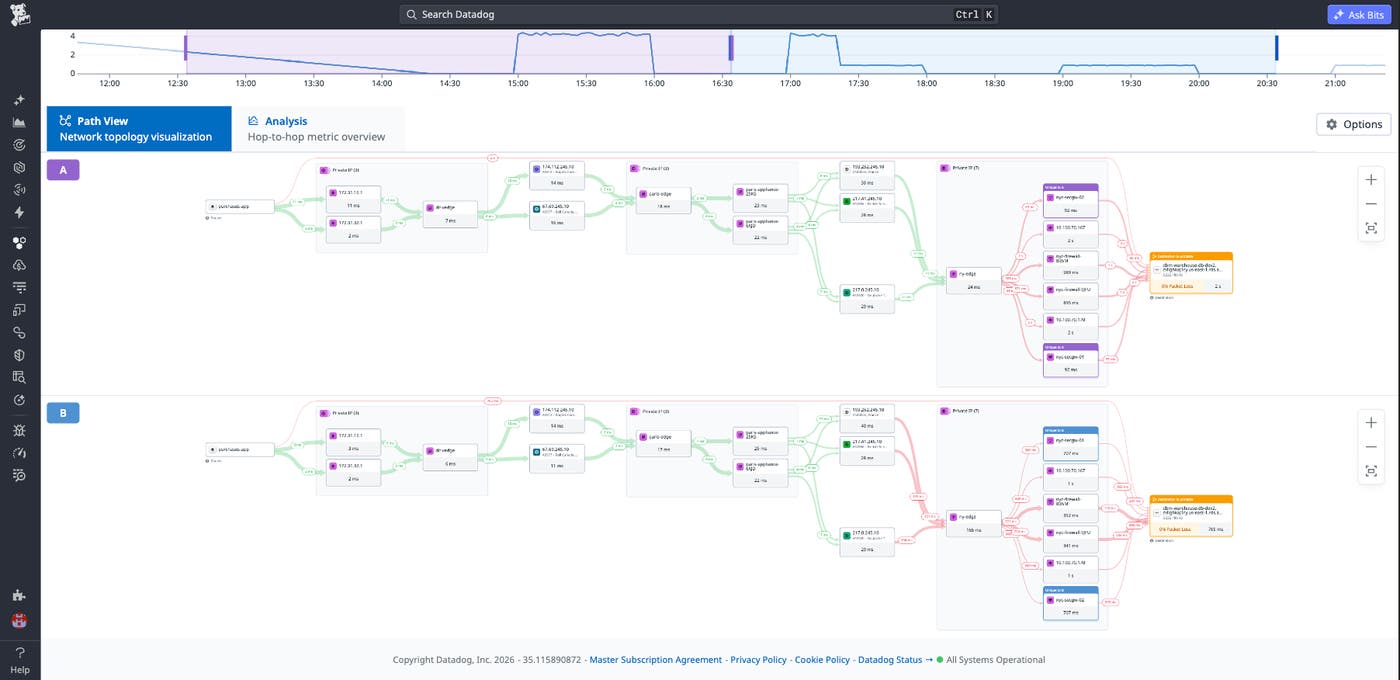
The Network Path comparison view helps answer that question by placing two path snapshots side by side. You can compare the same source and destination across two time windows, such as before and after an incident started, or compare different paths to understand how routing differs across traffic flows. Datadog highlights common hops, unique hops, and performance deviations so teams can focus on the part of the route that changed.
For example, if the path from a payment service to a backend dependency normally stays under 20 ms but suddenly adds 340 ms—at ny-edge, for example—the comparison view makes that regression stand out. Instead of manually reviewing traceroute output or switching between historical snapshots, engineers can identify the degraded hop visually and continue investigating the affected device from the same workflow.
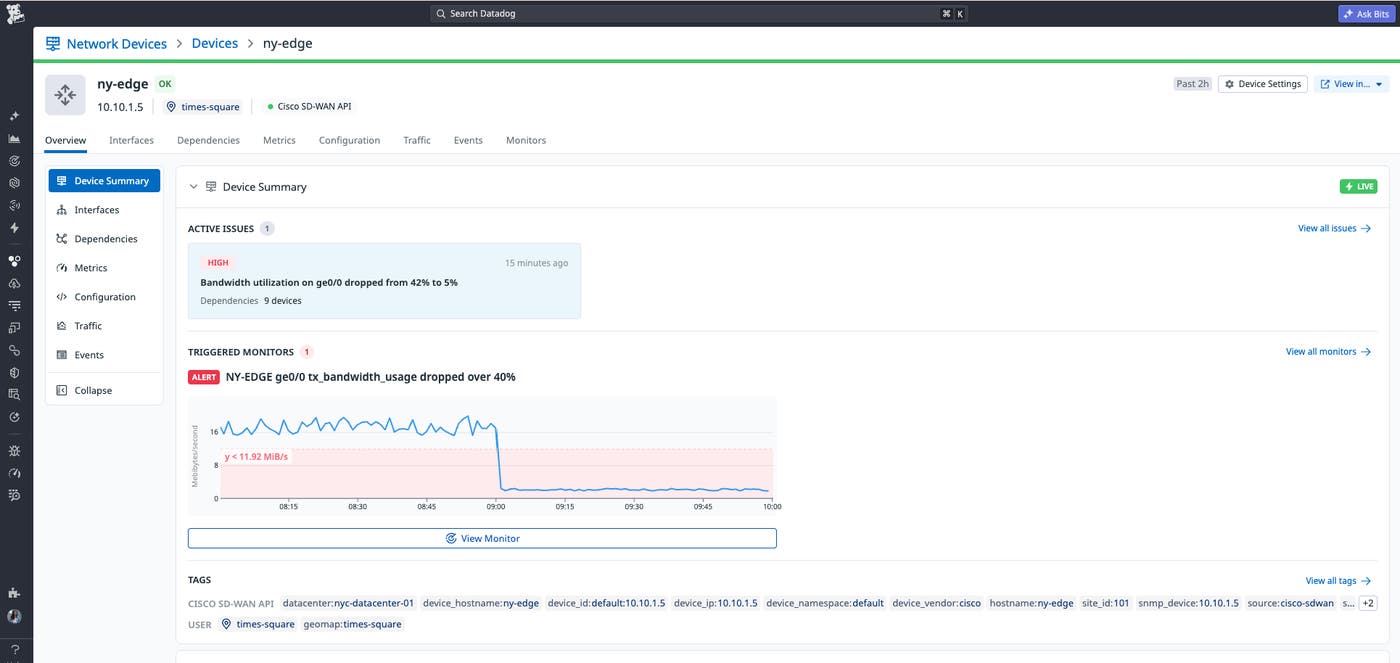
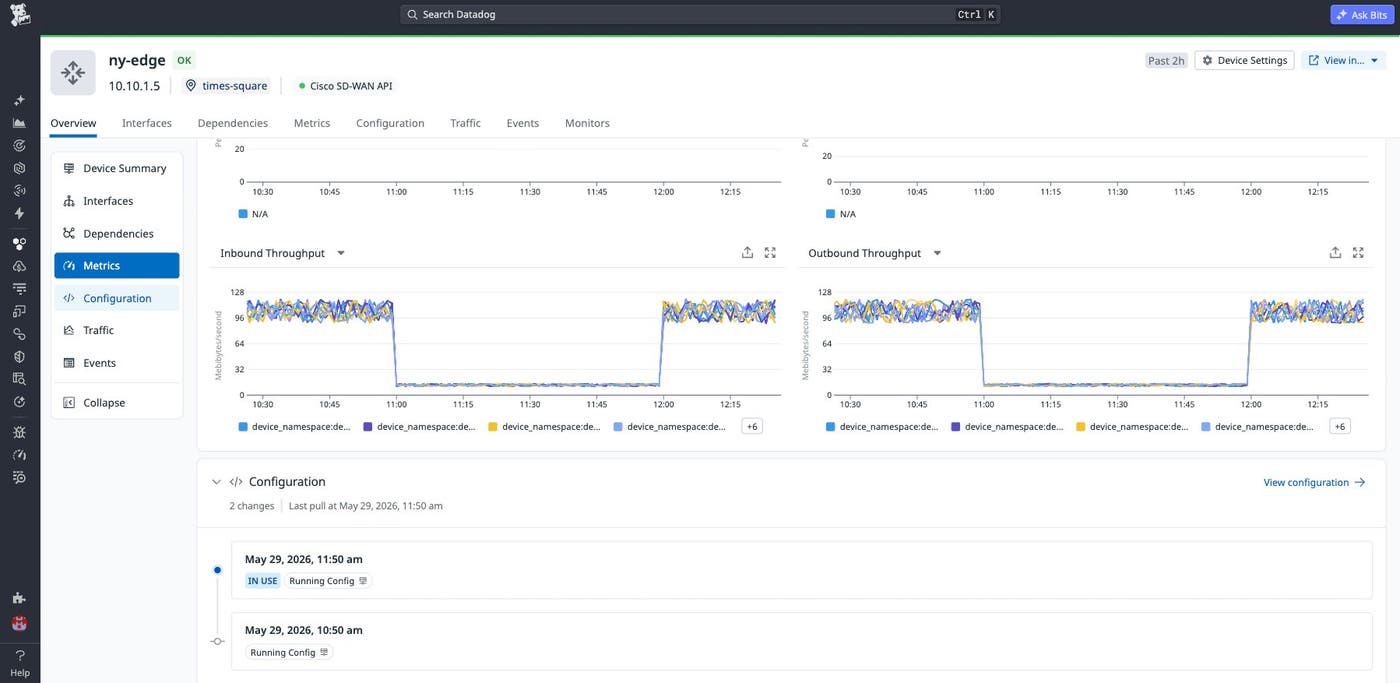
After you identify the affected hop, the next step is to understand whether the underlying device is healthy. NDM provides real-time visibility into the health and performance of every monitored device in a fleet such as routers, switches, and firewalls. Interface metrics collected via Simple Network Management Protocol (SNMP)—including throughput, error rates, and bandwidth utilization—are available per device, so engineers can correlate the moment a path changed with the moment a device’s health metrics degraded.
In an incident investigation, these metrics help explain how a device contributed to the application symptom. For example, the device view might show that throughput on an ny-edge interface dropped from 8 Gbps to 2 Gbps at 13:00, which matches the moment that payment latency increased. Interface errors, packet drops, CPU spikes, and bandwidth utilization can all provide evidence that a network device is contributing to degraded application performance.
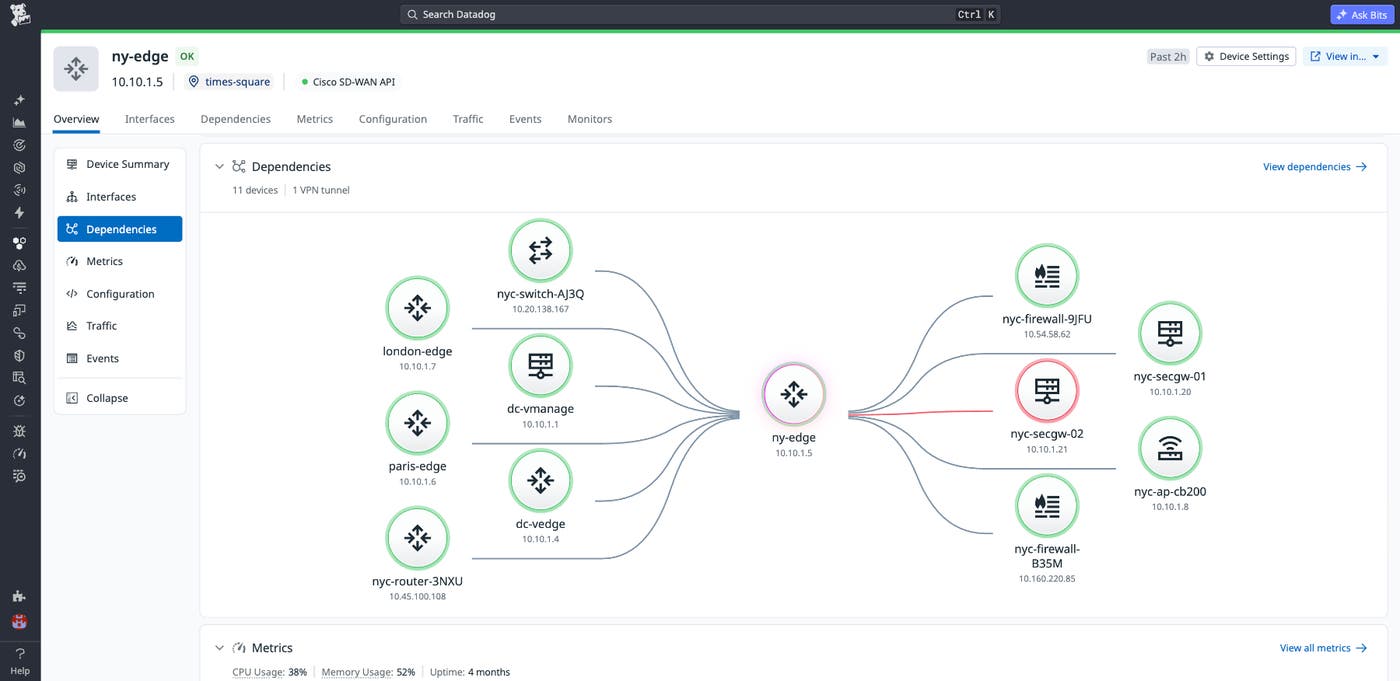
NetFlow data adds another layer of context by showing traffic patterns that can indicate congestion hotspots or unexpected traffic shifts. Dependency maps can also show which downstream services, hosts, and devices are affected when a single device degrades. Together, these views help teams understand both the local device problem and the broader impact across applications and infrastructure.
Device Health insights, powered by Watchdog™, help teams move from raw signals to prioritized issues. Instead of manually sorting through metrics, SNMP traps, syslogs, NetFlow data, and configuration events, teams can review a ranked list of issues that includes affected resources, severity, timestamps, and next steps. For network teams that are trying to reduce mean time to resolve (MTTR), this helps surface the issues that need attention first.
A degraded device metric tells you what changed in performance, but it does not always explain why. Network configuration changes are a common cause of incidents, especially when a routing policy, QoS policy, access control list, or interface setting changes shortly before an outage or latency spike. Without configuration history in the same investigation flow, teams often need to search through separate systems or ask another team to confirm what changed.
Network Configuration Management (NCM) helps close that gap by tracking device configuration changes alongside device health data. When Datadog detects a configuration change near the start of an issue, it can surface that event in the device timeline with related metrics. This makes it easier to build an end-to-end incident narrative: A configuration change occurred, device throughput dropped, and user-facing latency increased.
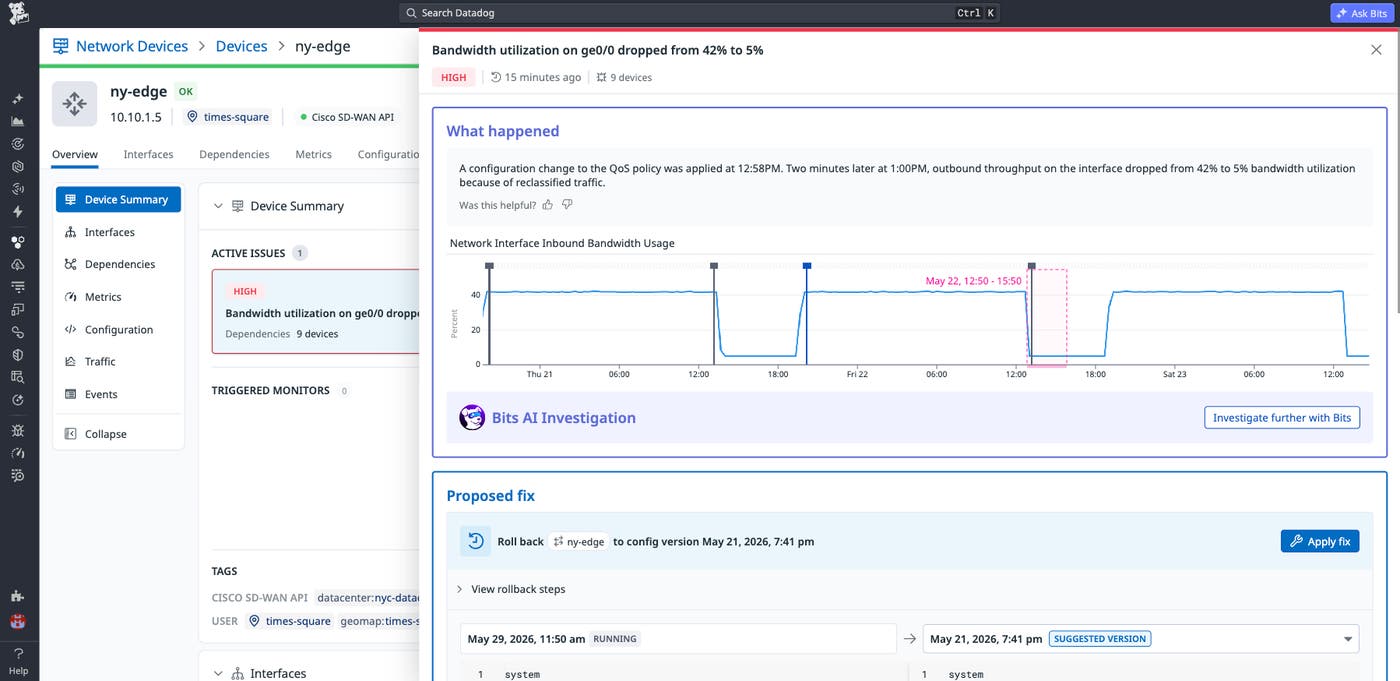
For example, Datadog might correlate a QoS policy change on ny-edge at 12:58 with a throughput drop at 13:00 and a payment service latency spike shortly afterward. Rather than treating these as separate facts, teams can review them together and determine whether the configuration change is the likely cause. If the change is relevant, they can inspect the configuration diff and decide whether to roll back to a known-good version.
Network data can be difficult to interpret for engineers who do not work with devices and routing every day. Traceroutes, SNMP metrics, NetFlow records, device dependencies, and configuration diffs can reveal the root cause, but they often require specialized knowledge. During an incident, this knowledge gap can slow collaboration because non-network teams have to wait for a network specialist to translate what the data means.
Bits Investigation helps make network investigations more accessible by explaining relevant signals in plain language. In a Network Path investigation, Bits Investigation can summarize what changed between two paths, identify the degraded hop, and explain why the hop is likely contributing to latency. In a device investigation, it can summarize metrics such as utilization, packet drops, and throughput changes and relate them to nearby events such as configuration updates.
Bits Investigation can go further by launching a guided investigation from the issue panel. The investigation shows what happened, which resources were affected, what evidence supports the suspected cause, and what remediation Datadog recommends. This helps application teams, SREs, and network specialists work from the same explanation rather than relying on separate interpretations of the same data.
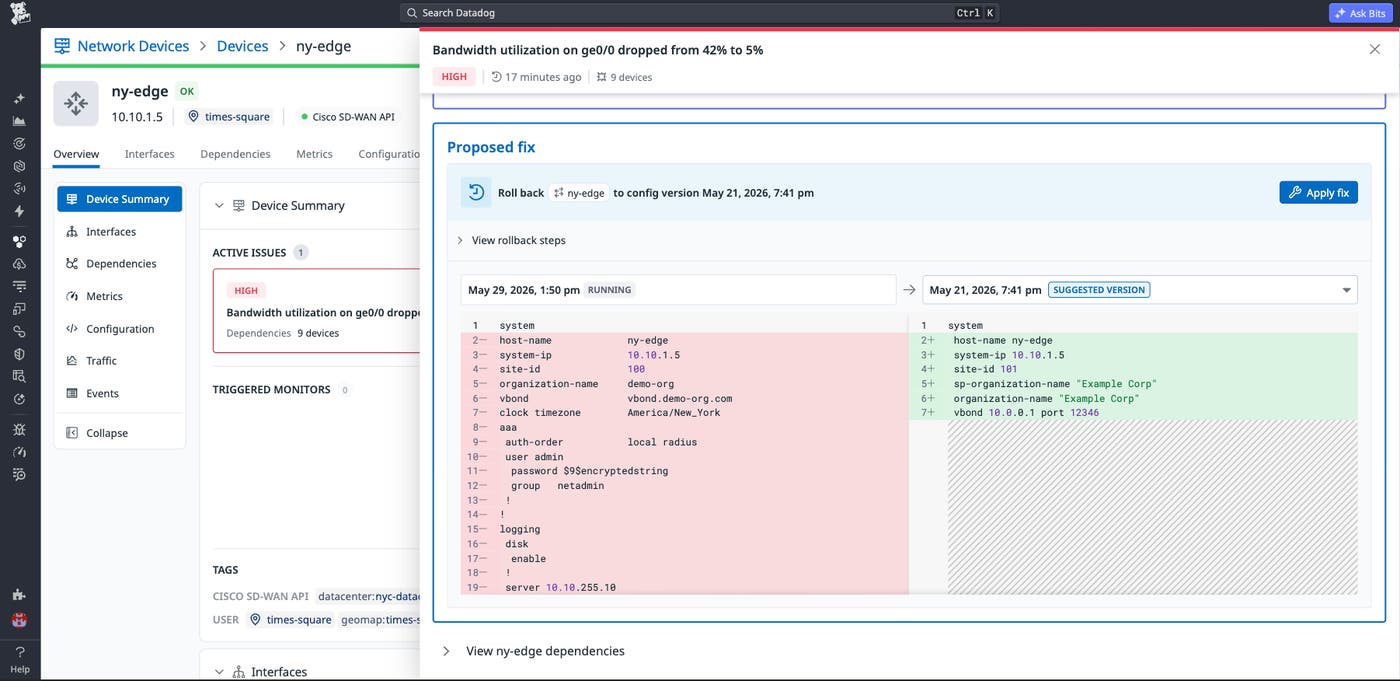
Once the root cause is confirmed and a fix is proposed, Datadog makes it possible to act without leaving the platform. From the same UI used to diagnose the issue, teams can roll ny-edge back to its last known-good configuration—no SSH session, no separate network management tooling, no ticket to the network team.
The rollback is applied immediately and automatically logged in the NCM configuration timeline for auditability. After the fix, the same device metrics and Network Path comparison that helped diagnose the incident confirm the resolution: Throughput on ny-edge returns to 8 Gbps, the latency added by the bad hop disappears from the path comparison, and the payment service latency returns to baseline. The entire investigation—from APM alert to root cause to remediation—happens in a single platform, with a complete audit trail.
Network incidents are easier to resolve when teams can connect application symptoms to network paths, devices, configuration changes, and remediation guidance in one place. Datadog helps teams move from a latency alert to the affected route, identify the degraded hop, inspect device health, correlate the issue with a configuration change, and use Bits AI to summarize the evidence and recommended next steps. This reduces the manual correlation work that often slows incident response across application, infrastructure, and network teams. To get started, read the documentation for Network Device Monitoring, Network Path, Network Configuration Management, Device Health, Bits Investigation, and Bits Chat.
If you don’t already have a Datadog account, sign up for a free 14-day trial to start monitoring your network devices and paths.
此内容由惯性聚合(RSS阅读器)自动聚合整理,仅供阅读参考。 原文来自 — 版权归原作者所有。