











Like most organizations, we are always trying to be as efficient as possible in our usage of our cloud resources. To help accomplish this, we encourage individual engineering teams at Datadog to look for opportunities to optimize. They can share their performance wins, big or small, in an internal Slack channel along with visualizations and, often, calculations of the resulting annual cost savings. There, these efforts can be seen and recognized by others, including our CEO and CTO, who regularly chime in and comment on performance wins.
At one point an engineer noted that, over the preceding two months, the shared wins added up to $17,500,000 saved annually on our cloud spend. In this post, we’ll look at how our engineering teams achieved this. Specifically, we’ll walk through how we foster an internal engineering culture that builds products that are both excellent and efficient, and how we rely on our own products—including Cloud Cost Management, Continuous Profiler, and Network Performance Monitoring—to track both performance improvements and cost savings so that everyone can see the impact their work has.
In total, there were 15 performance optimizations that accounted for the $17.5 million in annual savings (plotted below), with the lowest optimization yielding $80,000 in annual cost savings and the highest optimization yielding $4.3 million.
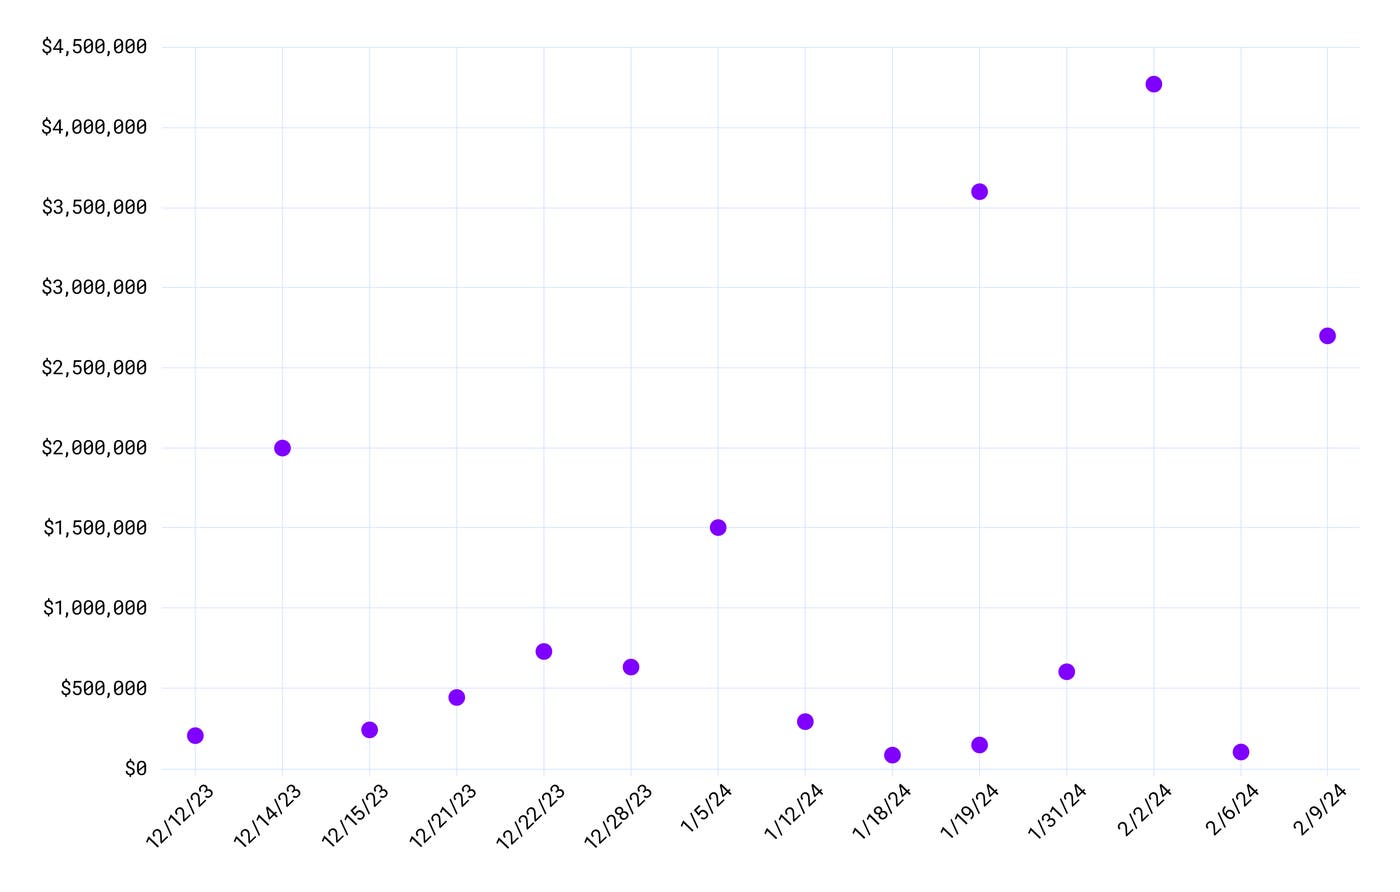
Optimization efforts can come from many different places, including company- or team-wide initiatives or simply individual engineers seeing an opportunity to improve their systems. While the end goal is to maximize cost savings, the work put into our optimization involves tackling engineering problems and finding ways to improve performance at scale, and it’s important that we celebrate that work. Even the smallest improvements help drive and maintain our culture of performance optimization at Datadog. Many contributors cited other engineers’ performance wins as motivation and would often follow suit by sharing their own projects when completed.
While motivation and culture are driving factors for systemic improvement, engineers still need access to the proper tools to assist them in troubleshooting and monitoring their optimizations. In the following sections, we’ll discuss how CCM, Continuous Profiler, and NPM assist us in our investigations.
In order to establish a culture around cost optimization, it’s critical for engineers to have access to cloud cost data for two main reasons.
The first is to help estimate the cost savings of different optimization opportunities. Engineers come across inefficiencies every day—however, they have a limited bandwidth of work that they’re able to take on. Access to cloud cost data enables engineers to contextualize the cost savings of one optimization relative to its estimated time to completion as well as the cost savings of other potential optimizations.
Secondly, cloud cost data is essential because it enables an engineer to observe the impact of their optimization after it’s been shipped. Not all optimizations succeed, and cloud cost visibility helps engineers hold themselves accountable to the real impact they are delivering.
In order to achieve this, our engineers rely on Datadog Cloud Cost Management. CCM helps us visualize the amount a particular service is spending on compute, storage, networking, and other cloud resources across data centers and even multiple cloud providers, so we can precisely identify cost optimization opportunities. If an engineer needs ideas to help them get started, they can use the recommendations page to automatically sort optimizations by their potential savings and quickly identify changes that will yield the greatest business impact.
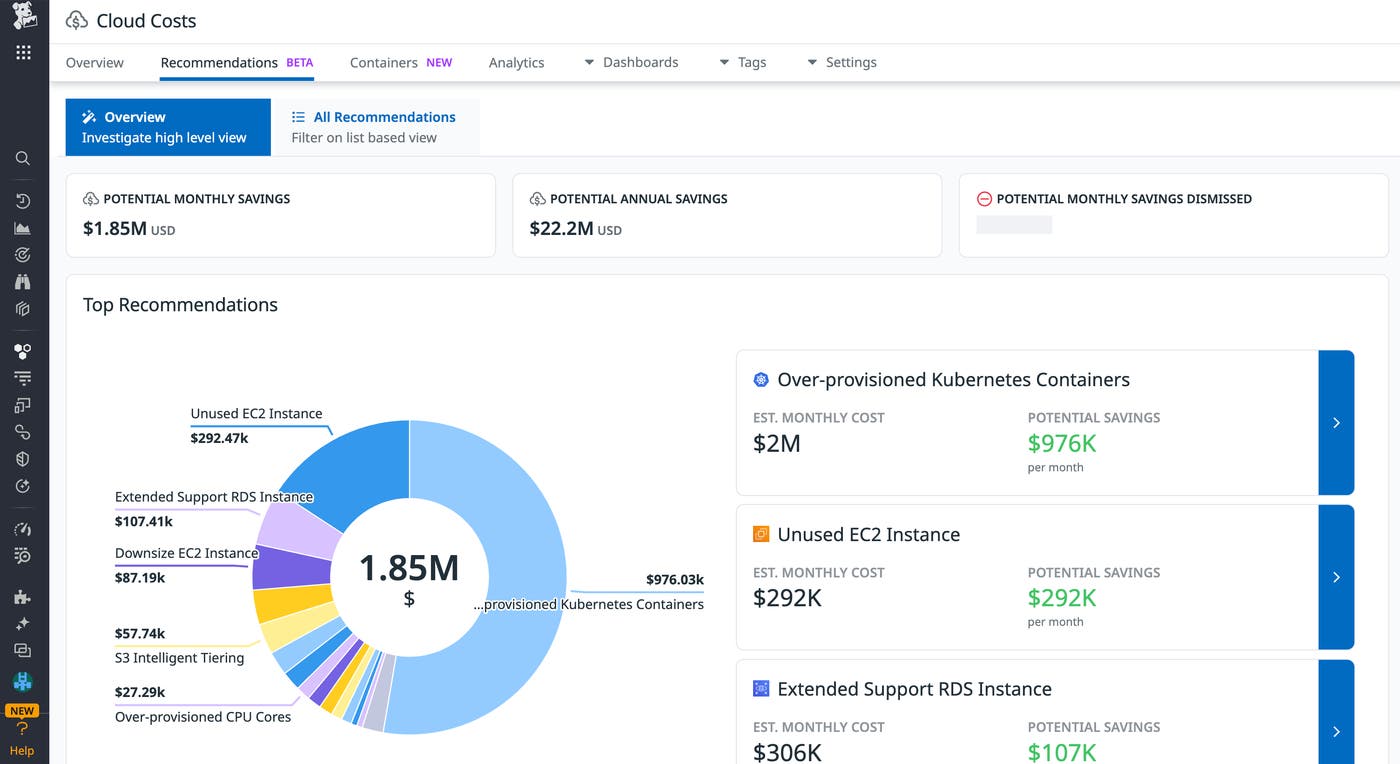
In addition, CCM is able to group cloud costs by facets such as teams. This enables engineers to monitor changes specific to their team’s cloud spend and narrow down potential optimizations to the product areas they’re responsible for. From here, they can quickly identify week-over-week increases in costs that require more granular investigation. Scrolling down, they can see their team’s costs broken down by AWS usage type, so they can pinpoint the resources responsible for the spend.
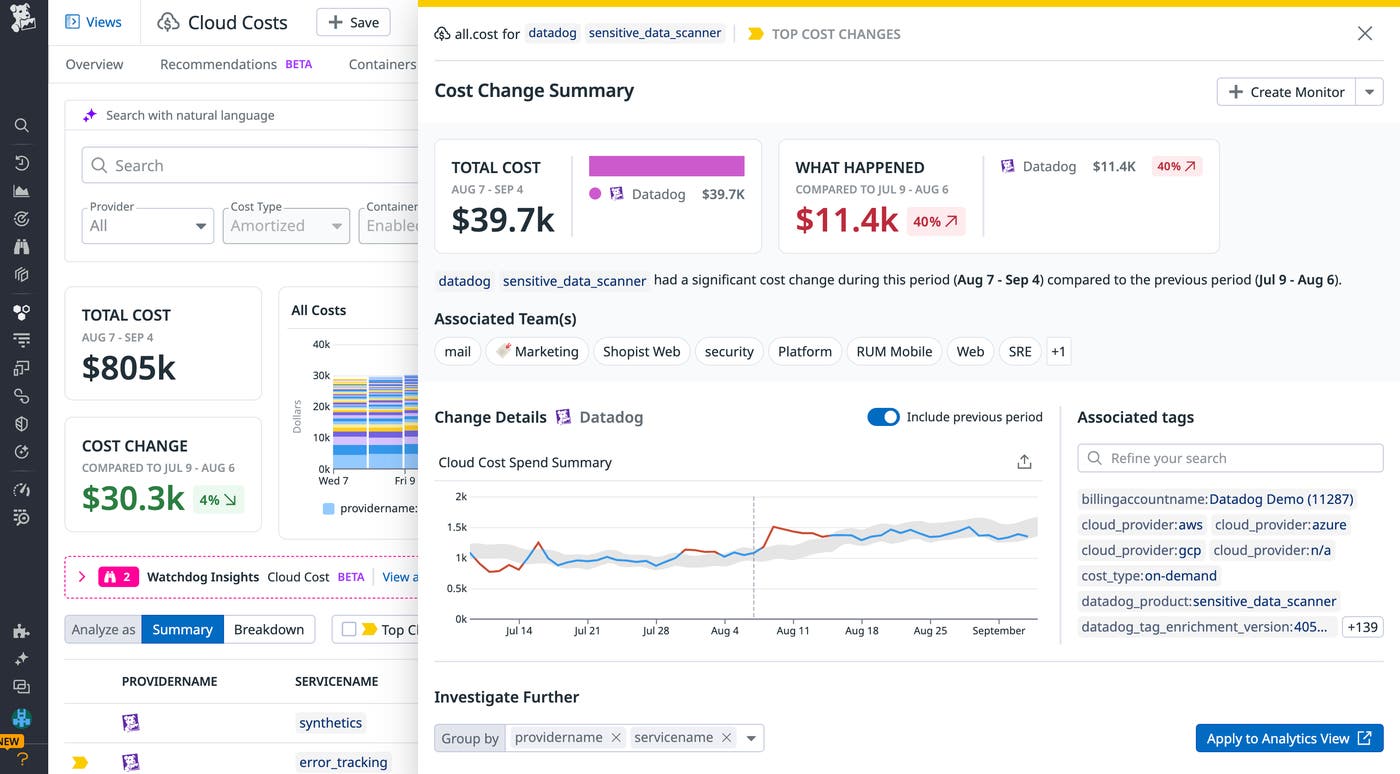
After a cost optimization is shipped, they can continue to observe the cost change of the corresponding resources for a few weeks to assess the results. To estimate the annual cost savings for an optimization, we extrapolate this data linearly over a one-year period. While our optimizations may pay greater than linear dividends over multiple years, our systems and environment are subject to constant change, so we can never be certain how long an optimization will last. It’s OK that these estimates come with room for error—their purpose is to give us a general grasp of how successful our optimization was rather than provide perfectly accurate financial data.
As your organization and systems grow, a significant amount of your cloud spend will be used on provisioning CPU and memory. This is especially true at Datadog, where we provision a vast number of hosts to collect over 100 trillion events each day. So in order to optimize the resource usage for our systems, our engineers need to break down the CPU and memory usage to specific functions and lines of code.
To accomplish this, we use the Datadog Continuous Profiler to break down each service by execution times, allocated memory, and other performance metrics in flamegraph visualizations. For example, after our engineers use CCM to identify services with week-over-week cost increases (as we previously discussed), they can navigate to the service’s CPU profile to optimize its CPU costs. In one of our performance optimizations, we were able to identify an expensive and extraneous feature flag evaluation that was exhausting 1.5 percent of our metrics intake platform’s CPU profile.
We also use CPU profiles to identify inefficient algorithms, such as an expensive metrics aggregation calculation discovered in one of our performance wins. After reworking this calculation, we were able to increase the CPU efficiency of our service and downsize the number of active replicas needed to handle production traffic, helping us reduce costs.
Another issue we’ve encountered is a high amount of CPU time being spent on garbage collection.
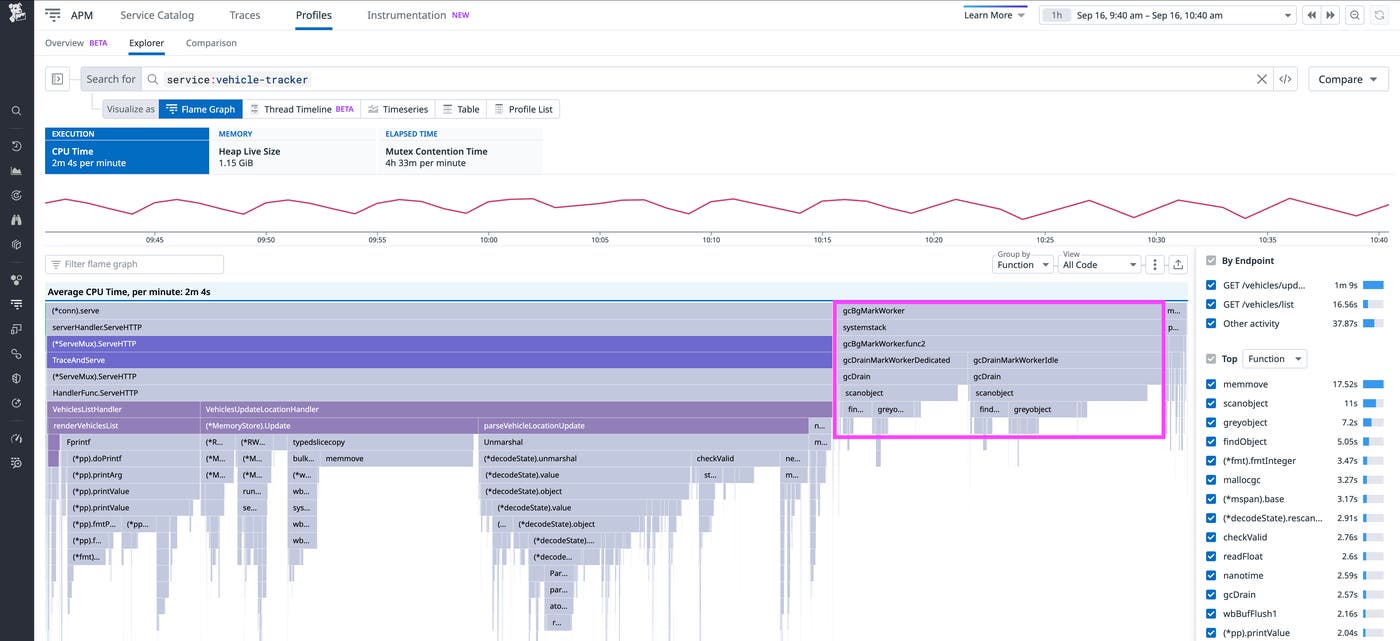
Sometimes, this can be solved by tuning the garbage collector’s settings, but it may also require investigating the service’s allocated memory profile for potential optimizations that can reduce the frequency of garbage collection.
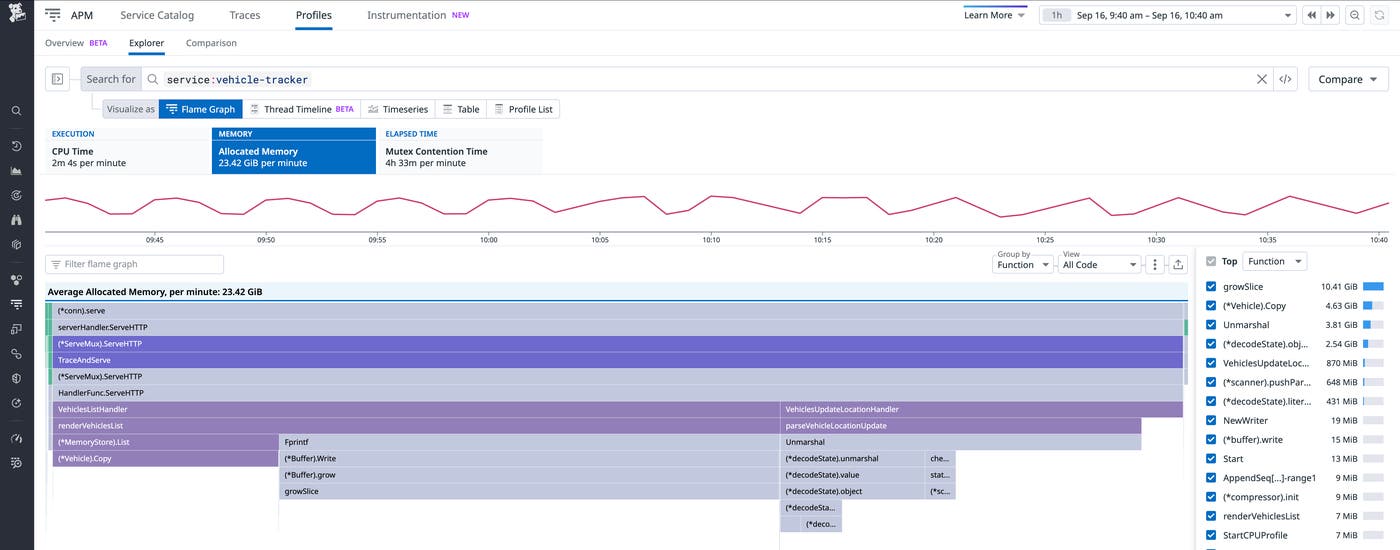
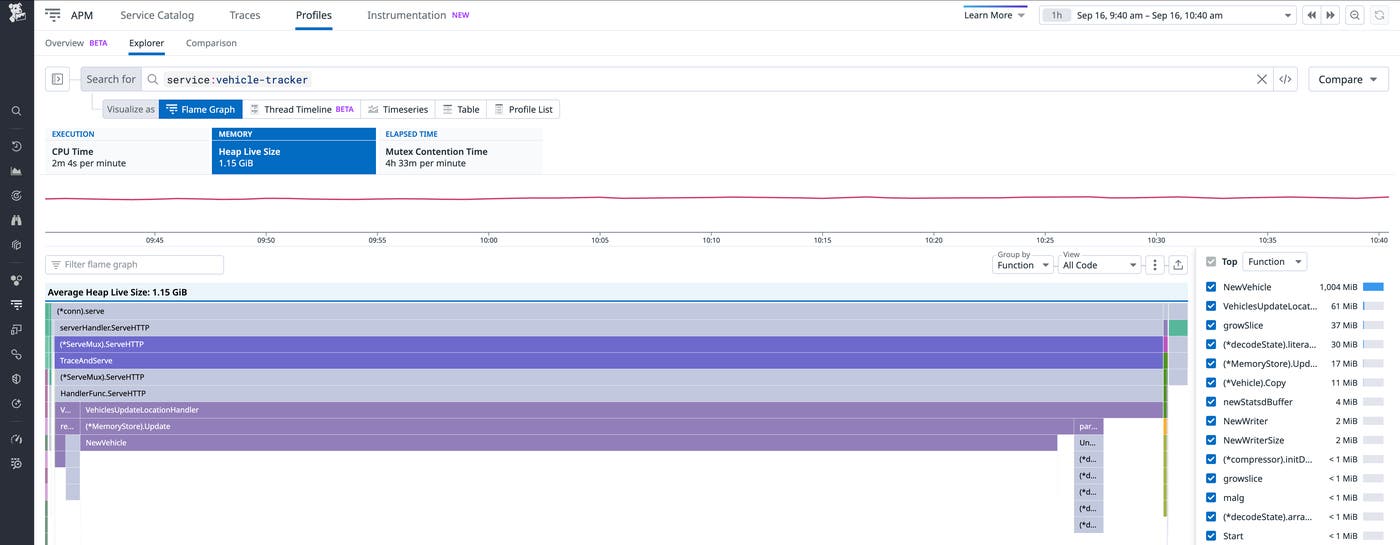
If we notice that a service’s memory utilization is much higher than its CPU utilization, we’ll navigate to the service’s live heap profile, which breaks down its memory usage. In the following example, we notice that the NewVehicle function has allocated 1 GiB of retained heap memory relative to the average heap live size of 1.15 GiB.
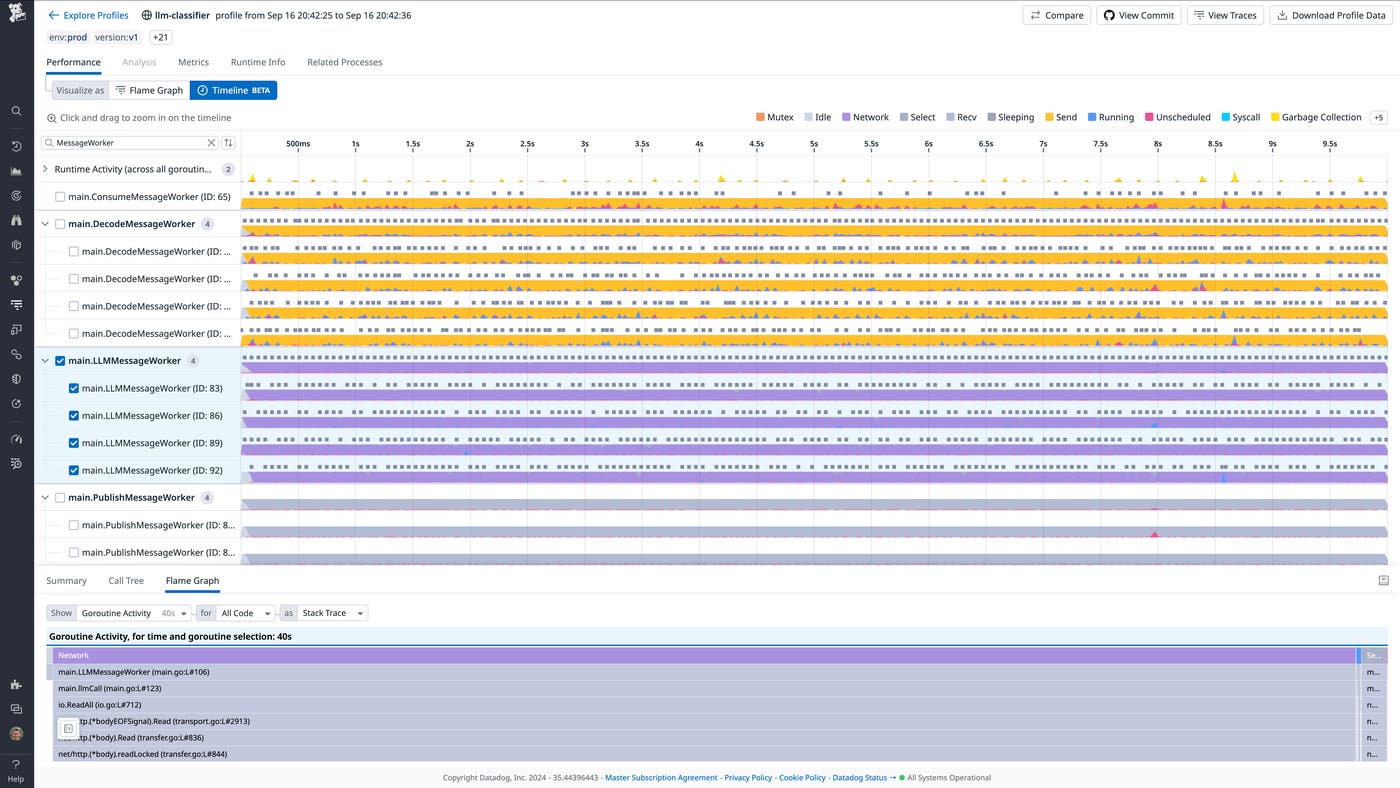
Finally, we’ve run into cost issues when high-throughput services encounter bottlenecks due to contention or undersized thread pools. To debug these situations, our engineers rely on the Profiler’s Thread Timeline, which correlates resource consumption to thread activity, thread interactions, and other runtime activity.
In the following example, our Go service llm-classifier is bottlenecked by the LLMMessageWorker thread pool, which is spending most of its time waiting on LLM responses. We can see that upstream services are attempting to send messages downstream (annotated in yellow) to LLMMessageWorker, while the downstream PublishMessageworker pools remain mostly idle (annotated in gray). By scaling up the number of goroutines in the LLMMessageWorker pool, we should be able to resolve the current bottleneck and increase the throughput of our service.
While Continuous Profiler can identify a wealth of cost-saving opportunities, engineers need to weigh potential savings against the work required to solve a performance expense. Even small changes to your environment can yield large cost savings if you’re able to correctly identify these opportunities. For example, by enabling our profile-guided optimization feature for Go, we were able to save an estimated $250,000 annually by adding a single addition to our CI pipeline build that helps the Go compiler run machine code tailored to our specific workloads.
In addition to the cloud spend of individual services, how they interact with one another and outside services can greatly impact your overall cloud spend. Datadog Network Performance Monitoring gives our engineering teams visibility into network traffic between services, containers, availability zones, and more.
Using NPM, we discovered that roughly two-thirds of all data fetched by our applications were stored in different availability zones than the one hosting the application. This data transfer across availability zones can be very expensive, possibly even more so than hosting hundreds of Kubernetes clusters and various databases.
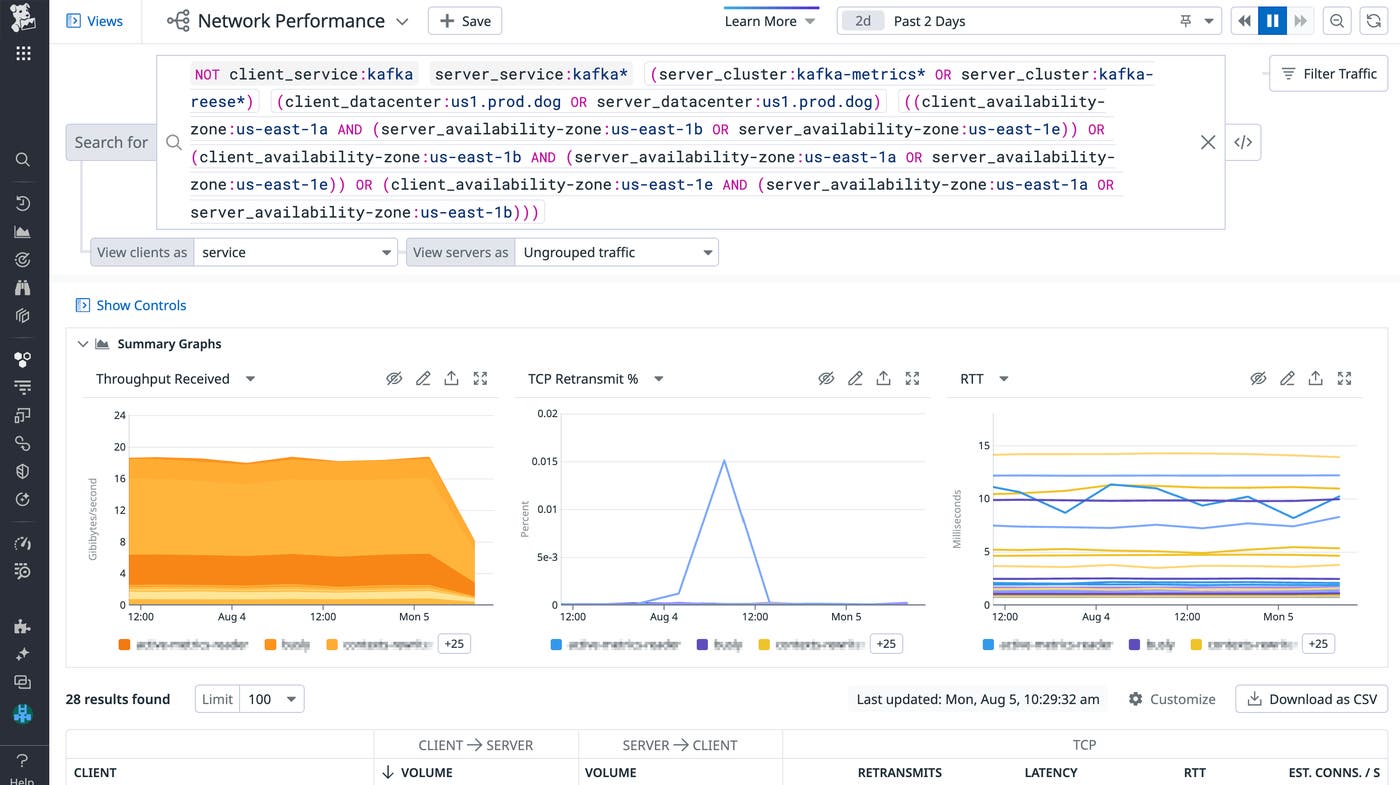
In order to address this cost, our engineers set up additional rack awareness configurations for our Kafka clients in the form of the client.rack identifier. The same data is stored in multiple availability zones—if an issue occurs in one availability zone, services should remain available by accessing data stored in a different region. With rack awareness configured, both client and server have knowledge of which availability zone they belong to. By enabling client.rack, our services were able to prioritize fetching data from a server located in the same availability zone if possible. Configuring this feature for our usage platform in our US1 region helped us to greatly reduce data consumption across availability zones and save an estimated $630,000 annually.
To start reducing your cloud spend, consider how your organization promotes and enables cost optimization work through culture and observability tooling. See our documentation to learn more about using CCM, the Continuous Profiler, and NPM. Read more about Datadog’s engineering culture and take an in-depth look at different engineering solutions in our engineering blog.
If you don’t already have a Datadog account, sign up for a free 14-day trial today.
此内容由惯性聚合(RSS阅读器)自动聚合整理,仅供阅读参考。 原文来自 — 版权归原作者所有。