

惯性聚合 高效追踪和阅读你感兴趣的博客、新闻、科技资讯
阅读原文 在惯性聚合中打开

推荐订阅源

A
About on SuperTechFans
Cloudbric
Cloudbric
C
CERT Recently Published Vulnerability Notes
G
GRAHAM CLULEY
V
Vulnerabilities – Threatpost
C
Cisco Blogs
T
Tenable Blog
P
Privacy International News Feed
T
The Exploit Database - CXSecurity.com
I
Intezer
AWS News Blog
AWS News Blog
IT之家
IT之家
博客园 - 司徒正美
C
Cybersecurity and Infrastructure Security Agency CISA
博客园 - 【当耐特】
The Hacker News
The Hacker News
奇客Solidot–传递最新科技情报
奇客Solidot–传递最新科技情报
Spread Privacy
Spread Privacy
S
SegmentFault 最新的问题
博客园 - Franky
人人都是产品经理
人人都是产品经理
cs.CV updates on arXiv.org
V
Visual Studio Blog
C
CXSECURITY Database RSS Feed - CXSecurity.com
H
Hacker News: Front Page
Latest news
Latest news
Scott Helme
Scott Helme
腾讯CDC
宝玉的分享
宝玉的分享
大猫的无限游戏
大猫的无限游戏
cs.AI updates on arXiv.org
A
Arctic Wolf
S
Securelist
雷峰网
雷峰网
The GitHub Blog
The GitHub Blog
Project Zero
Project Zero
Google DeepMind News
P
Palo Alto Networks Blog
F
Fortinet All Blogs
Schneier on Security
云风的 BLOG
云风的 BLOG
Security Archives - TechRepublic
The Last Watchdog
The Last Watchdog
WordPress大学
WordPress大学
MongoDB | Blog
MongoDB | Blog
L
LINUX DO - 最新话题
S
Schneier on Security
NISL@THU
NISL@THU
Jina AI
Jina AI
M
MIT News - Artificial intelligence

Datadog | The Monitor blog

Introducing our open source AI-native SAST Instrument and monitor Boomi integration flows with OpenTelemetry and Datadog Not all index scans are equal: How we cut query latency by over 99% Platform engineering metrics: What to measure and what to ignore Integrate Recorded Future threat intelligence with Datadog Cloud SIEM CI/CD security: threat modeling using a MITRE-style threat matrix CI/CD security: How to secure your GitHub ecosystem Ingress NGINX is EOL: A practical guide for migrating to Kubernetes Gateway API Operating agentic AI with Amazon Bedrock AgentCore and Datadog LLM Observability: Lessons from NTT DATA Introducing the Datadog Code Security MCP Capture and analyze custom heatmaps in Session Replay Understand session replays faster with AI summaries and smart chapters Monitor ClickHouse query performance with Datadog Database Monitoring How we designed empathetic alert sounds for on-call engineers Search and act across Datadog to resolve issues faster with Bits Assistant Measure the business impact of every product change with Datadog Experiments Analyzing round trip query latency Configuring JavaScript caches for better performance Introducing Bits AI Dev Agent for Code Security Datadog achieves ISO 42001 certification for responsible AI Monitor Nutanix clusters, hosts, and VMs with Datadog Monitor Juniper Mist in Datadog A new Host Map for modern infrastructure Annotate traces to improve LLM quality with Datadog LLM Observability What’s new in Cloud SIEM: AI-powered investigations, enhanced threat intelligence, and scalable security operations Explore Kubernetes with native OpenTelemetry data Monitor Oracle Fusion Cloud Applications with Datadog Announcing the Datadog Terraform provider v4.0.0 Scaling Kubernetes workloads on custom metrics How to design cloud environments for AI-powered threat analysis Monitor Aruba Central in Datadog How we centralize and remediate risks with Datadog Case Management Accelerate incident response with Datadog and ServiceNow Monitor your application and network load balancer logs Understanding Karpenter architecture for Kubernetes autoscaling Tools for collecting metrics and logs from Karpenter Monitor Karpenter with Datadog What your product data is actually saying Key metrics for monitoring Karpenter Securing Datadog’s platform in the AI age: The role of observability data Four ways engineering teams use the Datadog MCP Server to power AI agents Approaching your observability migration with the right mindset Meet the new Bits AI SRE: Deeper reasoning, twice as fast Key learnings from the 2026 State of DevSecOps study Use plain English to query your multi-cloud infrastructure in Resource Catalog Simplifying troubleshooting across the user journey with Datadog Synthetic Monitoring Protect your OCI resources with Datadog Cloud Security This Month in Datadog - February 2026 Amazon EC2 security: How misconfigured and public AMIs expand your cloud attack surface Enable end-to-end visibility into your Java apps with a single command Measure and improve mobile app startup performance with Datadog RUM Evaluating our AI Guard application to improve quality and control cost Identify untested code across every level of your codebase Make use of guardrail metrics and stop babysitting your releases Monitor Versa Networks SD-WAN performance in Datadog Improve performance and reliability with APM Recommendations Remediate transitive vulnerabilities faster with Datadog Software Composition Analysis Generate audit-ready vulnerability and compliance reports with Datadog Sheets Monitor Fortinet FortiManager performance in Datadog Improve test coverage across codebases with Datadog Code Coverage Move fast, don’t break things: Consistent testing standards at scale Enrich logs with ServiceNow CMDB context before routing to any SIEM or logging tool Monitor Lustre with Datadog Make faster, better product decisions with Datadog Product Analytics Surface and remediate runtime posture issues with Workload Protection Findings Protect agentic AI applications with Datadog AI Guard How to optimize JavaScript code with CSS Trace Google Pub/Sub workloads in Cloud Run with Datadog Detect human names in logs with ML in Sensitive Data Scanner How we cut our NLQ agent debugging time from hours to minutes with LLM Observability Debug PostgreSQL query latency faster with EXPLAIN ANALYZE in Datadog Database Monitoring Datadog acquires Propolis Unify and correlate frontend and backend data with retention filters Scale compliance across global frameworks with Datadog Cloud Security Monitor Arista VeloCloud SD-WAN performance with Datadog Building reliable dashboard agents with Datadog LLM Observability Simplify log collection and aggregation for MSSPs with Datadog Observability Pipelines Mitigation for Node.js denial-of-service vulnerability affecting Datadog APM Automate flaky test fixes with the Bits AI Dev Agent and Test Optimization How we built an AI SRE agent that investigates like a team of engineers Datadog integrations 2025 recap: Observability for AI, security, and hybrid cloud Design effective executive dashboards with Datadog Implement dbt data quality checks with dbt-expectations Bring faster visibility into AWS Lambda functions with remote instrumentation Troubleshoot faster with the GitLab Source Code integration in Datadog How Cambia Health Solutions saved $30,000 monthly with Cloud Cost Management and the Datadog Resource Catalog Normalize any logs for Cloud SIEM with Datadog's OCSF processor Optimizing Datadog at scale: Cost-efficient observability at Zendesk Detect, diagnose, and resolve network issues easily with CNM Network Health Connect engineering errors to user impact in early-stage products Cilium configuration for Kubernetes operations at scale Designing feedback loops for progressive delivery Ship features faster and safer with Datadog Feature Flags Choosing the right OpenTelemetry Collector distribution Route your monitor alerts with Datadog monitor notification rules Automate Cloud SIEM investigations with Bits AI Security Analyst Cloud threat detection: How to identify risky activity across control and data planes Collecting Kafka performance metrics Monitoring Kafka with Datadog Monitoring Kafka performance metrics
3 lessons learned from an Elasticsearch game day
Aaditya Talwai, Emily Chang · 2017-08-31 · via Datadog | The Monitor blog

Elasticsearch uses the term “master” to describe the primary node in its cluster architecture. Datadog prefers the more inclusive term “leader,” which we will use in this post.

Many companies, including Etsy, Stripe, and Datadog, run game day exercises in order to improve and maintain fault-tolerant production systems. Game days are designed to purposefully trigger failures in your services, so that you can observe how they respond in a controlled environment.

At Datadog, game days have provided a framework to help us discover weaknesses, create more useful alerts, and deploy fixes that improve the way our services respond to failures.

We recently ran a game day on one of our Elasticsearch clusters. We hope you’ll find these observations as useful as we did—and if you’re looking for a great way to test the resilience of your systems, we encourage you to run your own game day.

The game plan

First, let’s dive into some details about the Elasticsearch cluster we tested in our game day. Datadog APM traces are stored and indexed in this cluster, which runs Elasticsearch version 2.4.4. It is comprised of three distinct pools: client nodes, data nodes, and leader-eligible nodes. You can learn more about the purpose of each of these node types here. Below is a short summary of the jobs that these nodes perform within our infrastructure:

  • Data nodes hold data, i.e., traces! A trace is a collection of spans that tells a story about a single request to your application. We store traces as JSON documents, and our API docs should give you a sense of what these documents contain.

  • Client nodes are the first hop for search and indexing requests. At Datadog, a set of Go workers ingests incoming traces and sends them to the client nodes, which then route them to the appropriate data node. Search queries generated in our web layer also go through client nodes, which assemble the resulting traces and serve them to the frontend.

  • The leader node is elected from the leader-eligible pool, and is the chief coordinator for any operation that alters shared state in the cluster.

For this game day, we set out to test the following scenarios:

  1. Stopping Elasticsearch on the leader node to learn more about leader election behavior.

  2. Stopping Elasticsearch on a client node that routes read and write requests for recent data.

  3. Stopping Elasticsearch on a client node that routes write requests for long-term data.

To track how our applications responded, we collected some key health metrics—hits, latency and errors—from the services that had a known dependency on Elasticsearch. For example, we traced the requests made by our Elasticsearch Go Client to determine if our ingestion workers were having trouble persisting traces. We also watched load, free memory, and network traffic on our Elasticsearch nodes, to get a sense of how much we were stressing out the underlying infrastructure.

Lessons learned

Be prepared for 503s

Our leader-eligible pool is comprised of three nodes. At any given time, one of these nodes is the active leader. The leader node is in charge of coordinating any change to shared cluster state. For example, if you have ever had to increase the speed of shard recovery when responding to a failed data node, you probably relied on the leader node to propagate this config change to nodes across the cluster.

A leader election is, in our experience, a fairly rare occurrence, but we wanted to observe it in a controlled setting to get a sense of how our applications responded. After identifying the existing leader, we killed the Elasticsearch process on that node.

Our instrumentation gave us a uniform view of all queries landing on the Elasticsearch cluster. Crucially, APM splits up requests and errors by HTTP status code, so we had a window into exactly what responses our cluster was serving during the leader transition.
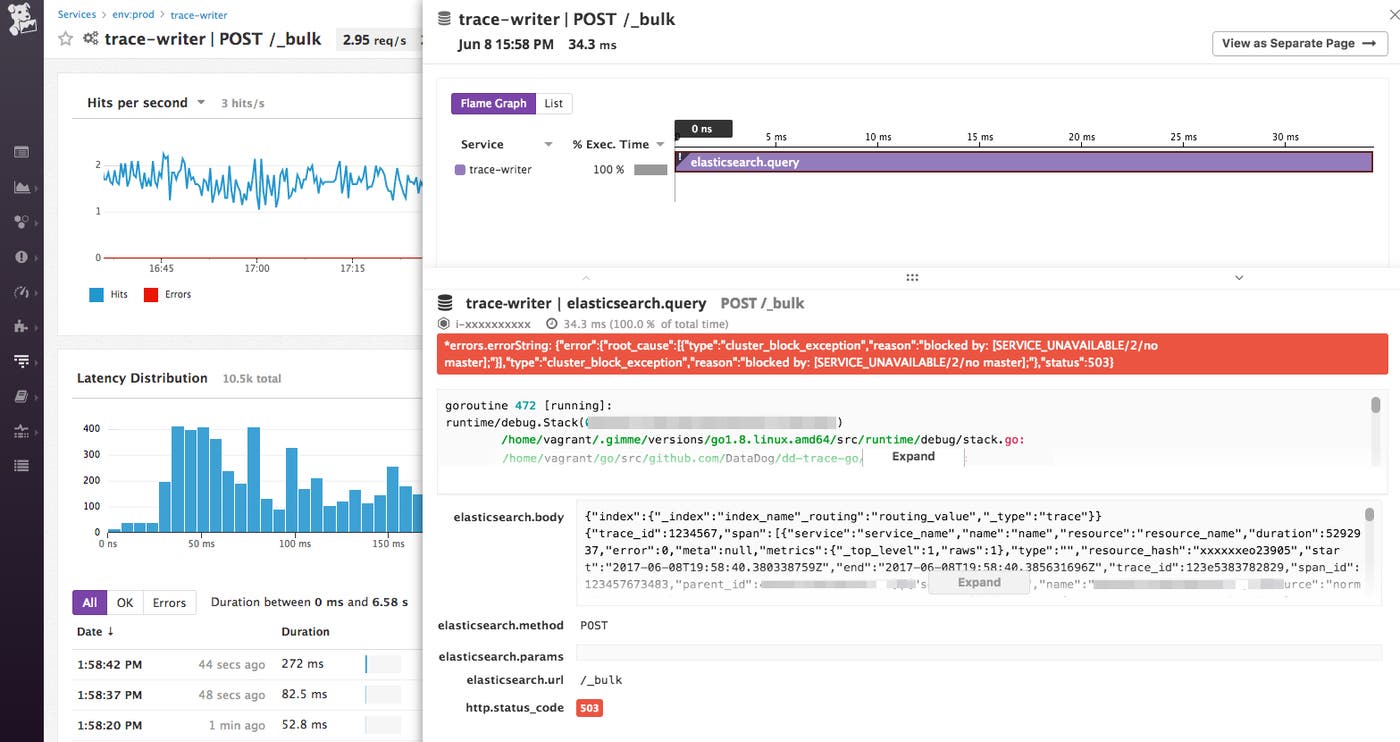
Shortly after triggering a leader election, we observed that indexing and search requests were returning 503 errors, such as the indexing request shown above.
elasticsearch game day
Shortly after triggering a leader election, we observed that indexing and search requests were returning 503 errors, such as the indexing request shown above.

For a very brief period during the leader election, we witnessed that both indexing and search requests were returning 503s. In total, this time period lasted about five seconds, a function of the ping_timeout setting in Elasticsearch’s zen discovery mechanism.

Our applications were wired to respond to 503s by buffering their requests in memory and retrying them after a small backoff. This strategy allows them to be resilient to brief periods of unavailability. Because our leader election went off without a hitch, and a new leader was chosen in a matter of seconds, our apps recovered with minimal impact.

If you’re using Datadog APM, you could instrument your app with our Elasticsearch APM integration and set up a monitor for trace.elasticsearch.query.errors{http.status_code:503, service:$MYSERVICE} to ensure that your client nodes are successfully processing requests.

Dangling indices can turn a cluster RED

It’s often helpful to manually expire indices in your Elasticsearch cluster—perhaps to keep a lid on resource usage, or to gracefully “age out” data that is unlikely to be useful to query. Elastic’s Curator is a great tool for this, and we run it in a cron job to discard indices that have exceeded a certain age.

But remember that discarding indices is a cluster-wide operation, and one that needs acknowledgment across every node. So what happens when a delete is acknowledged by some nodes but not others?

We found out mostly by accident. While we had taken down a leader-eligible node during our game day operations, our Curator job ran unattended, and deleted several indices. These deletes were acknowledged by every node except one: the downed leader.

At the time, this was mostly fine. But when we reverted to normal operations and brought our downed leader back up, our cluster went to RED as a result of several indices residing in local node metadata, but not replicated in any other node.
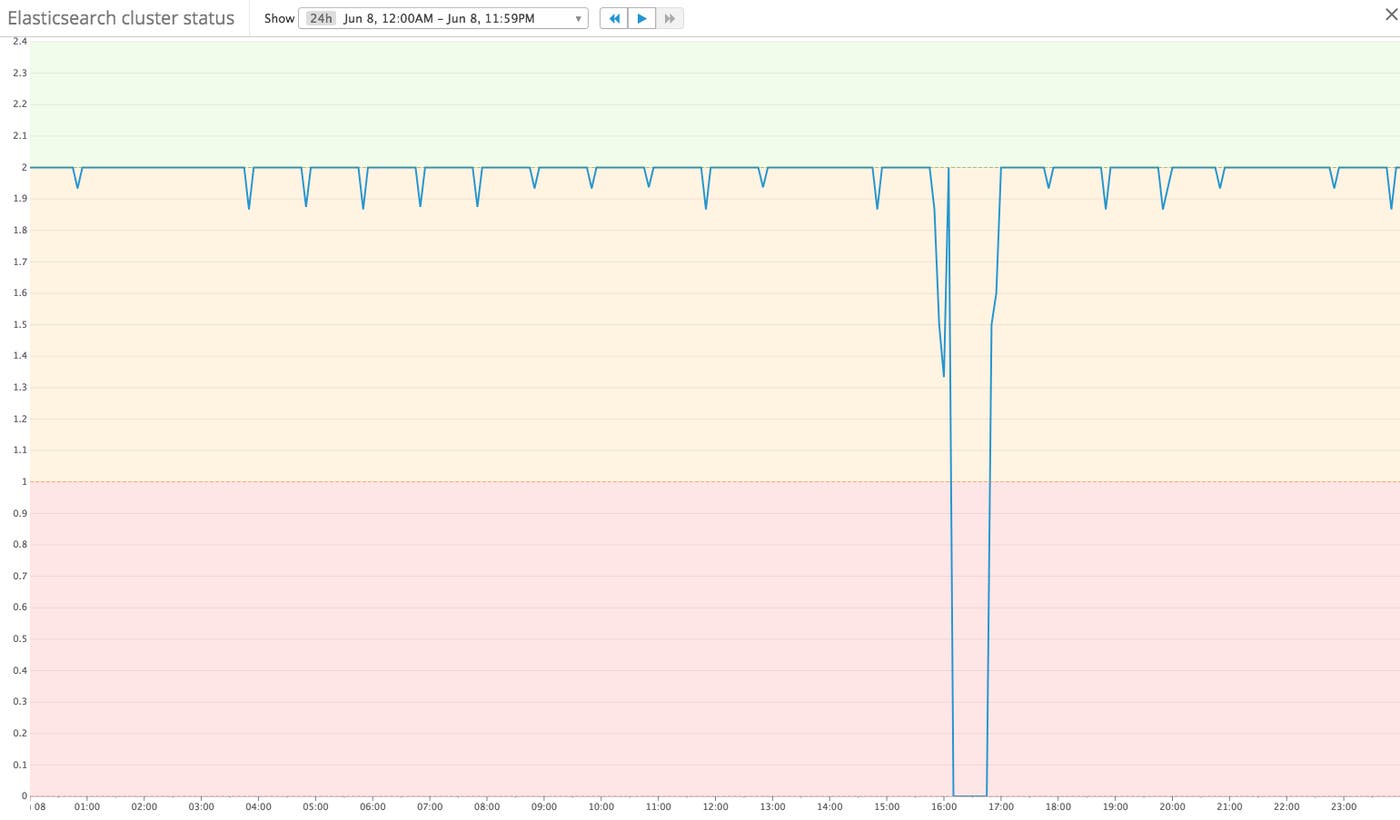
Stopping a leader-eligible node unintentionally caused a RED cluster status during our game day exercise. A background Curator job deleted expired indices while the leader-eligible node was down; once that node was brought back up, it still had local metadata about the deleted “dangling indices.” Manually deleting these indices solved the problem.
elasticsearch datadog dashboard
Stopping a leader-eligible node unintentionally caused a RED cluster status during our game day exercise. A background Curator job deleted expired indices while the leader-eligible node was down; once that node was brought back up, it still had local metadata about the deleted “dangling indices.” Manually deleting these indices solved the problem.

After a brief sanity check, and a helpful excursion through Datadog’s event stream to spot the last time our Curator job ran, we opted to delete the indices by hand, which returned the cluster to GREEN. These “dangling indices” gave us a brief scare, but Elasticsearch’s tooling made the problem obvious to us pretty quickly.

Checking the Datadog event stream enabled us to verify which indices were deleted while our leader-eligible node was down.
elasticsearch indices deleted event in Datadog event stream
Checking the Datadog event stream enabled us to verify which indices were deleted while our leader-eligible node was down.

Health checks for client nodes are key

Our Elasticsearch client pool fields the majority of our search queries originating from the web app. When you filter for a trace, or a set of traces, client nodes are the first hop to help route queries to their appropriate shard. Depending on how the data is placed, they may also compose results as they are retrieved from their respective shards.

When using a client-data-leader cluster split, as is recommended for Elasticsearch, client nodes are also the way you address the cluster. We pass our applications a list of client node IPs so they know where to send their requests. But static IPs have their downside—they couple your application to a specific set of nodes that can go up and down arbitrarily (and in this case on the whim of a rogue developer).

Regular health checks for client nodes are key. We were expecting that this exercise (taking a client node down) would have more of a negative impact on request routing, but we were surprised to find that our cluster handled the failure quite well. We realized that this was because we were using the olivere/elastic client, which automatically embeds a simple ping check in the application layer. As such, our apps quickly dropped the downed client node from their active pool, and restricted queries to the remaining healthy nodes.

But not all Elasticsearch drivers have built-in health checks—indeed, our home-rolled Python client (which we use elsewhere in Datadog) was much less clever. Thanks to this game-day observation, we transitioned all of our Elasticsearch client nodes to a Consul-backed DNS addressing scheme, to avoid having to concern our applications with figuring out which nodes were healthy. In our new setup, Consul is in charge of pinging our client nodes to check their health, and only healthy IPs are exposed under the trace-es-client DNS name. Our apps now point to this DNS name, rather than to static IPs, and are more resilient to nodes dropping in and out of the client pool.

Game day pointers

This game day offers just a few examples of the types of situations you could test in your own environment. Running a game day is a great way to test and identify vulnerabilities in your systems, and determine if you need to tweak existing alerts and/or create new alerts to notify you about important issues.

When we conclude a game day, we’ve found it’s useful to summarize our findings in a standardized format, to make it easier for others to digest:

  • The scenario: What you’re testing and how you triggered those scenarios.

  • Expected results: How do you expect the service to react?

  • Actual results: How did the service actually react? What went well? And what didn’t go so well?

  • Follow-up actions: Checklist of fixes or to-dos to address vulnerabilities or blind spots you uncovered, as well as any scenarios you plan to investigate further in future game days.

We hope we’ve inspired you to go forth and run your own game day exercises—if they’re anything like ours, you’ll uncover valuable insights about your systems, and have a lot of fun doing so.