







Jesse Mack

Prashant Jain

Nasir Qureshi
Sr. Product Marketing Manager, HiveMQ
Large IoT environments are highly complex and comprise multiple layers of disparate devices that must move data between each other, across potentially unreliable connections. Having visibility into each layer of your IoT environment is critical for quickly identifying problems with your deployment that could negatively impact user experience.
HiveMQ is an open source MQ Telemetry Transport (MQTT) broker for enterprise-scale IoT fleets that provides secure, reliable data transfer between connected devices and downstream applications and services.
Datadog’s HiveMQ integration collects metrics and event logs from HiveMQ and provides out-of-the-box dashboards that help you visualize and alert on key data such as connections, disconnects, and message throughput. This provides a baseline of visibility into the health of your IoT infrastructure—but it’s also critical to have insight into the performance of the applications and workloads that are actually running in your environment.
To provide visibility into your IoT applications, HiveMQ’s Distributed Tracing Extension enables users to instrument their workloads to generate OpenTelemetry-formatted distributed traces, which track application processes from end to end throughout your environment. By sending these traces to Datadog, you can use Datadog Application Performance Monitoring (APM) to provide greater insight into the performance of applications running on your connected devices for more effective troubleshooting and root cause analysis.
In this post, we’ll look at how HiveMQ’s extension and OTel support provide enhanced IoT observability across your environment, and how you can use Datadog to get full visibility into the health and performance of your distributed IoT applications.
Using the official OTel API, HiveMQ has enabled its broker to create spans and traces. Now, users can instrument the HiveMQ broker (V. 4.9x) and the HiveMQ Enterprise Extension for Kafka according to OTel specifications. In addition, the Distributed Tracing Extension adds tracing capabilities to the HiveMQ MQTT broker and its integrations.
The extension traces all sent/received MQTT PUBLISH messages in the HiveMQ broker and sent/received Kafka records in the Kafka Extension. In the broker, tracing support is included for actions such as PublishInboundIntercepors, PublishOutboundInterceptors, and PublishAuthorizers. For the Kafka extension, traces are generated when Kafka records for mappings and transformers are sent and/or received. You can also collect metrics on latency and the number of exceptions.
These capabilities allow you to bring MQTT visibility to an APM solution like Datadog. For instance, with this extension, you can see exactly how long the HiveMQ MQTT broker takes to process a request. The insights you gain can help you speed up root cause analysis, improve mean time to resolve (MTTR), and increase the mean time between failures (MTBF) across your distributed architecture.
Because Datadog supports OTel metrics, logs, and traces, HiveMQ and Datadog customers can now use Datadog APM to monitor OTel-instrumented distributed traces from IoT applications connected to the HiveMQ broker.
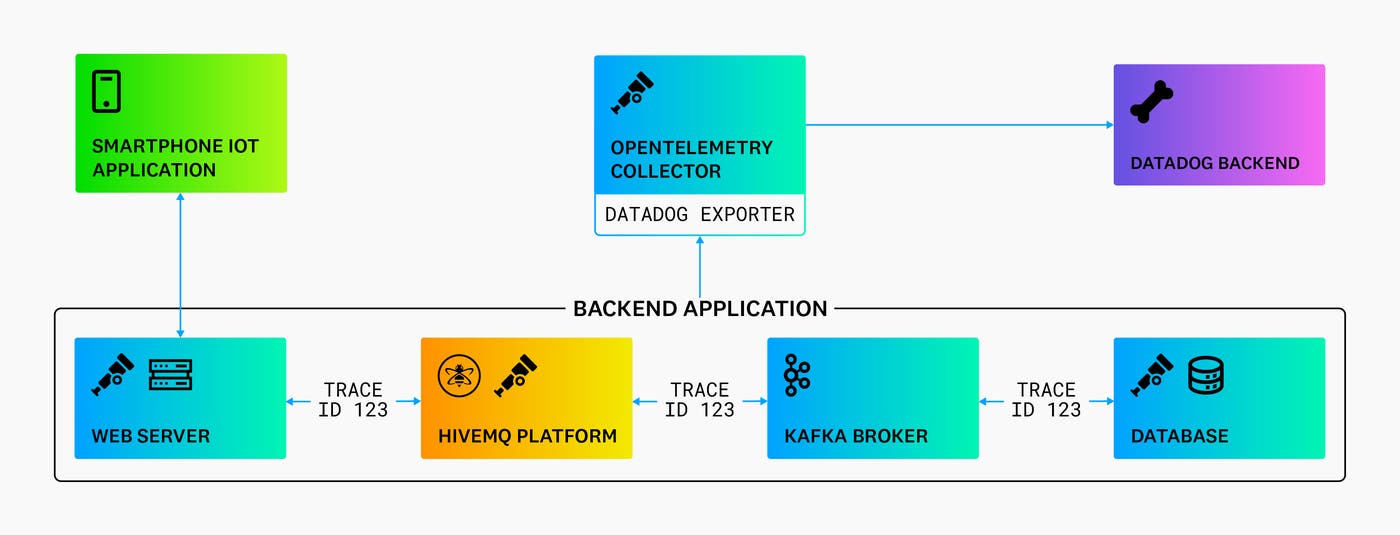
To start monitoring these traces in Datadog, first enable the HiveMQ Distributed Tracing Extension. This sends your traces to the OTel Collector. From there, use the Datadog Exporter to forward your OTel SDK traces to Datadog. Once the distributed traces start transmitting to Datadog APM, you can visualize and query them from the Trace Explorer to gain enhanced visibility into performance issues with your IoT applications.
These combined capabilities of HiveMQ’s OTel-instrumented traces and Datadog’s support for OpenTelemetry allow you to:
Quickly spot issues in IoT application performance
Identify root causes and reduce time to resolution
Remediate user experience problems and increase customer satisfaction
Understand how your IoT applications interact with each other within your broader infrastructure
Learn more about IoT observability at the HiveMQ blog. You can also enable the Datadog HiveMQ integration to send HiveMQ metrics and event logs to Datadog, and learn more about Datadog’s support for OpenTelemetry. If you aren’t yet a Datadog customer, sign up for a 14-day free trial to get started.
此内容由惯性聚合(RSS阅读器)自动聚合整理,仅供阅读参考。 原文来自 — 版权归原作者所有。