





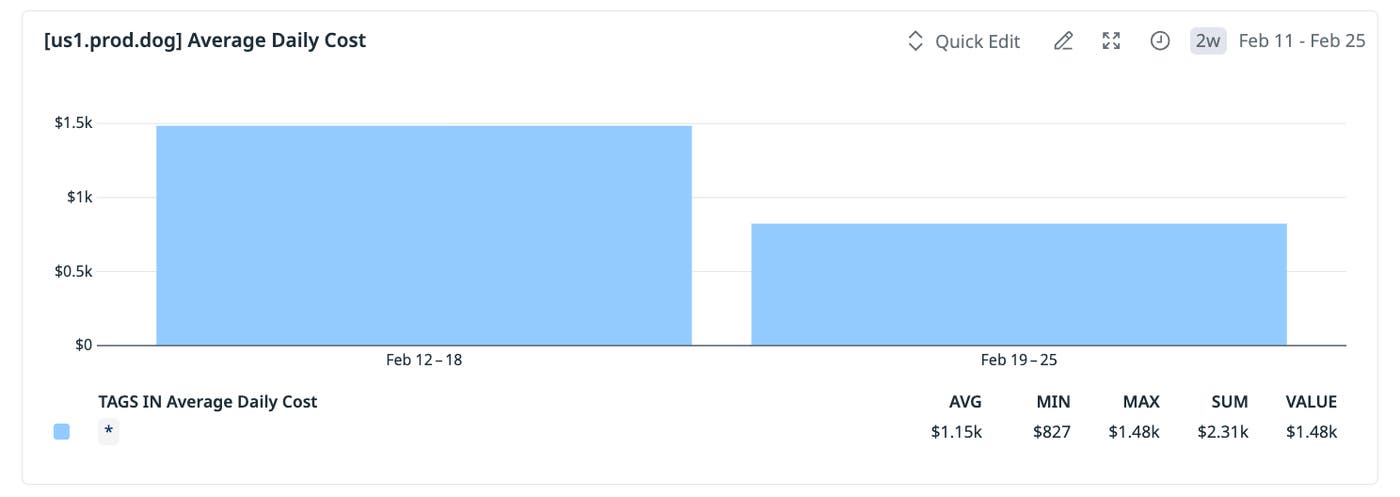
Spark jobs only get more expensive and harder to debug as they scale. It’s a problem we’ve run into ourselves. Our Referential Data Platform team builds and maintains the knowledge graph that maps relationships between customers’ observability entities. ServiceQueryEdge is at the center of that graph, mapping service entities to their associated metric and log queries. It runs daily across seven datacenters, with individual partitions processing up to 27 TB of input and 16 billion records. At that scale, we were averaging $1.5k of infrastructure costs daily, with each run taking over 17 hours.
AI agents seemed like a natural fit for this problem. They’re good at reasoning over code, connecting symptoms to root causes, and generating hypotheses quickly. But an agent working from code alone is still guessing. It needs to know what’s actually slow.
In this post, we’ll walk through how we used Datadog’s Data Observability Jobs Monitoring and an AI agent built on Claude to debug and optimize ServiceQueryEdge. We’ll cover what worked, what didn’t, and the specific changes that cut our daily compute costs by 44% and reduced run duration by 60% in US1, our largest data center.
To understand where inefficiencies are, we rely on Jobs Monitoring with the Spark SQL Plan to get a visual, interactive representation of the full execution plan. However, even with that visibility, correlating a slow operator in the SQL Plan back to the relevant section of application code can still take time, particularly for a large, complex job like ServiceQueryEdge.
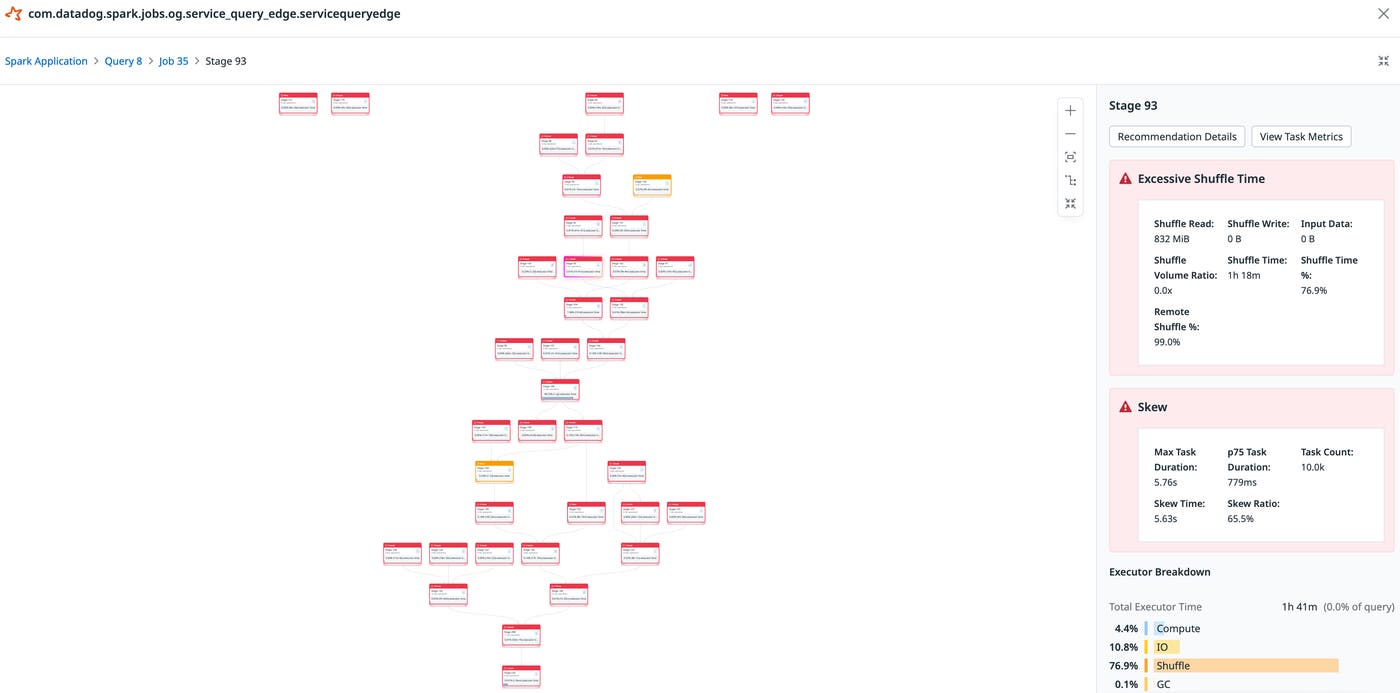
To speed up debugging, we built an AI agent to surface any bottlenecks across the execution graph and suggest fixes. We created a custom prompt structure that ingests the same data shown in Jobs Monitoring, such as stage metrics, the SQL execution plan, and telemetry data, alongside the source code. This allows the agent to perform correlation work that would usually fall on one of the team’s engineers, saving up to hours of manual investigation. For every issue the agent flags, the engineer lands directly at the relevant node with context on why it matters.
At first, we ran into problems with Claude depleting its context while making Model Context Protocol (MCP) calls through our Datadog MCP Server to collect Spark data from Jobs Monitoring. The agent pulled job run telemetry data, represented as traces, using the get_datadog_trace, apm_search_spans, and apm_explore_trace tools. Multiple runs made the problem worse. The agent exhausted its context window before completing meaningful analysis. Suggestions became incomplete or incoherent.
We alleviated this by using subagents that delegated the acquisition of specific information into targeted tasks, preserving context for the analysis work that actually mattered. Agent output quality depended less on data volume than on how precisely that data was scoped.
However, the agent’s initial suggestions didn’t work. Many recommendations were either off target or addressed symptoms rather than root causes. For example, the agent suggested pruning column reads to reduce data read in, which was redundant because Spark had already handled that optimization.
Our first instinct was to try reducing the noise by feeding deeper embeddings of Spark runtime info and metrics from Jobs Monitoring into the agent. The additional context helped the agent identify more issues and generate more recommendations. But false positives also increased significantly.
Our next step was to add another subagent that filtered issues we deemed irrelevant or perfunctory. The validator works as a grader rather than a generator. It pulls the same context as the main agent, job health and the SQL plan, but its job is to find reasons a proposed fix won’t work.
Optimization #2: Apply spam filter before the main join (line 766)
Contraindication Checks:
1. ❌ Does the spam filter actually reduce significant rows? — The LeftAnti join outputs 3,406,939,340 rows — same as the left input (3,406,939,340 from the
Exchange). This means the 628 spammy metrics contribute near-zero rows to the 3.4B total. The spam filter removes metrics by (org_id, metric_id) but the main join key
is (org_id, metric_name). Even if these 628 metrics were removed earlier, the 3.4B metrics-side of the main join would barely decrease.
2. ✅ Is the filter already applied before the main join? — Looking at the data flow: metricsWithTagsRaw → spam filter → metricsWithTags → salt →
metricsWithTagsSalted → main join at line 766. The spam filter IS already applied before the main join in the code.
3. ❌ Would earlier filtering help? — The spam filter requires a groupBy($"org_id", $"metric_id").agg(countDistinct(...)) over the full metricsWithTagsRaw. This
aggregation itself is expensive. Moving it "earlier" doesn't change the fact that you need the full dataset to compute the counts.
SQL Plan Evidence:
- The SortMergeJoin (LeftAnti) outputs 3,406,939,340 rows — virtually identical to its 7,431,377,983 / 2 input (accounting for the join filtering ~half). The 628
metrics removed have negligible impact on downstream volume.
Impact Assessment:
- The spam filter already runs before the main join in the current code flow (lines 737-754 before line 766)
- The 628 removed metrics represent a tiny fraction of the 3.4B rows
Recommendation: ❌ Do not proceed — The spam filter already runs before the main join. The 628 removed metrics have negligible impact on the downstream 3.4B row
count. This optimization is based on an incorrect assumption about the ordering.
For each optimization type, the validator checks a specific set of contraindications. Some checks are about whether the fix actually addresses the measured bottleneck. Others look for cases where Spark is already handling the issue automatically or where the fix could introduce new problems downstream. It also checks whether the root cause originates upstream of the flagged stage rather than in the stage itself.
The validator also estimates the potential impact of each fix, using stage CPU contribution and bottleneck type to rate proposals as high, medium, or low priority, so the main agent can rank what to tackle first. The contraindication list is updated to encode team knowledge directly into the validation step. When the same poor recommendation kept surfacing, we added a rule to catch it.
This pattern of using a second agent consistently helps identify gaps the original agent missed and refines suggestions to get to a fix that works.
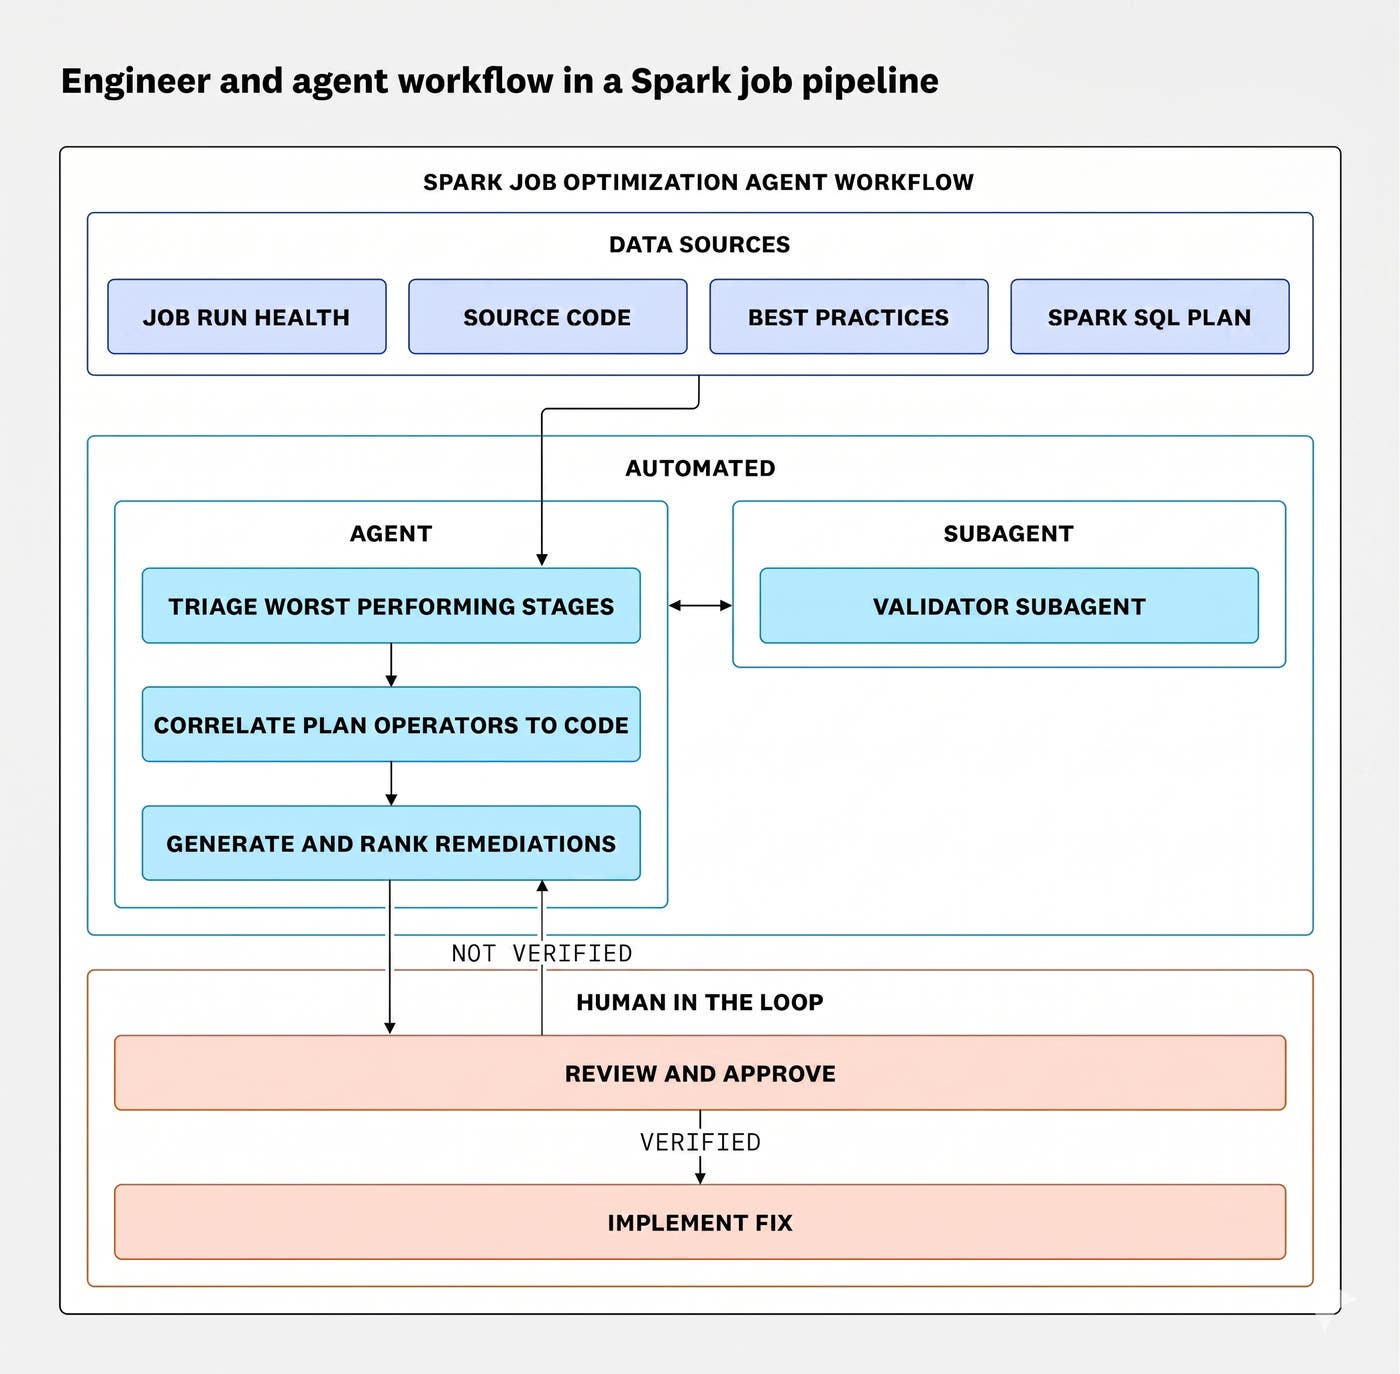
From here, the agent acted as an effective debugging companion. It drew connections that would have taken hours to surface manually. For example, it mapped a slow shuffle operation in the execution plan back to a specific transformation in the code and flagged a join pattern worth trying as a broadcast hint.
Once we worked with the subagents to output the relevant context, the agent yielded three primary recommendations for improvement:
Removing redundant aggregation
Replacing a sorted join with a broadcast join
Fixing improper salting
To validate our changes efficiently, we built a dashboard using Jobs Monitoring data that compared key performance metrics, such as executor time, skew, shuffle, memory, and overall duration. This helped us summarize and evaluate results.
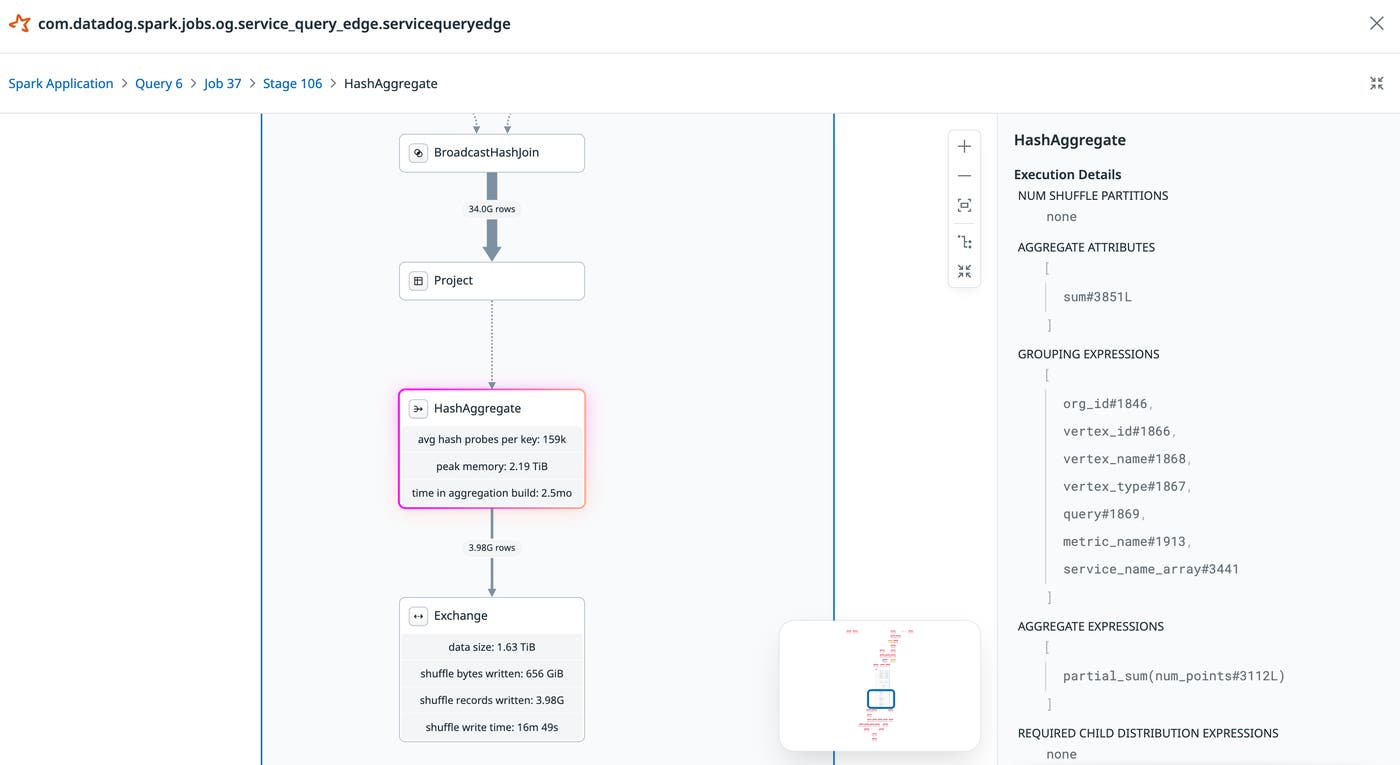
Jobs Monitoring indicated that Spark was performing a HashAggregate operation when joining queryVertices and metricsWithTag, despite no explicit aggregate instruction. The agent traced this back to a distinct() call, which was redundant given the structure of the upstream data.
The agent also identified that every downstream stage performed the same aggregation on the joined data. Those rows were being shuffled unnecessarily before reaching an identical aggregation step.
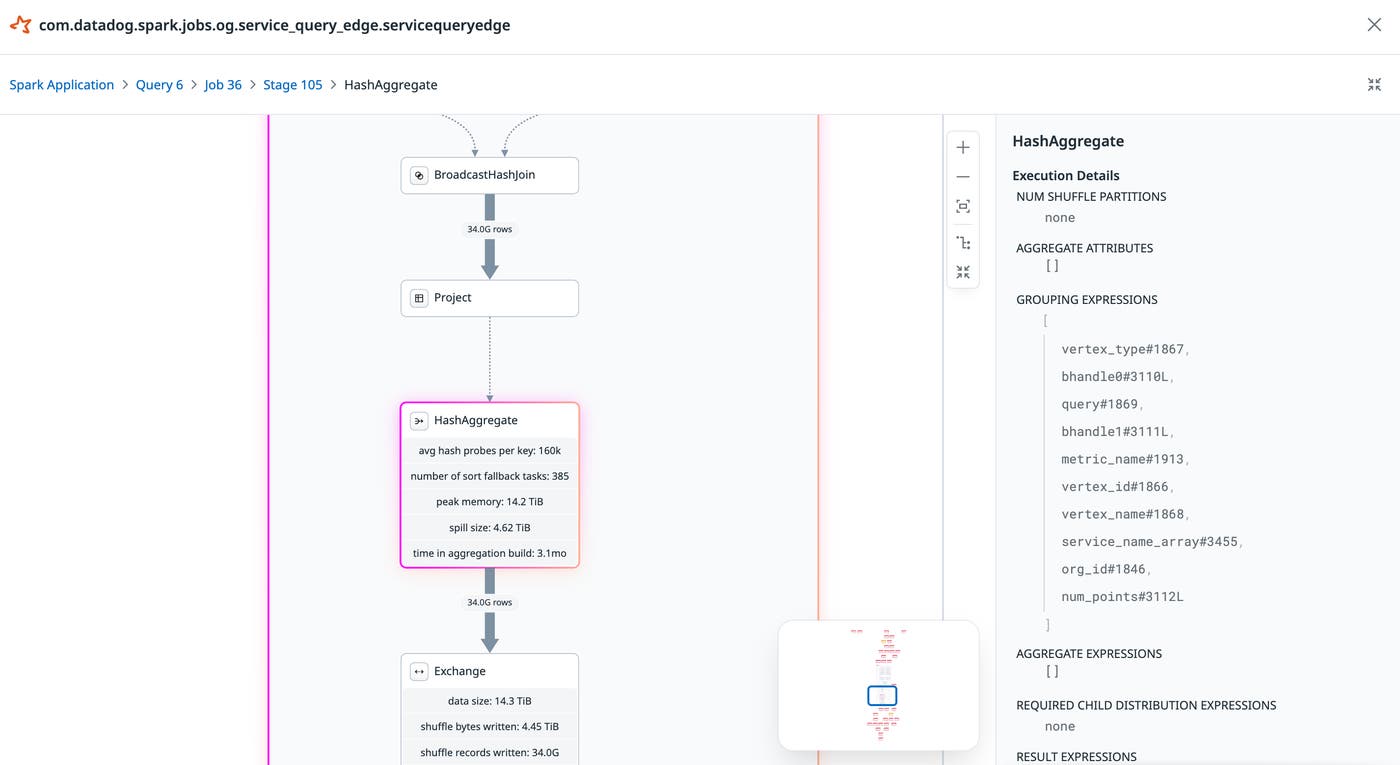
We decided to aggregate the data early to reduce the number of rows shuffled, saving CPU and network I/O. This reduced the number of rows being sent to the subsequent stages to less than a tenth of the original size on some shards.
Next, the Spark SQL plan indicated a left_anti join between a table of around 500 rows and another of over seven billion rows. Spark defaulted to a SortMergeJoin strategy, forcing a sort of the entire multi-billion-row table. We attempted to change this to a broadcast join to avoid that sort entirely.

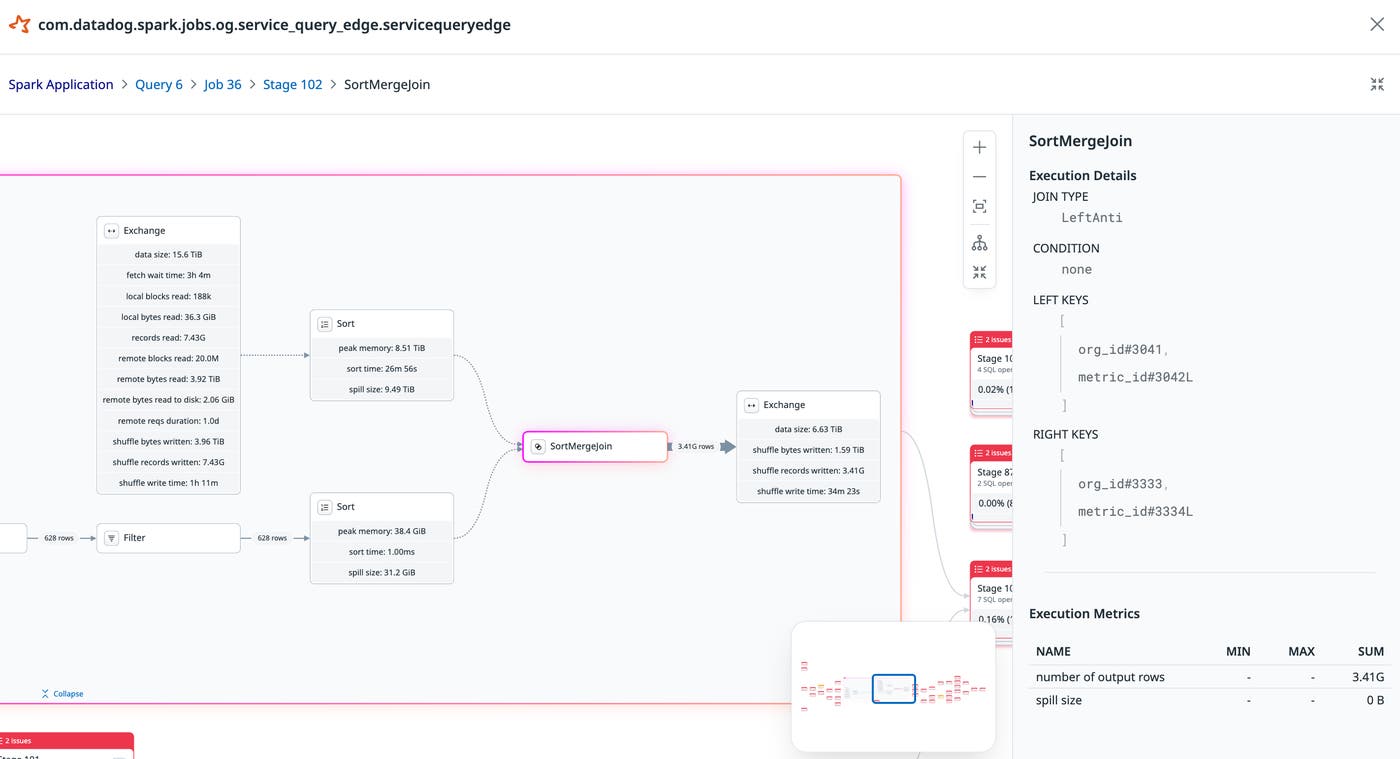
🥈 #2 Bottleneck: Context Spam Filter / LeftAnti Join (Stage 2137998469030960929)
Duration: 16 min | CPU: 24.4 hours | Spill: 14.3 TB memory, 3.6 TB disk
This stage runs the spam filtering at ServiceQueryEdge.scala:737-754:
val metricsToSkipDf = metricsWithTagsRaw
.groupBy($"org_id", $"metric_id")
.agg(countDistinct($"bhandle0", $"bhandle1") as "contexts_count")
.filter($"contexts_count" > contextSpamThreshold) // threshold = 2,097,152
The Sort node before the LeftAnti SortMergeJoin spills 10.4 TB sorting 7.4B rows. The right side (628 spammy metrics) is tiny but the left side is massive.
Recommendations:
1. Use a broadcast for the spam filter — Only 628 metrics exceed the threshold. Broadcast the spam list and use a BroadcastHashJoin instead of SortMergeJoin to avoid the 10.4 TB sort
spill.
2. Apply spam filter earlier in the pipeline — Filter before the expensive salt/join rather than after, to reduce downstream row counts.
The initial impact of this change appeared marginal in isolation. We suspected this was because the persistent data skew in the worst stage was limiting its effectiveness. Once we addressed the skew in the following step, the broadcast join contributed meaningfully to the overall gains. This is worth noting as a reminder that optimizations don’t always surface their full value immediately. Improvements that appear incremental on their own may unlock headroom that a later fix will realize. When isolating and quantifying the impact of individual changes, the order in which they are applied matters.
As mentioned earlier, the Spark Plan UI and agent recognized a large data skew and suggested increasing salting values, which did not directly resolve the issue. The agent had enough signal from the stage metrics to identify that skew was the problem, but lacked the context to understand the salting implementation that caused it. The fix only surfaced when an engineer manually added context about the implementation. This showed that agents reason best when given complete context.
While dropping the bhandle* columns, we identified a flaw in our salting logic.
Our salting logic was creating salts by applying modulus to a skewed column, which meant the resulting salt values inherited the same non-uniform distribution.

We switched to using rand() instead, which breaks the dependency on the skewed column and distributes rows uniformly across partitions. Once this change was in place, the earlier suggestion of increasing salting values worked as expected. Duration skew on the worst task significantly improved from a max-p50 of 25 minutes to around 10 minutes, and the overall duration fell over 57%.

In the week following deployment, cloud cost monitoring confirmed the impact directly. Daily compute costs for ServiceQueryEdge dropped from an average of $1.5k per day to approximately $830 per day, a 44% reduction. In our US1 datacenter specifically, run duration fell by 60% and allocated executor time dropped by nearly 50%.
At a pre-optimization annual cost of approximately $600k in US1, these gains represent an estimated $250k in annual savings from that datacenter alone. Across all other datacenters, which account for roughly $120k per year in compute costs, the same optimizations project an additional $50k per year in savings. Further cost reductions are expected as cluster pods are right-sized to reflect the lower peak execution memory requirements, though that impact has not yet been quantified.
From our experiment, we found that treating AI agents as collaborative partners rather than autonomous problem solvers produced better outcomes. Deeper optimizations emerged that neither the team nor the agent would have reached independently. The agent’s value came not from producing ready-made answers but from surfacing connections across the execution plan that pointed engineers toward the right questions. Structuring the agent’s access to data deliberately, starting broad and retrieving fine-grained detail only where needed, was as important as the analysis itself.
This principle directly informed how we built the latest Spark tools for the Datadog MCP Server. Rather than exposing everything at once, we built two purpose-scoped tools. get_spark_health returns the overall health of a Spark job and its worst-performing stages, giving the agent a ranked starting point without overwhelming its context. get_spark_sql_plan retrieves the low-level execution plan and stage metrics for a specific trace, allowing the agent to go deep once the right stage has been identified. A sample prompt may look like:
“Help me optimize the <job name> Spark job. Evaluate its performance over the past day using get_spark_health. Look at the worst stages, correlate them with the code at <repo path>, and retrieve the associated execution plans using get_spark_sql_plan. For the worst stage, create hypotheses for the root cause and discuss them with me.”
You can also include a Markdown file of your team’s known Spark patterns so the agent validates any proposed fixes against existing standards.
The Datadog MCP Server is generally available. Its data-observability toolset is in Public Preview and includes the Spark tools used in this post. Configure the toolset to bring Data Observability Jobs Monitoring data into your own agentic debugging workflow.
To get started with Jobs Monitoring, use our documentation or sign up for a 14-day free trial.
此内容由惯性聚合(RSS阅读器)自动聚合整理,仅供阅读参考。 原文来自 — 版权归原作者所有。