


If you serve LLMs on Kubernetes without inference-aware routing, your load balancer is likely wasting inference capacity. Generic HTTP traffic management blindly routes requests, assuming the backends in your cluster are interchangeable. But your model-serving backends are stateful and unevenly prepared to handle any given request. As a result, requests are often routed to the backend that’s not the one best suited to respond.
Migrating to Gateway API gives you a more capable foundation for traffic management and opens the door to inference-aware routing. The Kubernetes Gateway API’s Inference Extension routes requests based on backend serving state, which tends to make better use of cluster capacity and reduce request latency.
In this post, we’ll look at how the Inference Extension works, the routing strategies it enables, and the signals you can use to monitor whether inference-aware routing is behaving as intended in production.
The Inference Extension improves on conventional HTTP routing for generative LLM workloads by evaluating each backend’s current serving state before selecting an endpoint to receive the request. Standard load balancers were designed for high volumes of uniform web traffic and default to distributing requests evenly. But because LLM inference workloads are highly variable in their request rate, compute cost, and duration, distributing requests efficiently requires assessing the state of each available backend. The Inference Extension looks at signals such as Key-Value (KV) cache state, Low-Rank Adaptation (LoRA) adapter availability, and queue length to identify an optimal target for each request. For example, a backend with a short queue can process a request sooner, and one with a ready KV cache can avoid recomputing the shared portion of a prompt.
Managing and monitoring this environment requires understanding three interconnected phases of the request lifecycle: the gateway’s initial routing, the Endpoint Picker’s (EPP’s) endpoint selection (and flow control), and the underlying model serving.
As the cluster’s first point of contact for incoming LLM traffic, the gateway validates the request by matching it against the expected hostnames and rules defined in your HTTPRoute object. Once the gateway has validated the request, it extracts the target model either directly from the request’s path or headers, or by using a Body-Based Router (BBR) if the model is specified within the JSON payload.
The gateway matches the extracted model name to its corresponding InferencePool—an object representing the pods that act as model servers. Whereas a standard gateway would route the request by using a generic algorithm such as round-robin, the Inference Extension directs the request to a backend in the pool that’s optimally prepared to process it. Because individual pod readiness constantly fluctuates, the gateway avoids blind routing and delegates the complex task of endpoint selection.
To determine exactly which pod within the InferencePool should receive the request, the gateway pauses and consults the pool’s dedicated EPP. Because production inference scheduling is highly complex, the ecosystem decouples the core Kubernetes routing APIs (such as the InferencePool and HTTPRoute objects ) from the advanced endpoint selection logic. The gateway uses Envoy’s ext_proc (external processing) filter to pass information about the request to an advanced EPP—typically powered by a dedicated, production-grade scheduler like the CNCF llm-d project—which makes the intelligent, inference-aware routing decision.
The EPP first checks the request’s payload size and rejects it if it exceeds the pool’s configured capacity limits, throwing a 413 Payload Too Large error. It then identifies the optimal target by continuously evaluating telemetry exposed by the model servers. The EPP balances several signals to score and select the best backend:
Availability: The EPP disqualifies any pods that fail health or readiness checks.
Local queue depth: A shorter queue means less waiting before the request is processed.
Adapter state: If the request requires a LoRA adapter, a backend that already has it loaded can respond without incurring a cold-start delay.
KV cache locality: A server that has the prompt’s prefix cached can bypass redundant computation.
Because these factors often compete—for example, a pod with a cached prefix might also have a heavily congested queue—the EPP weighs these metrics against one another to find the most efficient routing path. Inference Extension’s programmable plugin architecture lets you customize exactly how each signal is scored and weighted. Ultimately, the EPP selects the target backend but does not execute the physical routing. It simply returns the IP address of the chosen endpoint to the gateway, which forwards the request.

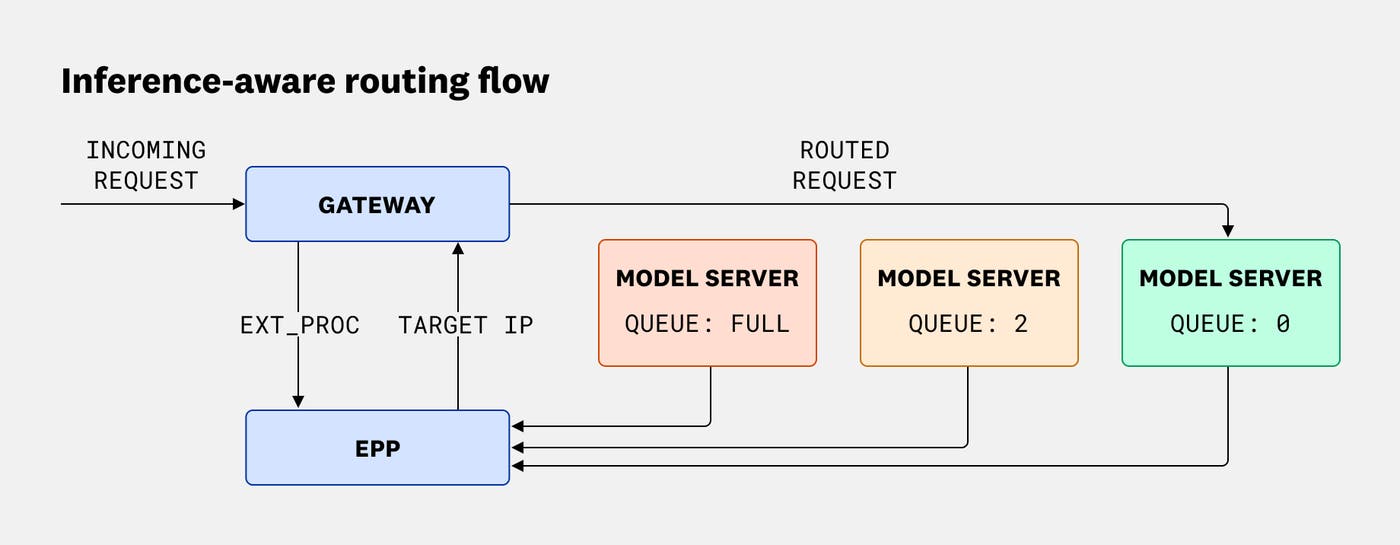
If the EPP’s built-in flow control capability is enabled, it applies further decision logic to protect the pool from resource exhaustion. After assessing current capacity, flow control determines whether to immediately dispatch a request (returning a target pod’s IP to the gateway for routing), queue it centrally, or shed it entirely. Without flow control, requests are sent directly to backend-local queues, which introduces a common inefficiency: A request can be committed to a busy pod and wait there even if a different pod becomes available first. Flow control addresses this by buffering requests in a central queue at the EPP, dispatching them for routing only when a suitable backend frees up.
To prevent the GPU from starving between requests, flow control will dispatch enough traffic to keep a small number of pending requests in each pod’s local queue.
From the central queue, flow control governs the dispatch order based on priority and fairness. If an incoming request has an associated InferenceObjective, flow control uses its priority to dictate the dispatch order, enabling you to prioritize customer-facing interactive traffic over lower-priority asynchronous inference tasks, such as bulk document summarization. It also prevents any single noisy neighbor from monopolizing the queue, guaranteeing equitable compute access within the same priority tier.
If the pool reaches a configured saturation threshold, flow control sheds low-priority requests entirely, throwing 429 Too Many Requests or 503 Service Unavailable errors while continuing to queue normal-priority requests for dispatch.

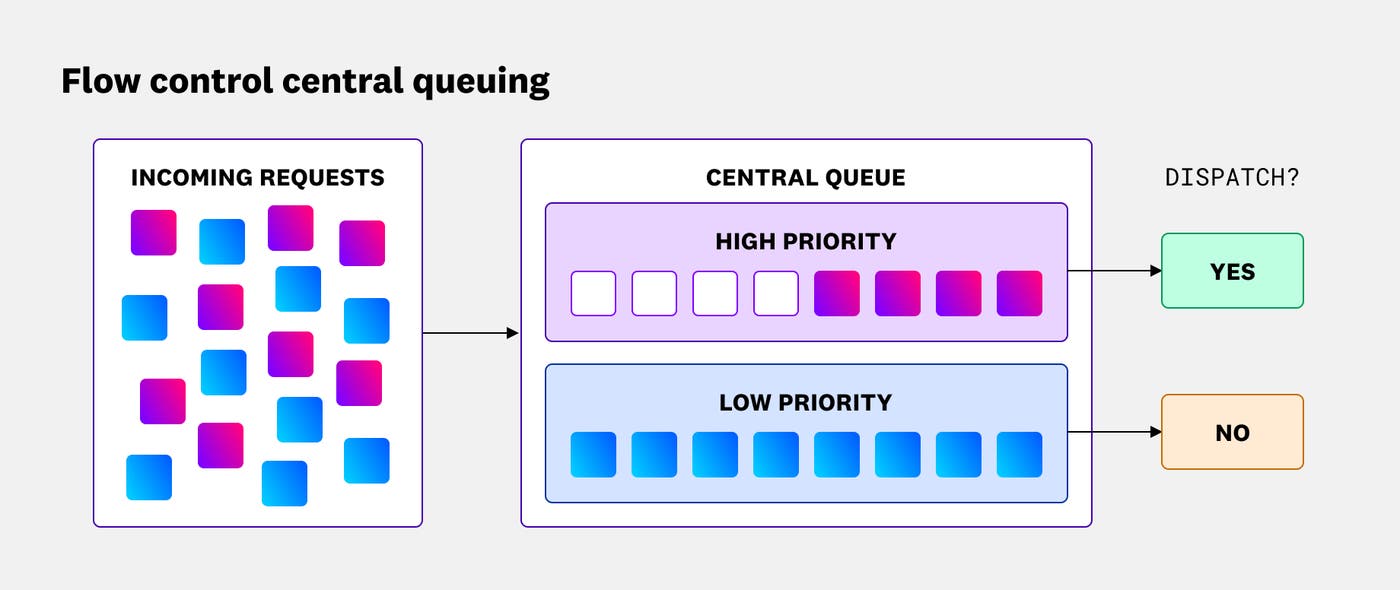
Central queue architecture also enables scale-to-zero as a cost management strategy, particularly for asynchronous or batch workloads. If no requests are pending, Kubernetes can scale GPU backends down to zero, avoiding cost inefficiencies. When incoming requests resume, they wait in the central queue while pods are provisioned, preventing the initial wave of traffic from failing or dropping. While the minutes-long cold start of loading model weights into VRAM makes this delay unrealistic for real-time interactive serving, it is an effective way to manage costs for background tasks where immediate latency is not a primary concern, such as processing a batch of support tickets for sentiment analysis.
The backend pods in an InferencePool run LLM serving engines such as vLLM or NVIDIA Triton Inference Server. When the gateway has routed the request to the optimal backend, the model server processes the prompt and begins generating the response. As it does so, it stores key-value attention state in the KV cache so it can avoid recomputing prior context while generating subsequent tokens.
The model server may also need to load a requested LoRA adapter into its GPU memory if that adapter isn’t already loaded.
Building a KV cache from scratch or loading adapter weights on demand can add noticeable latency. Because the EPP monitors telemetry from the model servers to understand their cache and adapter state, it can send requests to backend pods that are already prepared to respond most efficiently.
The Inference Extension enables specific routing strategies that can help ensure the performance and cost efficiency of your Kubernetes-based LLM inference workloads. This section describes four strategies and includes the observability signals you can monitor to validate each strategy’s effectiveness in production.
Running a single Kubernetes cluster to host multiple AI models is a common pattern that helps maximize GPU utilization and simplify infrastructure management. To effectively manage traffic in this environment, you rely on model-aware routing. To implement model-aware routing, you can define HTTPRoute rules that instruct the gateway to extract the target identifier—such as a base model or LoRA adapter name—and map the request to the correct InferencePool.
Signals to monitor:
Routing distribution by model: Track the volume of requests sent to each InferencePool to verify that routing activity aligns with your configured HTTPRoute and BBR rules.
EPP request and error signals: Track the health of the EPP by watching for errors and latency that could indicate a misconfiguration in your routing logic.
End-user request outcomes and latency: Track HTTP response codes (200 vs. 5xx errors) and latency by model name. This helps you quickly identify if a specific base model’s pool is under-provisioned, even if the EPP is routing requests correctly.
LoRA adapters are lightweight specializations of a base model that adapt its behavior for a specific task or domain, such as customer support or code generation. Unlike the base model, which remains continuously loaded in GPU memory, adapters dynamically swap in and out based on recent usage. This constant swapping makes static routing ineffective. If a request blindly lands on a pod that lacks the required adapter, the server must load it on the fly, incurring a cold-start latency penalty.
LoRA adapter-aware routing prevents this inefficiency: You configure the gateway’s BBR to inspect the JSON payload of each incoming request and extract the name of the relevant adapter. (OpenAI-compliant requests embed this in the model field.) The gateway sends the adapter name in an HTTP header to the EPP, which narrows the pool of candidates to those backends with that adapter loaded in memory. If multiple pods have the adapter warmed up, the EPP evaluates additional signals, such as local queue depth, to select the optimal target. Ultimately, this strategy helps ensure that adapter-specific requests are consistently routed to the most prepared backend.
Signals to monitor:
Routing concentration: To confirm that the EPP is successfully finding warmed-up targets, verify that requests for specific adapters are concentrated onto the appropriate subset of pods, rather than distributed evenly across the pool.
Latency during adapter churn: Correlate Time to First Token (TTFT) with adapter load events. If you see frequent latency spikes, your users are paying the cold-start penalty.
Adapter load and unload frequency (thrashing): Track how often pods are swapping adapters in and out of GPU memory. Elevated adapter load and unload frequency could indicate that you have too many active adapters competing for too little GPU memory across the pool.
When model servers process large shared contexts—such as system instructions, documents, or the previous turns in an ongoing chat history—they store the results in a local KV cache. If a subsequent request is routed to a pod that lacks this cached context, the model server must recompute the prompt from scratch, delaying its response and driving up TTFT. To avoid this penalty, prefix-aware routing actively directs follow-up requests to a pod that holds the relevant cache.
Prefix-aware routing begins at the gateway. Using an HTTPRoute rule, you configure the gateway to extract an incoming request’s unique context identifier, which typically appears in a custom HTTP header (e.g., x-session-id). This identifier is sometimes located in the JSON payload instead, in which case you can extract it by using the BBR. The gateway sends the identifier to the EPP (also via an HTTP header), and the EPP locates the backends that hold the cached data and can respond with the lowest TTFT.
Signals to monitor:
KV cache hit rate: This is the most direct measure of your prefix-aware routing’s accuracy. A consistently high hit rate confirms that your gateway is correctly extracting context identifiers and the EPP is successfully matching requests to the right pods.
TTFT: While cache hit rates measure routing accuracy, TTFT measures the actual user experience. Successful prefix-aware routing should keep your average TTFT low and predictable.
KV cache utilization: If this metric and TTFT are both high, it could be due to a true capacity shortage, and you should consider scaling your cluster. If rising TTFT appears with low cache utilization and uneven routing distribution, your KV cache-aware routing strategy may be hindered by stale backend state data causing the EPP to make ineffective routing decisions.
Swapped requests: When a backend’s GPU cache fills up, the model server may swap cached prefixes out to slower CPU memory. If you see an increasing swap rate, you should consider scaling out your pool of model servers.
Queue depth imbalances: Watch for bottlenecks in your model servers’ local queues. If a single pod holds the cache for an in-demand prefix, the EPP might aggressively route traffic there, filling the queue and increasing TTFT.
Maximizing GPU utilization often involves using a single InferencePool to serve different types of inference workloads (for example, both interactive chat and asynchronous background tasks, like bulk document summarization). But the gateway’s default first-in, first-out behavior risks latency impacts for interactive applications if background tasks occupy available resources. To prevent this, you can use flow control and define custom priority tiers by creating an InferenceObjective for each workload. You then configure the gateway to use HTTPRoute rules to map incoming traffic to the appropriate objective, typically by inspecting a header like x-request-priority.
The EPP enforces your custom priorities by allowing higher-tier requests to skip ahead of pending lower-priority work in the central queue. It also enforces these tiers through request shedding—actively rejecting traffic to prevent resource exhaustion. For example, you might configure the EPP to shed background batch jobs if the central queue is 50% full, while keeping critical interactive traffic flowing uninterrupted until the pool reaches 99% saturation.
Signals to monitor:
Shedding events: Monitor responses from the gateway that indicate shedding—429 Too Many Requests and 503 Service Unavailable. If the rate of shedding events is increasing but local queues are deep and cache utilization is high, you have a capacity shortage. Shedding is working as designed, but the pool is at its physical limit and you may need to add capacity.
Priority enforcement during saturation: Segment your latency and success rate metrics by traffic tier, and correlate them with overall pool saturation. You should see lower-priority background traffic fail or pause while your critical interactive endpoints maintain a near-100% success rate, even when backends reach peak queue depth.
To validate inference-aware routing in production, you must correlate gateway and model server activity with the underlying Kubernetes infrastructure. While tracking outcome metrics such as TTFT is essential, you also need to monitor leading indicators across the stack, such as routing distribution at the gateway, KV cache utilization on the model servers, and node pressure at the infrastructure layer. Together, signals from the routing, model serving, and infrastructure layers can help you spot misconfigurations and wasted capacity before they escalate into user-facing latency.
When inference performance degrades, issues typically fall into two categories: routing inefficiencies or capacity limits. Routing inefficiencies stem from misconfigured or outdated HTTPRoute rules. The gateway places requests poorly when it is unable to extract the necessary data to route them to optimal backends, and you’ll see isolated, unhealthy model servers struggling alongside idle ones. Conversely, a cluster capacity limit appears as a broadly saturated pool rather than isolated hotspots. Datadog surfaces signals from all three layers in a unified view, so you can determine at a glance whether rising TTFT reflects a misconfigured routing layer or a pool-wide capacity shortage.
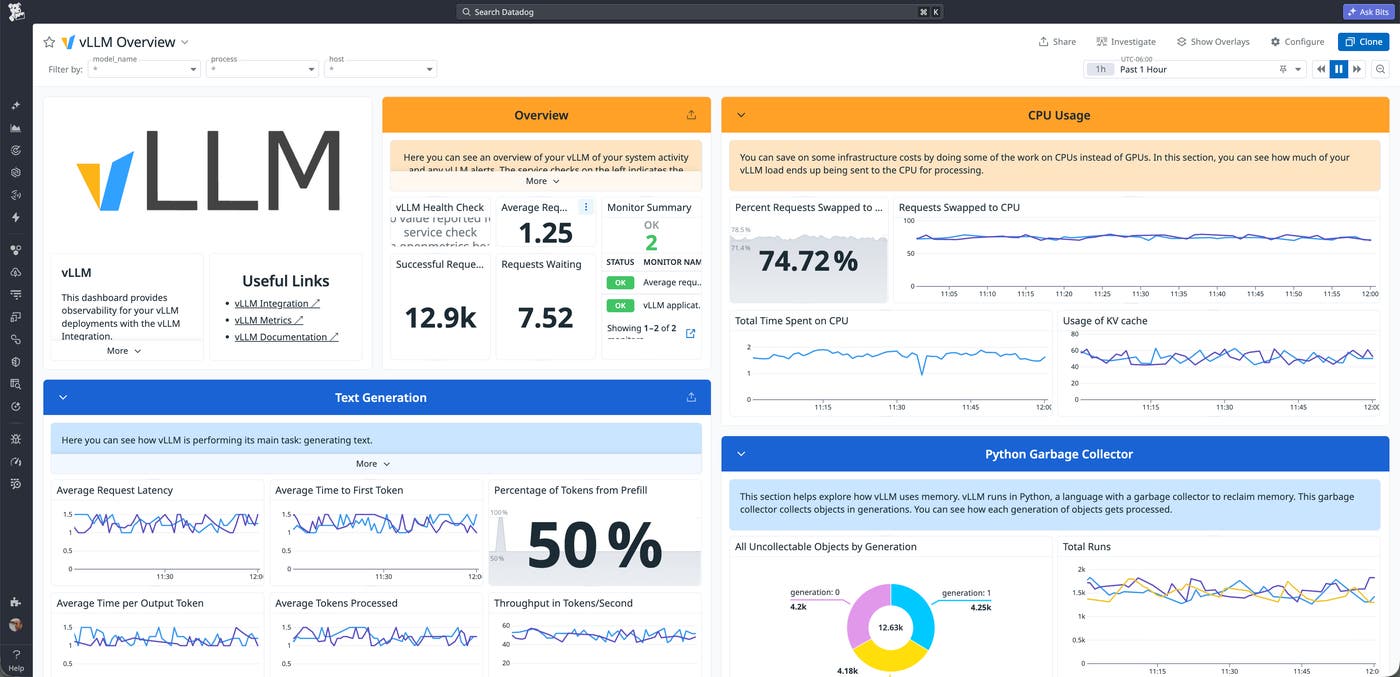
Datadog’s vLLM integration captures critical backend state metrics, such as KV cache utilization, running and waiting requests, swapped requests, and latency. The out-of-the-box (OOTB) dashboard visualizes these key performance indicators, allowing you to proactively monitor the behavior of your model servers.
vllm.time_to_first_token.seconds: The primary outcome metric for validating routing effectiveness. If TTFT spikes while queue sizes are unevenly distributed, the routing layer is likely failing to efficiently concentrate traffic onto warmed pods.
vllm.gpu_cache_usage_perc: Rising cache utilization across all backends signals pool-wide pressure. Low utilization paired with high TTFT points to a routing misconfiguration.
vllm.num_requests.running and vllm.num_requests.waiting: Track per-backend queue depth to help diagnose routing imbalances.
vllm.num_requests.swapped: Elevated swap rates indicate that backends are under GPU memory pressure and the pool may need to scale out.
The Datadog OpenMetrics integration enables you to collect observability signals from any Prometheus-compatible endpoint, including the Inference Extension. You can automatically scrape metrics from the extension and ingest them as custom metrics to visualize and alert on in Datadog, helping you spot issues before end-user latency degrades. For example, you can track end-to-end response time to identify extension-layer overhead, monitor routing distribution to reveal routing imbalances, and count shedding events to confirm resource exhaustion.
inference_objective_request_duration_seconds: Tracks end-to-end response time to identify extension-layer overhead.
inference_pool_per_pod_queue_size: Reveals how traffic is distributed. An uneven distribution can confirm that traffic is successfully being concentrated on warmed targets, while localized spikes might indicate a queue depth imbalance on a single cache-holding pod.
inference_extension_flow_control_request_queue_duration_seconds.count: When filtered by outcome="Rejected" or outcome="Evicted", this directly measures resource exhaustion and shedding events.
While vLLM metrics tell you how your serving engine is performing, Datadog GPU Monitoring capabilities give you deep visibility into the physical hardware running those models. Along with Datadog’s NVML integration, GPU monitoring enables you to track hardware-level telemetry such as GPU utilization, VRAM allocation, power draw, and thermal states across your entire fleet.
VRAM is a finite resource, and metrics like gpu.memory.usage and nvml.fb_used are critical indicators of hardware pressure. Since the vLLM integration does not collect a direct metric for the number of loaded LoRA adapters, VRAM pressure serves as a proxy for adapter saturation. If VRAM utilization is consistently high and TTFT is elevated, servers are likely holding too many idle adapters in memory, possibly leading to swapping and eating up available cache space.
To verify overall hardware health, you can monitor nvml.gpu_utilization, gpu.power.usage, and gpu.temperature. If routing and model serving signals indicate a problem but these hardware metrics are normal, you can confidently determine that the issue is a routing or configuration problem, not a physical capacity limit.
Datadog Kubernetes Monitoring provides the foundational environmental context for both routing and serving behavior. It can help you determine whether a performance issue with your inference workloads is due to a routing problem or is actually caused by pod instability, node pressure, resource exhaustion, or broader cluster constraints.
By tracking pod restarts (kubernetes.containers.restarts), OOMKills (kubernetes_state.container.terminated), and node status (kubernetes_state.node.status), you can quickly verify the health of your workload orchestration. If you’re seeing errors or latency in your inference process but pod health and node status are normal, the issue is likely a routing misconfiguration. On the other hand, if these Kubernetes metrics are degraded, the pool is at a true physical limit.
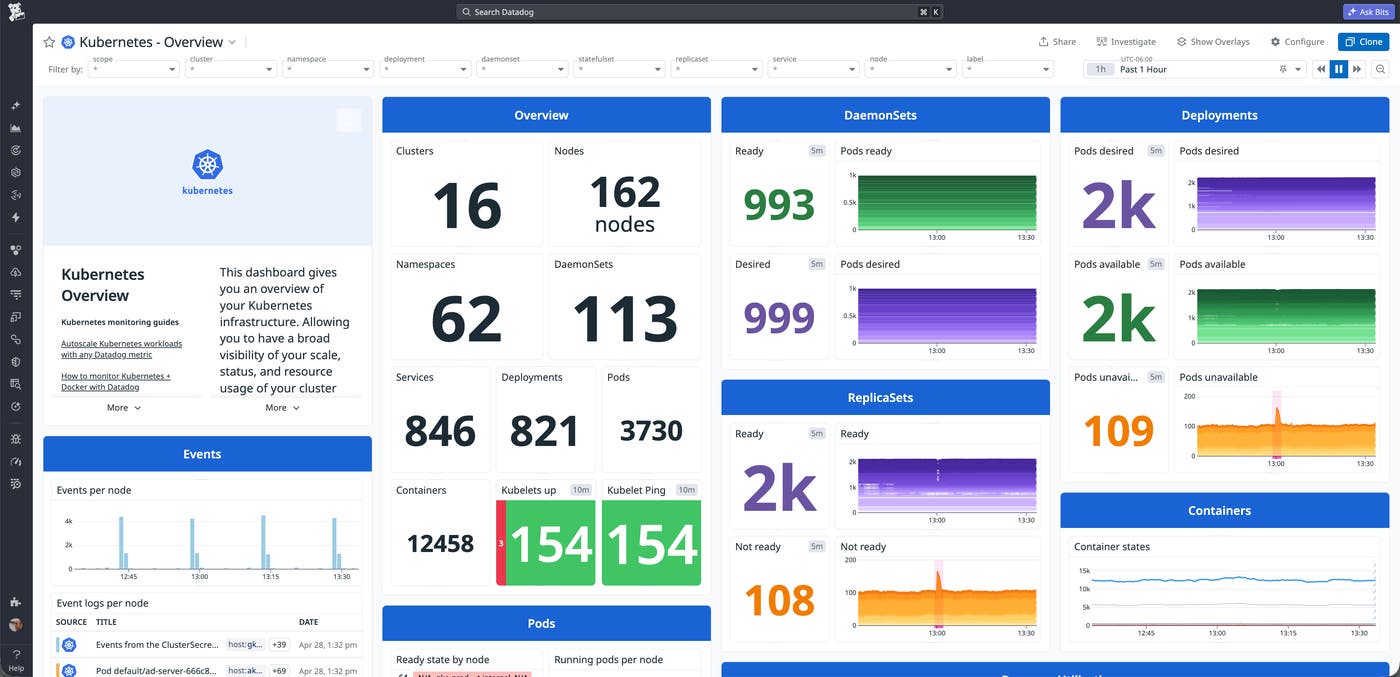
Additionally, you can gain visibility into the Inference Extension’s CRDs via Datadog Container Monitoring. Tracking the InferencePool and InferenceObjective objects governing your LLM traffic can show you if your intended routing architecture is actually deployed and operating as designed at the cluster level.
The Kubernetes Gateway API Inference Extension provides inference-aware routing to effectively manage dynamic LLM workloads. By surfacing backend serving states like KV cache utilization and LoRA adapter readiness, this architecture helps you maximize GPU capacity and reduces TTFT. You can monitor these environments with Datadog to unify gateway, model server, and infrastructure signals, allowing you to instantly distinguish between routing misconfigurations and physical capacity limits. See our documentation to learn more about the Datadog vLLM integration, OpenMetrics integration, and Kubernetes Monitoring feature.
If you don’t already have an account, you can sign up for a 14-day free trial.
此内容由惯性聚合(RSS阅读器)自动聚合整理,仅供阅读参考。 原文来自 — 版权归原作者所有。