




Since the Datadog Model Context Protocol (MCP) Server first launched in Preview, Datadog has experienced an overwhelming amount of interest and feedback from customers. We appreciate those who requested access to test our product, provided feedback, and shared their stories of how the MCP Server helped them overcome engineering challenges.
We’re excited to announce that the Datadog MCP Server is now generally available. The Datadog MCP Server connects Datadog tools and context with AI agents that developers use in their everyday workflows such as Claude Code, Cursor, Codex, Goose, GitHub Copilot, Cognition, Visual Studio Code, and Kiro. But our MCP Server isn’t just limited to real-time prompting by developers. It can also be used to provide background agents with the data they need to solve problems specific to your engineering organization.
In this blog post, we’ll highlight a few customer use cases where agents use the Datadog MCP Server to automate processes and remove previous points of friction in developer workflows. These examples will show how the MCP Server can help you:
Onboard Datadog products and best practices
Automatically detect and shut down unused services
Correlate incidents with feature flag changes
Detect anomalous cloud costs
If your organization is new to Datadog, getting engineers to buy into and adopt Datadog features in their everyday workflow can be difficult, and their success often varies widely from team to team, or even on an individual basis. Some teams might be deeply integrated with the platform and advanced in their usage, while others may not use Datadog features at all (despite having access). One use case for the Datadog MCP Server that we’ve encountered from customers is helping teams onboard developers to Datadog based on tools and best practices that their other engineering teams have already found success with.
In this use case, the organization develops a custom onboarding agent that is connected to the Datadog MCP Server. When a developer asks the agent for help with getting started with Datadog, the agent is able to use the MCP Server’s tools to identify the monitors and dashboards that the developer currently uses. Based on their usage, the agent will refer to monitors and dashboards created by engineering teams within the organization that are designated as best-practices teams, and then return to the developer with recommendations on which dashboards or tools to follow. Depending on the developer’s team and product ownership, if the monitoring best suited for them hasn’t been created, the agent will direct them to easy setup options. This can be via internal tickets with their platform engineering team or by providing AI coding platforms such as Windsurf and Cursor relevant context to generate Terraform code that the Terraform Datadog Provider then uses to create monitors and dashboards.
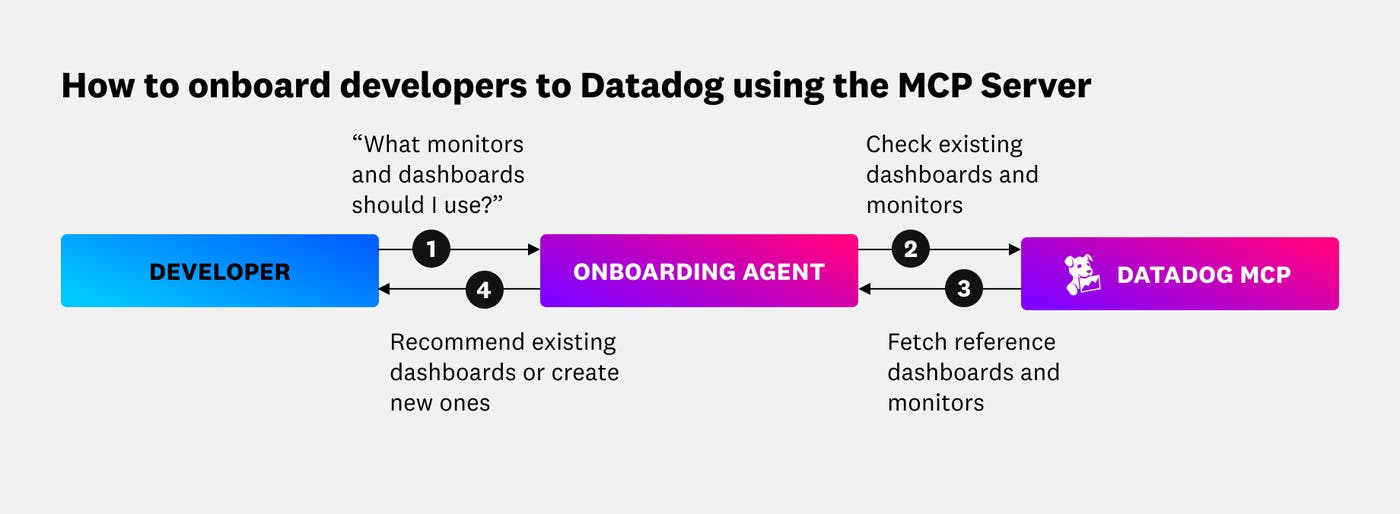
In this use case, the Datadog MCP Server helps speed up time to value for teams and developers who have yet to be onboarded to Datadog products, and it also helps them quickly establish monitoring with a lower barrier to entry. Developers don’t need to follow step-by-step guides or dig through documentation to learn about features they’re unfamiliar with. They can simply converse with the custom onboarding agent via natural language conversations to answer any questions they might have and generate tickets via the pathways that they are already familiar with.
Organizations are also using the Datadog MCP Server to identify and decommission services that receive no user-facing traffic. Synthetic traffic, such as health checks and cron jobs, can send false signals that create the illusion of active traffic. As service ownership changes, code authors leave the organization, and new developers are onboarded, it’s often easier to leave legacy system components as they are than it is to identify the code owners and investigate whether services are responding to real traffic. Ultimately, many organizations continue to provision infrastructure for services that no longer contribute to their business goals, further driving up cloud costs.
We observed one customer tackle this issue by creating a custom agent that uses the Datadog MCP Server to periodically fetch a list of active services and their incoming traffic. The agent also uses the MCP Server to query related logs, and using Datadog’s enriched context fields, it’s able to filter out health checks and other synthetic traffic to identify services that receive no traffic or only non-user-facing traffic. Once it’s identified services to be decommissioned, the agent sends its findings to the Atlassian MCP Server, which creates Jira tickets that outline each service’s traffic history and why it should be shut down. Engineering teams are then alerted to the automated Jira tickets and can review each service before taking the steps to decommission it.
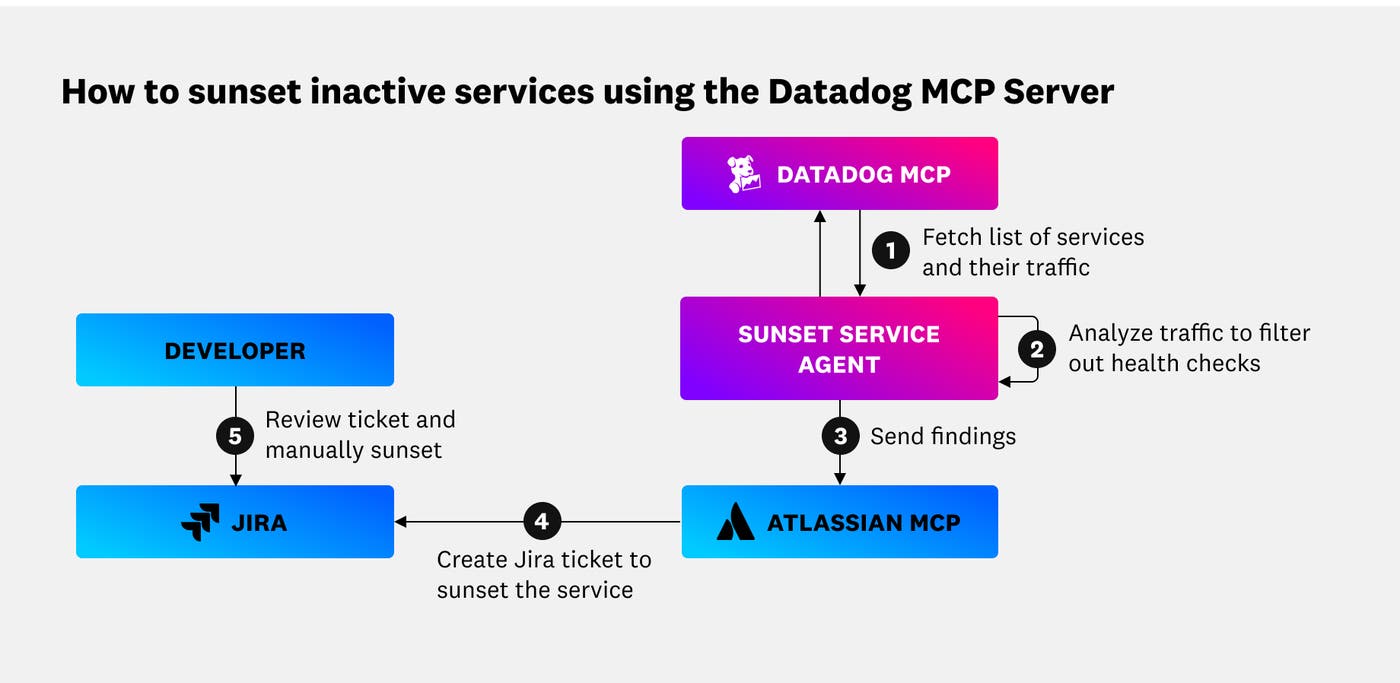
One of the core benefits of this workflow is that the detection of unused services periodically runs and is fully automated up until the Jira ticket reaches engineering teams. It doesn’t require engineers to manually investigate services each month, which can feel like a chore and contribute to developer frustration. Instead, teams get automated Jira notifications via Slack or email when the agent finds a service that needs to be shut down, and from there, the developer just needs to verify the context presented in the ticket and create the PR to decommission the service.
Datadog Feature Flags and feature management platforms helps organizations wrap new features and code changes behind gated flags that can be easily turned on and off for different groups of customers. This enables user targeting, gradual rollouts, and immediate rollbacks when things don’t work as planned. However, when your organization has hundreds of feature flags that are changing within each day, it can become difficult to tie incident backs to the feature flag deployment responsible.
We’ve observed customers create incident response agents that are connected to both their feature flag manager and Datadog telemetry via our MCP Server. When a Datadog Monitor alert is triggered, it notifies the incident response agent, which cross-references the timing of the alert indicator with the feature flag management tool. Any feature flag that is enabled, disabled, or changed prior to when the alert fired is marked as a potential root cause. The agent then uses the Datadog MCP Server to retrieve telemetry for the services and modules that the marked feature flags govern. It is then able to notify responders via Slack and other channels of communication with a message such as, “Possible cause: Feature flag was enabled 5 minutes before Shopify page load errors spiked and alert was triggered. Related metrics shown below.”
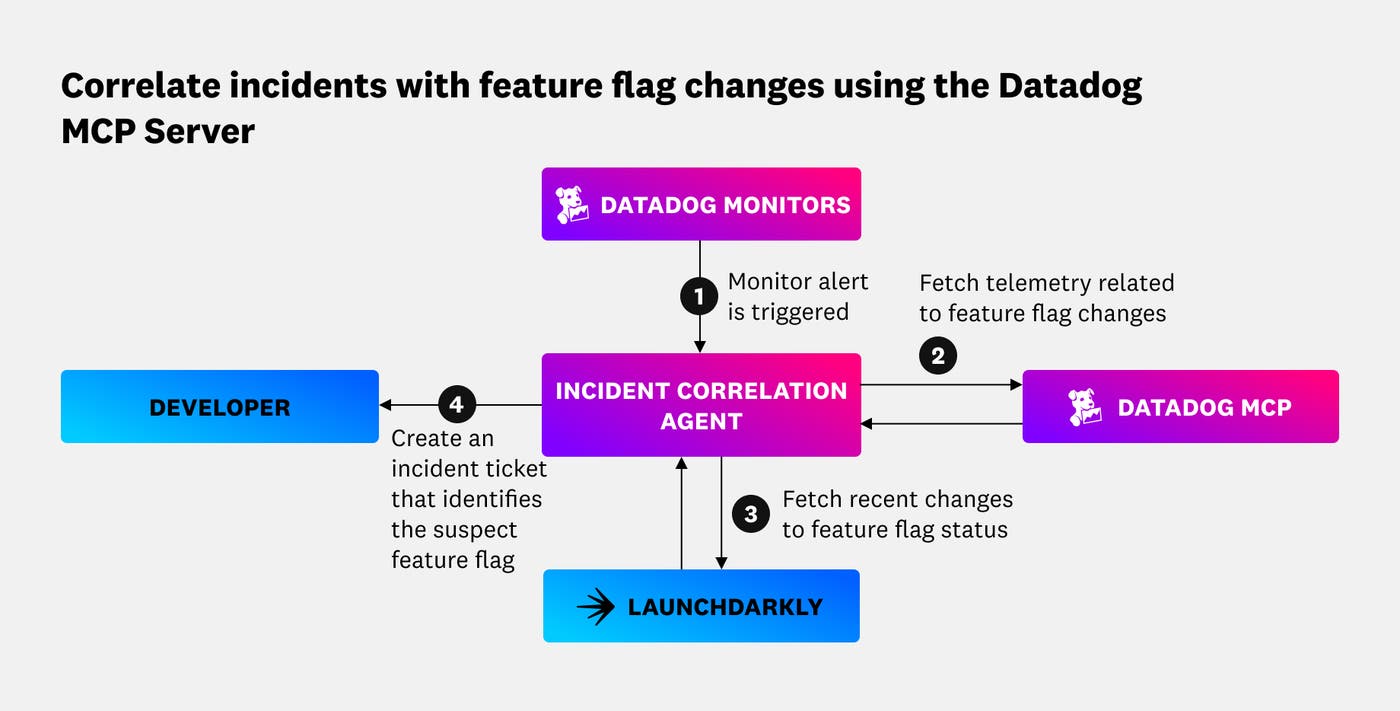
In this agent workflow, the customer organization used LaunchDarkly for their feature management tool. However, if you’ve configured Datadog Feature Flags for your environment, you can bypass step 3 in the diagram above from your workflow and directly query feature flag data from Datadog using the MCP Server. Your agent can then easily correlate this data with service errors, ongoing incidents, and other related context stored in Datadog.
When on-call responders are paged to an alert, the telemetry signals they initially respond to are not always from the service or system closest to the root cause. Automating feature flag correlation helps them immediately identify the services they should investigate first and which teams they need to loop into incident response. This can ultimately reduce your organization’s MTTR and reduce the severity of customer impact if the correct feature flag is quickly disabled.
We’ve also seen customers use the Datadog MCP Server to proactively tackle increases in cloud costs, which can be tracked and visualized using Datadog Cloud Cost Management. The same customer in our previous use case also created an agent to continuously monitor their cost tracking dashboards via the Datadog MCP Server. Cloud costs are sent as metrics to the MCP Server; whenever the agent detects an unusual cost spike in a service’s daily or weekly cloud spend, it automatically creates a Jira ticket with details regarding the increase and assigns it to the service owners with a message like, “AWS costs for Shopify Web Service are 30% above normal daily spend, starting on 2025-10-01. Possible leak or inefficiency—please investigate. (See attached Datadog cost graph.)”
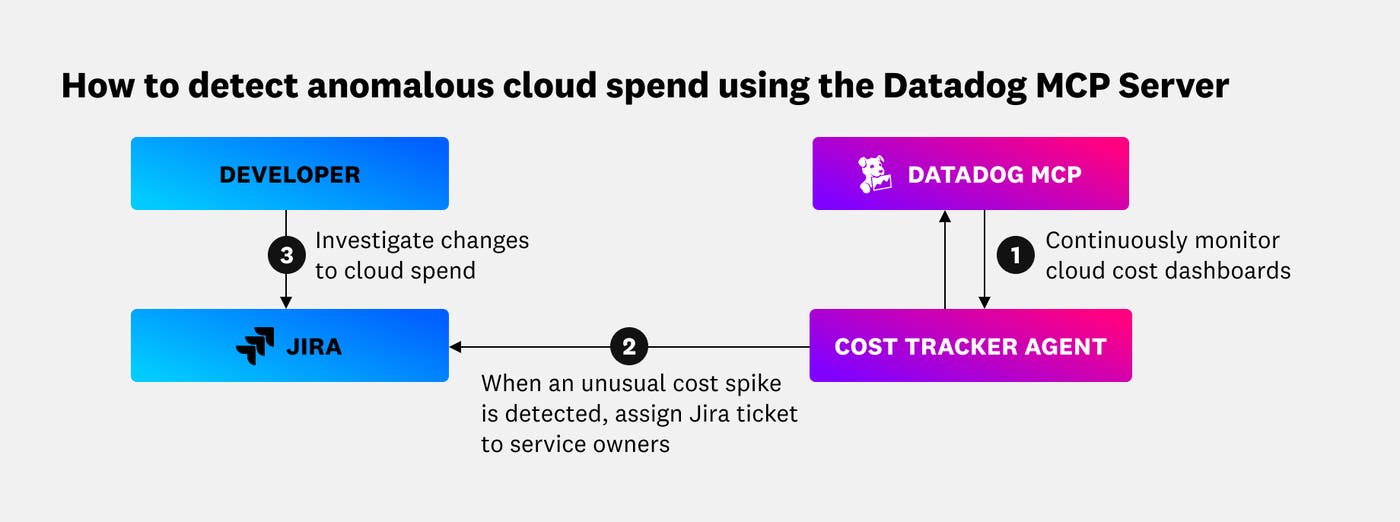
Most organizations experience year-over-year growth in cloud spend due to a combination of increased customer usage, expanding teams and microservices, adoption of managed resources, and other factors. To control cloud costs, you need to be able to differentiate between this organic growth and erroneous cloud spend. Creating a custom agent that alerts engineering teams when costs unexpectedly rise enables them to take immediate action and ensure that unexpected spikes in cloud costs aren’t treated as the new normal.
The Datadog MCP Server helps connect Datadog tools and context to your AI agents, whether that means enabling more context-driven development within AI coding platforms such as Cursor, providing context to CLI tools such as OpenAI Codex CLI, or building custom agents to overcome pain points specific to your organization. To continue learning about how customers are using our MCP Server, visit our GitHub repository where we showcase additional examples of how customers use the MCP Server to solve challenges.
The Datadog MCP Server is now generally available. If you’re an existing Datadog customer, you can begin connecting your agents to Datadog tools and context by following the setup instructions outlined in our documentation. If you don’t already have a Datadog account, sign up for a free 14-day trial today.
此内容由惯性聚合(RSS阅读器)自动聚合整理,仅供阅读参考。 原文来自 — 版权归原作者所有。