




Candace Shamieh

James Eastham

Juliano Costa

Piotr Wolski
Asynchronous communication patterns are commonly used in distributed systems, especially in those that rely on events or messages to coordinate activity. Rather than responding to direct API calls like in a traditional request-response architecture, services in an asynchronous system produce, route, or consume events and messages independently.
Communication in asynchronous systems is temporally decoupled, meaning it is not time-dependent. A process doesn’t have to wait for another to finish before it begins its own work, and a service doesn’t need to wait for a response before performing its next task. As with text messaging, one service in an asynchronous system can send a message to another without needing the recipient to be available at that exact moment. In contrast, synchronous communication is more like a phone call: both parties must be available and actively engaged at the same time in order for the exchange to take place. Synchronous communication requires that both the service making a request and the service receiving the request be available and responsive simultaneously for the request to succeed.
While temporal decoupling helps improve scalability and fault tolerance, it can also hide the sequence of operations within a request and make it harder to determine which services are dependent on each other. Having no record of direct communication complicates efforts to trace and correlate activity across distributed systems.
Distributed tracing helps address this challenge by connecting the dots between related requests across service boundaries, enabling you to understand how work flows through your system. But the method you use to connect those requests directly determines the effectiveness of that tracing.
In this post, we’ll look at two ways of establishing those connections—using parent-child relationships or span links—to help you select and implement the best tracing strategy for your architecture. Specifically, we’ll cover:
Asynchronous systems introduce ambiguity into the flow and origin of operations, making them harder to trace. Unlike in synchronous request-response systems, where events follow a predictable sequence, services in an asynchronous system trigger and process operations independently. These services, which might include message queues, publish-and-subscribe mechanisms, or scheduled tasks, do not produce, route, or consume events and messages in a linear order. Because of this behavior, successful application tracing requires you to implement effective context propagation.
Context propagation, a key concept of distributed tracing, describes the mechanism by which traces pass metadata across service boundaries. By using metadata like trace IDs, span IDs, and sampling decisions, context propagation enables you to identify and correlate activity across your system. Regardless of where the activity originates, context propagation helps you understand the cause-and-effect relationships between services and how each request interacts with your system along its journey.
Synchronous systems typically propagate context via HTTP headers or protocols like gRPC. Embedded with trace metadata, these headers make it easy to maintain continuity across services. In asynchronous systems, that continuity often breaks down because trace metadata isn’t reliably preserved across message boundaries. Because of their architectural pattern, asynchronous systems frequently use intermediaries (such as message queues, brokers, or data streaming platforms) to help services produce, buffer, and deliver messages to consumers. However, these intermediaries may strip or ignore headers entirely. This varying level of support for headers often requires developers to manually inject trace context into message payloads. In some cases, like that of the data streaming platform AWS Kinesis, native message headers are not supported at all, and each individual record (blob of data) must be modified to include trace metadata. Conditions like these increase the overhead necessary to implement context propagation and raise the risk of missed correlations.
Even when headers are supported, context propagation can still break down within the services themselves. Many asynchronous systems use multi-threaded processing to handle large volumes of events or messages in parallel, assigning each message to a different thread. For example, let’s say your service is using thread pools to distribute messages across threads. If trace identifiers aren’t explicitly passed along, spans created in separate threads may not include the same trace metadata. This can result in a fragmented trace, which happens when spans belonging to the same logical workflow are captured in different traces without a way to connect them. Without span IDs, correlation IDs, or other identifiers, trace context won’t be passed along the execution path of a request, leading to an inaccurate representation of your system’s behavior. Most instrumentation libraries assume that services are using a single-threaded execution model, so context may not be preserved automatically when work shifts between threads.
Without context propagation, tracing the full lifecycle of a request in an asynchronous system is challenging. Because events can be processed minutes, hours, or even days apart, and across different services, you don’t know whether a request was fully processed, delayed, or dropped altogether. This makes it difficult to measure end-to-end latency and pinpoint the root causes of errors.
A final challenge is that asynchronous systems often process a high volume of events and messages. Even when context is preserved, traces in high-throughput, asynchronous systems can balloon to thousands of spans, many of which will inevitably be unrelated to the one particular issue you’re investigating. For developers trying to home in on the cause of a specific performance issue, these massive traces can be difficult to interpret and navigate.
The way you propagate context or establish connections between services directly affects your ability to trace requests, visualize service behavior, and troubleshoot issues. The parent-child method creates a single trace by connecting each span to its immediate predecessor, forming hierarchical relationships. Each span can only have one parent, but one parent can have many child spans. The span-link method, on the other hand, allows each span to have any number of downstream or upstream relationships. Using span links enables you to associate spans from different traces and create logical connections between operations that don’t share parent-child relationships. Both the parent-child and span-link methods offer advantages and trade-offs, and the most suitable option in your scenario depends on the architecture of your system and the degree of control you have over it.
The parent-child method organizes spans into a single trace. Each child span has a direct reference to the parent span that triggered it, forming a tree-like structure that’s easy to visualize as a timeline. This method is ideal when you can reliably propagate headers or inject and extract trace context across services, which is typically in environments where you control the entire stack. For example, in a tightly coupled order-processing pipeline (such as cart → checkout → payment), a parent-child structure offers clear, end-to-end visibility.
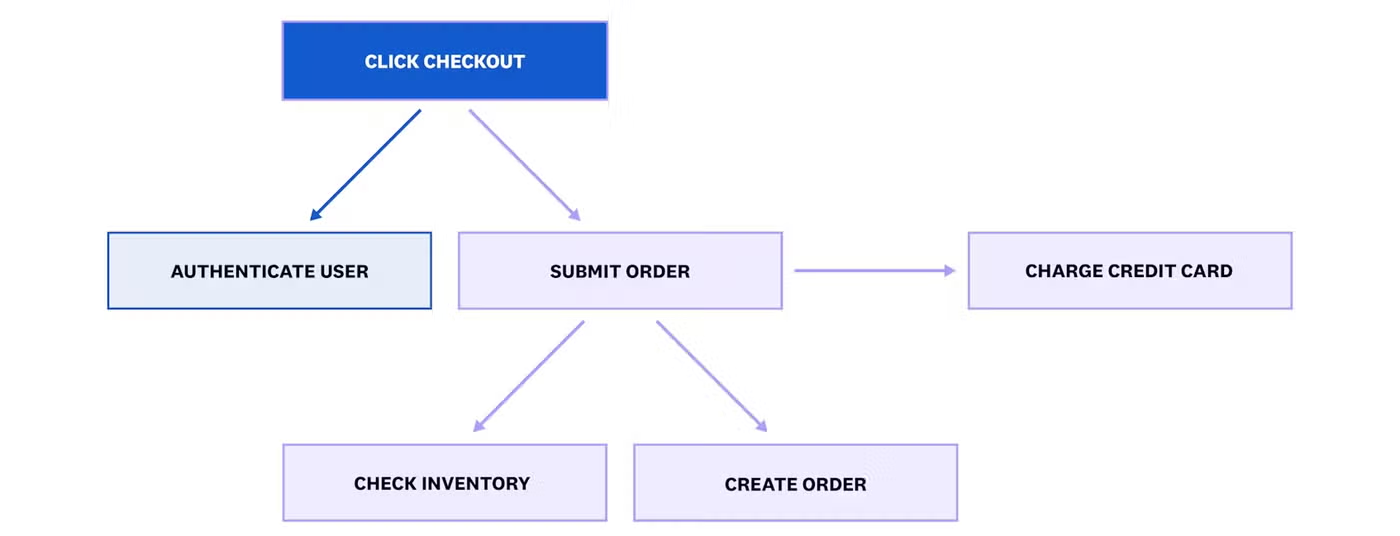
An advantage of using this method to propagate trace context is that it produces a unified trace with a clear parent-child hierarchy. Each trace is easy to navigate and is well-suited to waterfall-style visualizations. The parent-child method works especially well for asynchronous workflows that mimic synchronous behaviors, with spans occurring in rapid succession and within a narrow timeframe.
The screenshot below shows a waterfall view of a trace in Datadog APM, organized using the parent-child method. Each horizontal bar represents a span, corresponding to an operation performed by a service as part of a single request. The bars are stacked vertically to illustrate the hierarchical relationships between services, and arranged horizontally to show when each span started and how long it took to complete. The top-level span represents the initial request to the /recommendation endpoint. As the request flows through the system, downstream services perform various tasks, some of which result in internal server errors. This clear visualization helps teams identify service dependencies, analyze duration and sequencing, and pinpoint where failures or performance bottlenecks occurred.
Despite its advantages, the parent-child method does come with limitations. Compared with the span-link method, it doesn’t do a good job of simplifying complexity. Trace readability decreases if your system contains long-lived, delayed, or multi-branch workflows where spans occur far apart in time or across multiple service paths. It also cannot provide a full trace when intermediaries strip trace context, and it isn’t well-equipped to handle multi-threaded processing. It’s also important to keep in mind that it’s challenging to model certain workflows accurately because each span can have only one parent. For workflows where you’d need to link to multiple traces upstream, also known as fan-in workflows, the parent-child method would provide you only with partial observability.
The alternative approach—span links—offers increased flexibility for loosely coupled systems. Instead of grouping all spans under a single trace, this technique involves creating multiple root spans, each captured in a separate trace, and connecting them logically by using shared metadata.
Span links are particularly well-suited for environments where you don’t control all components, where context propagation is unreliable, or for fan-in workflows. Even if no active trace context is propagated by default (e.g., there are no headers with embedded metadata), you can extract and pass along a common identifier, such as a trace ID or correlation ID, as part of the message payload. The receiving service can then create a new trace and use a span link to associate it with the original one. For example, in a Kafka-based data ingestion pipeline, a message might be picked up by different services at different times, each starting a new trace. With span links, you can still associate those traces by linking their spans together with a trace ID passed through the message payload. This approach doesn’t necessarily recreate a full timeline, but it still allows you to logically connect related operations across service boundaries.
The screenshot below shows a trace in Datadog APM with span links enabled. In this checkout workflow, the publish orders span sends a message to a Kafka topic. Although the message is processed asynchronously by other services, the trace view allows you to see linked spans in both directions. The Span Links tab at the bottom confirms that this span is linked forward to the fraud-detection service and backward to the accounting service. This reveals how the span-link method provides visibility across multiple traces that would otherwise be disconnected.
While flexible, the span-link method also comes with trade-offs. Although span links can expose relationships across multiple traces in the UI, that visibility can be fragmented, as linked spans appear in separate traces and are not displayed in a unified view.
Sampling can also pose challenges with span links. Existing sampling solutions are built on the premise that each trace contains a complete workflow. Span links generally work well with the head-based sampling technique, where the decision to keep a trace is made at the beginning of the trace (i.e., the root span). With the tail-based sampling technique, where the decision is made after the trace has been completed, there’s a risk that some traces in a linked set might be dropped while others are kept. Inconsistent sampling can result in incomplete views and missing context.
Ultimately, choosing between a parent-child hierarchy and span links depends on your architecture and what kind of visibility you need. If your services are tightly integrated and you control the infrastructure, a parent-child method provides clean, easily navigable traces. If you’re working with messaging queues, external services, highly decoupled systems, or fan-in workflows, span links offer the flexibility to maintain context, even when propagation isn’t possible. Many teams use a combination of both, applying parent-child tracing where context can be reliably passed, and using span links where decoupling or third-party components make context propagation difficult.
Once you’ve decided which propagation method best fits your system, the next step is implementation. Datadog APM supports both the parent-child and span-link methods, and provides the tools you need to ingest, visualize, and analyze trace data in your asynchronous system. The implementation and instrumentation details vary depending on the SDK, language, and propagation method you choose.
We support context propagation in multiple formats, including Datadog format, W3C context, and Baggage, enabling you to choose which works best for your system.
To assist with queue-level visibility in an asynchronous system, you can also use Data Streams Monitoring (DSM) alongside APM. DSM provides end-to-end throughput and latency metrics for your message queues, and gives you a detailed overview of producer, consumer, and intermediary health even when span-level context is partial or fragmented.
If you’re using Datadog APM, the parent-child propagation method is supported out of the box. When context is successfully passed between services, Datadog automatically creates a unified trace that shows parent-child relationships between spans.
You can ingest traces via the Datadog Agent. Once the traces are ingested, you can search, analyze, and visualize them in real time, and use UI-based retention filters to decide which traces to keep so that you can control costs.
OpenTelemetry also supports the parent-child method out of the box. Depending on what you need, you can choose which strategy works best for you when deploying OpenTelemetry in your environment.
For your applications instrumented with Datadog or OpenTelemetry SDKs, Datadog supports both forward and backward span links by using custom instrumentation. Datadog SDKs require you to extract a trace or span ID manually and use custom APIs to create the link. In some cases, Datadog’s tracing libraries can automatically detect JSON-formatted messages and inject trace context into the payload. This simplifies instrumentation by reducing the need for manual injection.
If you’re using OpenTelemetry SDKs, the span-link method is the default for messaging operations. However, the default context propagation method will vary across languages and intermediaries, so you still need to inspect or modify your setup to confirm the expected behavior.
Asynchronous systems are foundational to modern architectures, offering flexibility, scalability, and resilience. But that flexibility can come at the cost of visibility, especially when services are decoupled, context propagation is inconsistent, or spans are spread across time.
Choosing the right context propagation method is essential to making distributed tracing useful in these environments. Parent-child relationships offer simplicity and unified views when you control the stack. Span links provide looser, more flexible correlation in message-driven systems, when service ownership is distributed, or where full context propagation cannot be guaranteed. Each method has its own strengths, limitations, and implementation trade-offs, and the best choice depends on your architecture and level of control.
To learn more, you can visit the DSM, APM, or Instrumentation documentation, read our OpenTelemetry Guide, or consult our proposed reference architecture that shows how to master distributed tracing.
You can also check out our sample app that demonstrates how to observe your AWS serverless applications using Datadog.
For in-depth instructions on setting up OpenTelemetry with Datadog, check out our Learning Center course. If you’re new to Datadog and want us to be a part of your monitoring strategy, you can get started now with a 14-day free trial.
此内容由惯性聚合(RSS阅读器)自动聚合整理,仅供阅读参考。 原文来自 — 版权归原作者所有。