












This post is the last of a 4-part series on monitoring Docker performance. Part 1 discusses the novel challenge of monitoring containers instead of hosts, part 2 explores metrics that are available from Docker, and how they differ from traditional host metrics, and part 3 covers the nuts and bolts of collecting Docker performance metrics.
iHeartRadio, iHeartMedia’s streaming music and digital radio platform, provides personalized artist stations, thousands of live broadcast radio stations from across the country, and on-demand podcasts available anywhere in the U.S. With more than 75 million registered users and 700 million downloads, iHeartRadio is available on dozens of devices and platforms: web, mobile, tablets, automotive partners, smart TVs, gaming devices, and more.
Scaling infrastructure to reliably serve iHeartRadio’s giant user base would be a challenge on its own. But there is also a platform challenge: they support 10+ mobile platforms, every major web browser, in-home connected products, in-dash auto devices, and a handful of wearables, totaling more than 60 platforms. They stream thousands of live radio stations, and integrate with many CMSes and partners.
iHeartRadio determined that a single, monolithic application to support all their users, and all their streams of data, would be untenable. But without a single platform, how would they build a stable, secure service that avoided redundancy?
They needed a simple way for small groups of engineers to build very specific applications without rebuilding standard infrastructure services: load balancer, HTTP server, logging, database, monitoring, etc. So they put standard infrastructural services such as HAProxy, MongoDB, and Elasticsearch on traditional hosts, and made them available as a service to internal applications. They also needed each application to be siloed: there should be no dependency conflicts, and each application should have guaranteed minimum resources (CPU, memory, I/O, network) available to it. So when Docker emerged as a platform that could control dependencies and resource usage, they quickly got onboard.
iHeartRadio has been quite happy with Docker—for them it “works as advertised”. Docker performance is also rapidly improving; while it doesn’t yet support log collection as well as iHeartRadio would like, Docker did add support for multi-host networking in November, which was high on iHeartRadio’s wish list.

There was just one thing about Docker that made iHeartRadio unhappy: they had no visibility into container-level resource consumption. They were using traditional monitoring tools, which could only see host-level resource usage. Since iHeartRadio runs dozens of containers per host, this visibility was entirely insufficient.
Compounding this problem, iHeartRadio, like many companies, treats containers as cattle rather than pets—which is to say that they care more about the health of a service, which is powered by redundant, often geographically distributed containers, and less about the status of the individual containers. They needed a way to aggregate their metrics using tags, which would allow them to monitor service-level metrics by aggregating by Docker image.

After deep investigation of several different monitoring platforms, iHeartRadio decided to use Datadog for infrastructure monitoring. Out of the box, Datadog collects CPU, memory, I/O, and network metrics from each Docker container, and can aggregate metrics by any tag or tags. That meant that immediately the company had access to high-resolution resource metrics at the container level, at the service level, or at any other tag-defined level.
In most well-designed microservice architectures, services communicate directly with one another or via a queue—and this direct communication can be hard to monitor. There is no central load balancer to meter, and standard host-level network metrics aggregate the traffic measurements from all the services on the host. This aggregation can mask problems and hamper investigation.
One of the reasons iHeartRadio uses Datadog is that Datadog breaks down network traffic by image and container so their engineers can immediately see exactly which service is overloaded or causing other services to fail by sending too much traffic—and they can aggregate these service metrics across any number of hosts.
Additionally, iHeartRadio uses Datadog to monitor its non-Docker services such as HAProxy, MongoDB, and Elasticsearch, which allows their engineers to correlate Docker performance metrics with health and performance throughout their infrastructure.
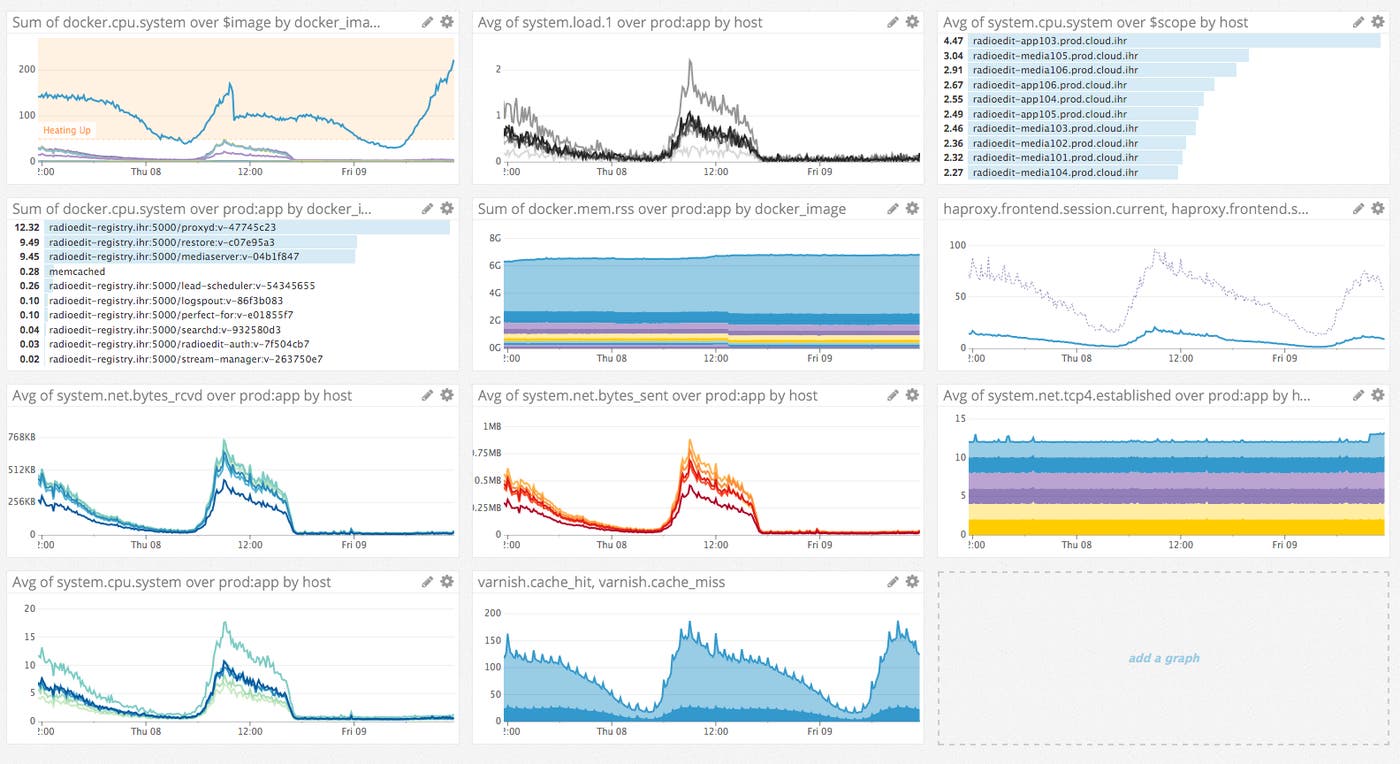
For iHeartRadio, rapid changes in internal network traffic are the most important canary in the coalmine—this is what they use to trigger alerts that notify engineers without inducing alert fatigue. This is why visibility into both aggregated and disaggregated service-level traffic is so important, as described above. Further, Datadog can alert on rapid changes in network traffic, even before measurements cross unsafe thresholds.
The rest of the resource metrics that iHeartRadio collects from Docker are principally used to aid investigation of issues that arise.
To follow along with this next part of the article, you’ll need a Datadog account. If you don’t have one, you can get a free 14-day unlimited account here.
Docker reports metrics to Datadog via an agent that runs in a container on each Docker host.
The Agent typically runs inside a container. To download and start the Agent container, execute this docker run command.
Optionally you can include -e TAGS="simple-tag-0,tag-key-1:tag-value-1" to add tags to the host.
That’s all you need to do to start collecting resource metrics from your containers and their hosts. You’ll immediately have a pre-designed Docker dashboard like the one below, which covers the key metrics discussed in part 2 and part 3. As mentioned above iHeartRadio sets its alerts on docker.net.bytes_rcvd and docker.net.bytes_sent, aggregated by image but visible per-container. These important metrics will be automatically collected and provided.
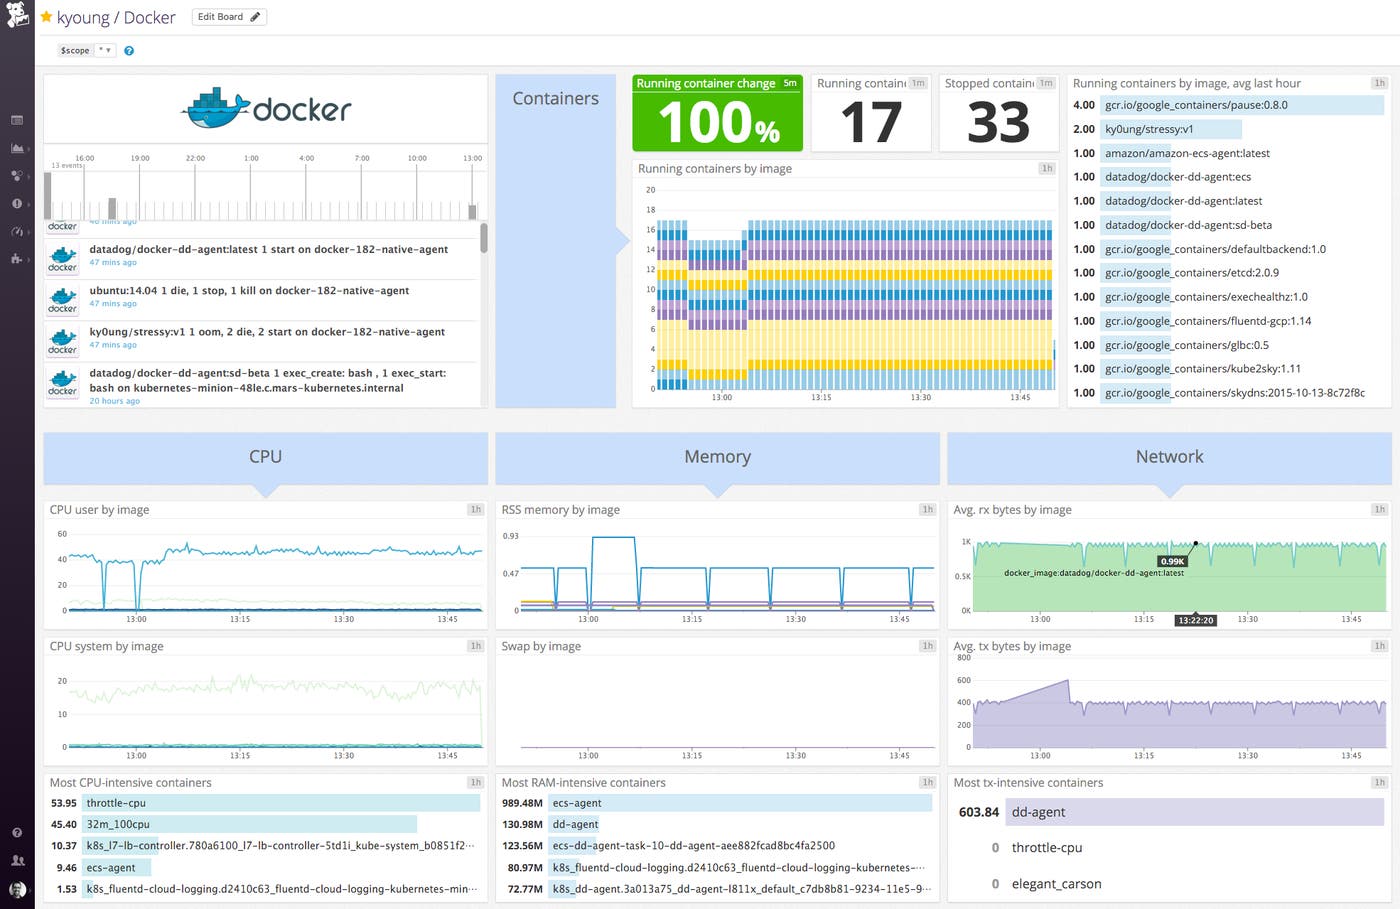
An out-of-the-box Docker dashboard in Datadog </div>
If you also need to collect metrics from technologies running on the same host (NGINX, MySQL, etc.), copy the appropriate config file from the Agent to your host, edit it as appropriate, and mount it in the container as described here.
If you’re running those technologies inside other Docker containers, you’ll need to connect those containers to the Datadog Agent container. To do this in versions of Docker prior to 1.9, you’d use container links, but from 1.9 forward container networks are strongly recommended. Both methods will create entries in /etc/hosts inside each container so that they can communicate with other containers on the same host by name.
Confirm that everything is working properly, and that integrations are collecting metrics:
docker exec dd-agent service datadog-agent info
If you want to bake your configurations and integrations into your Datadog Agent image, you can do that, too.
If you want to access the container’s logs from the host, or if you want to submit metrics directly to DogStatsD without the Agent, instructions are here.

Most companies choose to run the Datadog Agent inside a container—it’s easier to orchestrate dynamic infrastructure if everything is containerized. But there are a few limitations to running the Agent inside a container:
It will be able to list processes in other containers, but not on the host itself.
It will not report the host’s network metrics, though this may be approximated by aggregating the network activity in each of the containers.
It will not be able to collect metrics from technologies that do not report metrics via API. If it is crucial to collect metrics from these technologies, then you must run them alongside the Agent directly on the host (not in containers).
If you chose to install the Agent directly on your host without a container, it can still collect metrics from inside Docker containers on the same host. Follow the installation instructions for your OS, and turn on the Docker integration.

iHeartRadio uses Docker to isolate dependencies and resource usage of applications from each other, and it’s worked very well for them as they’ve continued to scale up and expand the number of platforms they support. But Docker performance can be quite hard to monitor as discussed in part 1 of this article, so they use Datadog to monitor all of their infrastructure, whether containerized or not. Datadog gives them the ability to aggregate and disaggregate metrics from across hosts and containers to understand the health and performance of all their services, wherever they are running.
If you’d like to have a detailed, real-time understanding and awareness of your Docker performance as iHeartRadio does, first get a Datadog account if you don’t already have one. Then follow the Datadog installation and configuration instructions above and you’ll start seeing your metrics flowing within minutes.
Thanks to iHeartRadio and especially to Trey Long, Director of Engineering, for assistance with this article.
此内容由惯性聚合(RSS阅读器)自动聚合整理,仅供阅读参考。 原文来自 — 版权归原作者所有。