

惯性聚合 高效追踪和阅读你感兴趣的博客、新闻、科技资讯
阅读原文 在惯性聚合中打开

推荐订阅源

量子位
D
Docker
月光博客
月光博客
MongoDB | Blog
MongoDB | Blog
Vercel News
Vercel News
美团技术团队
博客园 - 叶小钗
I
InfoQ
Jina AI
Jina AI
博客园 - 司徒正美
雷峰网
雷峰网
B
Blog
Y
Y Combinator Blog
A
About on SuperTechFans
WordPress大学
WordPress大学
酷 壳 – CoolShell
酷 壳 – CoolShell
大猫的无限游戏
大猫的无限游戏
Microsoft Security Blog
Stack Overflow Blog
Stack Overflow Blog
腾讯CDC
H
Hackread – Cybersecurity News, Data Breaches, AI and More
Recent Announcements
V
V2EX
N
Netflix TechBlog - Medium

Datadog | The Monitor blog

Introducing our open source AI-native SAST Instrument and monitor Boomi integration flows with OpenTelemetry and Datadog Not all index scans are equal: How we cut query latency by over 99% Platform engineering metrics: What to measure and what to ignore Integrate Recorded Future threat intelligence with Datadog Cloud SIEM CI/CD security: threat modeling using a MITRE-style threat matrix CI/CD security: How to secure your GitHub ecosystem Ingress NGINX is EOL: A practical guide for migrating to Kubernetes Gateway API Operating agentic AI with Amazon Bedrock AgentCore and Datadog LLM Observability: Lessons from NTT DATA Introducing the Datadog Code Security MCP Capture and analyze custom heatmaps in Session Replay Understand session replays faster with AI summaries and smart chapters Monitor ClickHouse query performance with Datadog Database Monitoring How we designed empathetic alert sounds for on-call engineers Search and act across Datadog to resolve issues faster with Bits Assistant Measure the business impact of every product change with Datadog Experiments Analyzing round trip query latency Configuring JavaScript caches for better performance Introducing Bits AI Dev Agent for Code Security Datadog achieves ISO 42001 certification for responsible AI Monitor Nutanix clusters, hosts, and VMs with Datadog Monitor Juniper Mist in Datadog A new Host Map for modern infrastructure Annotate traces to improve LLM quality with Datadog LLM Observability What’s new in Cloud SIEM: AI-powered investigations, enhanced threat intelligence, and scalable security operations Explore Kubernetes with native OpenTelemetry data Monitor Oracle Fusion Cloud Applications with Datadog Announcing the Datadog Terraform provider v4.0.0 Scaling Kubernetes workloads on custom metrics How to design cloud environments for AI-powered threat analysis
Monitor View: A window into Datadog’s monitoring engine
Evan Mouzakitis · 2016-02-04 · via Datadog | The Monitor blog

Chances are you’ve created an alert that didn’t fire exactly when you expected it to, even though it is working exactly right. Often an alert is configured to trigger when a moving average exceeds a certain threshold—for example, when the number of 5xxs averaged over the last hour exceeds two per minute—and often you may not have a view that shows the moving average.

Enter Monitor View, a new feature for monitors that graphs your data exactly as it is processed by our alerting backends.

Seeing when alerts will trigger

Let’s take a look at a concrete example. Here, we’ve set up a monitor to alert on haproxy.backend.queue.time, should it exceed an average value of .01 ms over the last hour. Here’s what our real-time data looks like, averaged over the group of HAproxy machines. Can you spot when it will trigger?
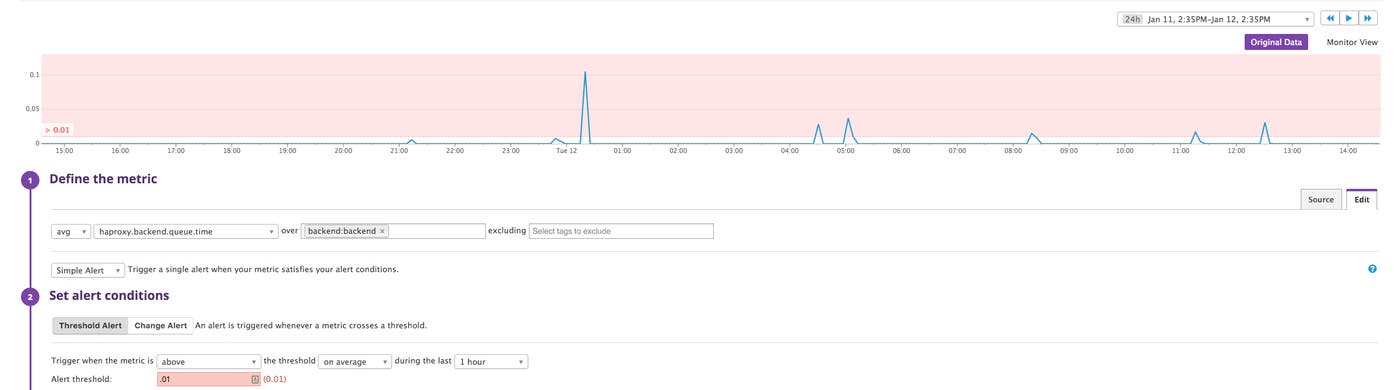
Can you spot when it will trigger?
Monitor View—Can you spot the trigger?
Can you spot when it will trigger?

In the above screenshot, you can see the data points stream in, in real-time. For most people, computing a trailing average over the past hour for these data points is not intuitive. In this case, it is exceedingly difficult to gauge the exact moment the value (averaged over the past hour) exceeded .01.

The next screenshot shows the same data, this time from the Monitor View perspective:
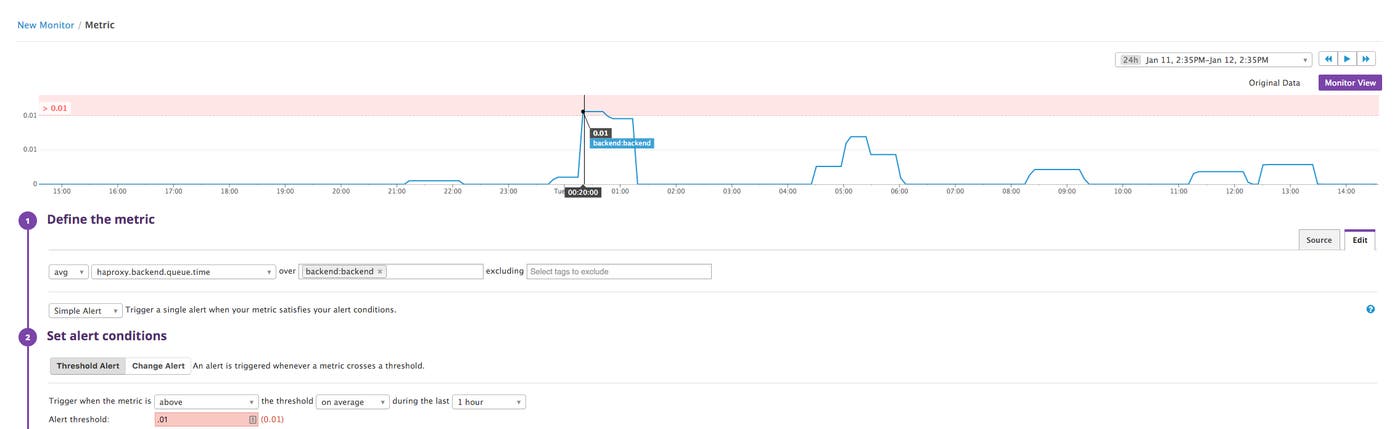
Moving average data, moving average alert threshold
Monitor View—Can you spot the trigger NOW?
Moving average data, moving average alert threshold

Now it is clear that the value of the haproxy.backend.queue.time metric, averaged over an hour, exceeded the .01 threshold value only one time: at 12:20 on January 12th.

Try it today

New to Monitors? Check out our guide which walks through setting up a monitor for your infrastructure.

Datadog customers can access the new feature by navigating to the Monitors page and clicking on an existing Metric Monitor. In the monitor editing page, change your view from Original Data to Monitor View.
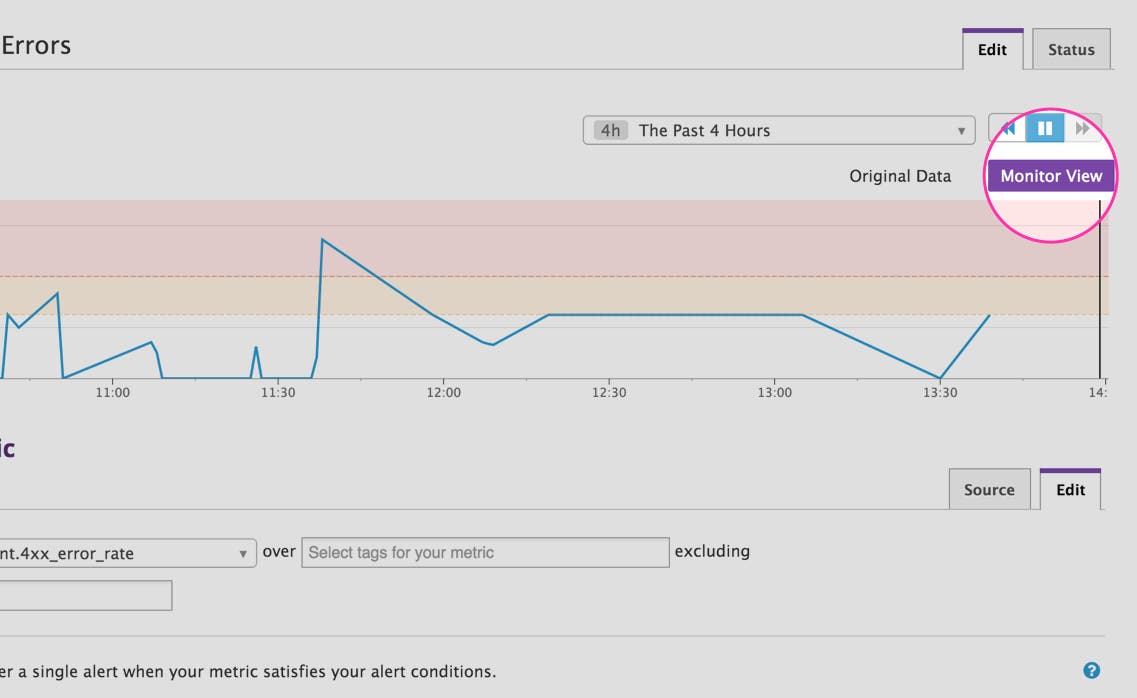
Monitor View Highlighted

If you don’t have a Datadog account, you can try it out today by signing up for a free trial.