







Detection as code (DaC) is a methodology that treats threat detection logic and security operations processes as code. It involves applying software engineering best practices to implement and manage detection rules and response runbooks. This approach addresses many of the pain points associated with traditional security operations, such as:
Version control: As the number of detection rules increases and creators change over time, it is vital to keep a source of truth, have transparency in rule changes, and understand motivations behind the changes. Defining detection rules as code allows teams to use version control systems like Git, so that multiple team members can contribute, review, and improve detection logic in a centralized and coordinated manner.
Consistency of review and approval: DaC standardizes detection logic, ensuring consistency and reducing the chances of gaps in security coverage. Passing tests and quality checks before releasing to production saves security responders from floods of faulty alerts or inactionable signals.
Maintenance at scale: As organizations grow, so do the volume and complexity of their security data. Rules defined as code support multi-file edits and large redeployments (e.g., pushing the same set of rules to multiple environments) in a single step, making it easier to scale detection efforts in line with organizational growth.
At Datadog, we’ve also experienced these same pain points, which has led us to adopt the DaC methodology. Our Threat Detection team dogfoods our own products—including Cloud SIEM, App and API Protection (AAP), and Cloud Security—to implement DaC across our complex, microservice-based infrastructure. In this post, we’ll walk through how we use the Datadog platform to implement and maintain DaC, including how we write detection rules, our repository structure, our CI/CD pipeline, and our detection development flow.
Our Threat Detection team uses Datadog log query and Agent expression syntax to write detection rules that run across Cloud SIEM, AAP, and Cloud Security. These rules detect indicators of potential security issues in our logs (Cloud SIEM), application runtimes (AAP), and workload runtimes (Workload Protection), respectively.
We write these detection rules in Terraform using Datadog’s Terraform provider. Terraform creates the detection rules as resources, similar to software infrastructure. Adopting this infrastructure-as-code approach for detection rules allows the team to:
Push a rule once and see the rule deployed across multiple organizations
Define rules in a single place and selectively choose which organizations rules are deployed to
Prevent drift and guarantee a state of truth
Our repository houses the Terraform resources and tooling to manage detection rules at Datadog. The repository is divided into the following directories: rules, organizations, and tests.
├── rules
├── organizations
├── tests
├── .gitlab-ci.yml
└── README.md
All rules are defined as individual Terraform files, and each rule declares its product type (i.e., Cloud SIEM, AAP, or Workload Protection). The rules are also grouped by data source. We define data source as the origin of the logs or events that the rules are based on. Here’s a glimpse of what that looks like:
rules
├── aap // App and API Protection
│ ├── credential_stuffing.tf
│ ├── config.tf
├── azure // Azure control plane
│ ├── permission_elevation.tf
│ ├── config.tf
├── cws // Workload Protection (runtime)
│ ├── modify_authorized_keys.tf
│ └── config.tf
├── github // Github activity
│ ├── clone_repos.tf
│ └── config.tf
└── k8s // Kubernetes control plane
├── access_secrets.tf
└── config.tf
Within each data source’s directory is a config.tf Terraform module that allows us to reuse the same rule definitions and deploy them to multiple Datadog instances.
terraform {
required_providers {
datadog = {
source = "DataDog/datadog"
}
}
required_version = ">= 1.0.3"
}
Within a rule’s Terraform file, the same query used in Datadog log search or Agent expression is embedded within a resource definition and set with conditions for generating signals.
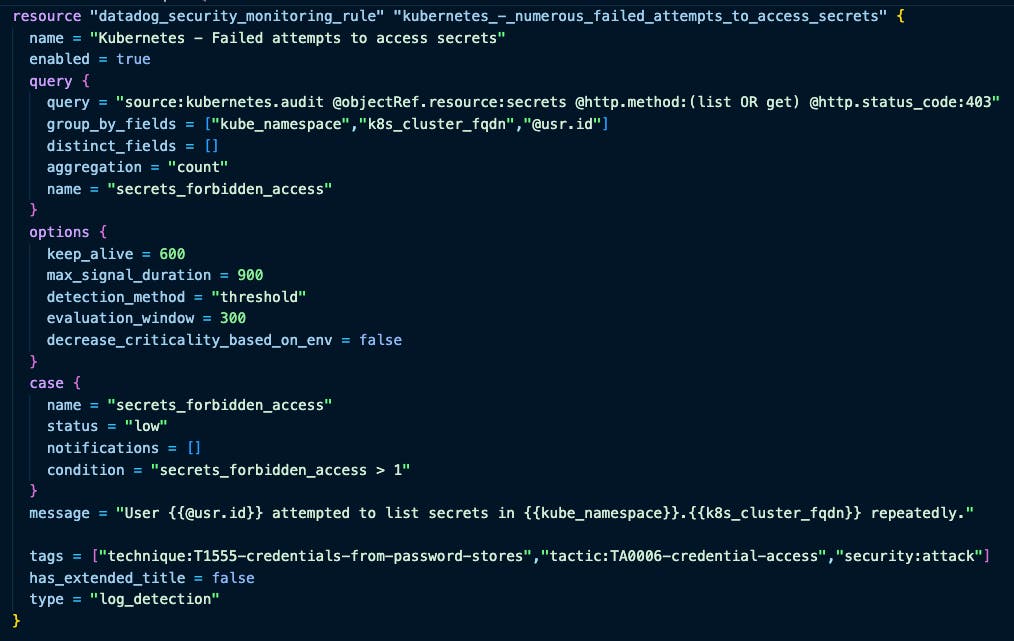
For example, the rule k8s/access_secrets.tf runs within Cloud SIEM and catches failed attempts to retrieve secrets within Kubernetes. The detection logic lives within the query block. The case block sets the threshold for generating a signal (secrets_forbidden_access > 1) and severity (low) for any generated signals. The options block establishes the evaluation window (300 seconds), keep alive (600 seconds), and max lifetime of a signal (900 seconds).
resource "datadog_security_monitoring_rule" "access_secrets" {
name = "Kubernetes - Failed attempts to access secrets"
type = "log_detection"
enabled = true
message = <<EOT
User {{@usr.id}} attempted to list secrets in {{kube_namespace}}.{{k8s_cluster_fqdn}} repeatedly.
EOT
query {
name = "secrets_forbidden_access"
query = "source:kubernetes.audit @objectRef.resource:secrets @http.method:(list OR get) @http.status_code:403"
aggregation = "count"
group_by_fields = ["kube_namespace", "k8s_cluster_fqdn", "@usr.id"]
}
case {
name = "secrets_forbidden_access"
status = "low"
condition = "secrets_forbidden_access > 1"
}
options {
evaluation_window = 300 // 5 minutes
keep_alive = 600 // 10 minutes
max_signal_duration = 900 // 15 minutes
}
}
We can also create suppression rules that filter out known legitimate activity to reduce noise in our signals. These can be created either within the same file as the detection they correspond with or as a separate file.
For example, we’ve defined the following suppression block within k8s/access_secrets.tf as a second resource. In this case, the suppression is specific to a single rule, so we keep the detection and its suppression in the same file to make it easier for our security engineers to understand. The suppression will not generate a signal if the activity is triggered by a service account called redacted (@usr.id:system:serviceaccount:redacted).
locals {
suppressions_access_secrets = [
"@usr.id:system:serviceaccount:redacted"
]
}
resource "datadog_security_monitoring_suppression" "access_secrets" {
count = length(local.suppressions_access_secrets)
enabled = true
name = "Kubernetes - Failed attempts to access secrets ${count.index + 1}"
rule_query = "ruleId:${datadog_security_monitoring_rule.suppressions_access_secrets.id}"
data_exclusion_query = local.suppressions_list_secrets_attempts[count.index]
}
Note: We create long-lived or permanent suppressions using Terraform. However, we recognize there are times when convenience or urgency takes precedence. For this reason, we create temporary or short-lived suppressions (e.g., ones that will be in place for just four hours, or during an expected maintenance window) directly in the Datadog UI. Similarly, responders occasionally use the one-click option within the UI to prevent a problematic rule from creating floods of alerts.
We monitor multiple environments and forward data to a number of different Datadog instances, which we refer to as organizations or orgs. All of our Terraform backend configurations live in the repository’s organizations directory. The configurations specify the Terraform backend and dictate which rules are deployed within each Datadog organization.
Starting out, we had a single Terraform state file for all of our detection rules. We observed a repeated pattern as our environments and number of detections grew: A failing Terraform deployment would block all subsequent deployments. In other words, if Terraform runs into an error while applying a rule change, all subsequent changes to any rule will be blocked until the error is fixed.
In addition to quality checks that catch errors early, we chose to create a separate Terraform state for each set of rules within an org. This layer of isolation ensures that failing rule deployments in one org do not affect rule deployments occurring in other orgs.
organizations
├── prod
│ ├── aap
│ │ ├── backend.tf
│ │ └── main.tf
│ ├── azure
│ │ ├── backend.tf
│ │ └── main.tf
│ ├── cws
│ │ ├── backend.tf
│ │ └── main.tf
│ └── k8s
│ ├── backend.tf
│ └── main.tf
└── staging
├── aap
│ ├── backend.tf
│ └── main.tf
├── azure
│ ├── backend.tf
│ └── main.tf
├── cws
│ ├── backend.tf
│ └── main.tf
└── k8s
├── backend.tf
└── main.tf
We opted to use main.tf to tell Terraform where to find the respective rules within the repository. Individual rules that we do not want deployed to a particular org are configured within main.tf. backend.tf specifies the remote backend location.
module "azure" {
source = "../../../rules/azure" # Path is relative to main.tf
}
# Individual rules that are not to be deployed within this org
# rules map is optional and does not have to be populated
rules = {
permission_elevation = false
}
For supported use cases, we define end-to-end tests for our rules and group them by data source in the tests directory. These are tests that are triggered by our internal testing service, built on top of Stratus Red Team and Threatest.
The following is an example of an end-to-end test file. The test file tells our testing service to schedule a job each hour (schedule: "0 * * * *") and run a Linux command to change the timestamp of the authorized_keys file (cd ~/.ssh && touch authorized_keys). The testing service should then expect a signal called SSH Authorized Keys Modified (OOTB clone) to be generated within our dedicated Datadog testing org (123456). If the testing service observes the signal, then the detection rule works as intended. However, if the testing service does not observe the signal, an alert is raised that prompts a detection engineer to follow up. The lack of signal indicates an issue in either logging or the detection rule itself.
schedule: "0 * * * *" # every hour
workerType: cws
datadogOrgs:
- 123456 # example org ID
threatest:
expectedRuleName: "SSH Authorized Keys Modified (OOTB clone)"
timeout: 10m
detonators:
- type: local-command
command: "cd ~/.ssh && touch authorized_keys"
We use GitLab for our continuous integration and continuous delivery (CI/CD) pipelines. All of our GitLab pipelines and rules are defined in .gitlab-ci.yml. The following is a breakdown of the various stages of our GitLab pipelines that define how we lint, test, and deploy our detection rules:
.pre
Configures our GitLab Pipeline with Datadog Tracing via CI Visibility, in order to view our pipelines’ performance and trends in the Datadog UI.
lint
Checks for expected syntax from the Terraform provider and enforces tagging.
test
Spins up and tears down a sandbox environment to test detection rules.
synthetic-logs
Job that triggers detection rules over sample audit log data that needs to be manually provided via a JSON file path.
apply
Job to set up the sandbox environment with the rule(s) being tested.
destroy
Job to tear down the sandbox environment with rule(s) previously deployed for testing.
check
Detects which organizations will be impacted by a rule change. If changes are detected, a GitLab artifact with a list of modified Terraform modules (i.e., detection rules) will be generated and utilized by downstream jobs, so that we can apply changes only in Datadog organizations where the affected modules are deployed.
plan
Generates a Terraform plan when rules are modified on a feature branch. This stage has a job defined per Datadog organization we deploy rules to. terraform apply takes place only when merging to the main branch of our repository.
deploy
Run terraform apply on the impacted organizations, when the changes are merged to our main branch. Similar to the plan stage, this stage has jobs defined per Datadog organization. These jobs also have an equivalent schedule job that periodically runs terraform apply to prevent drift and to detect any tampering of our detection rules in the Datadog UI.
This stage also generates a new JSON file, capturing the MITRE ATT&CK technique coverage for our detection ruleset. The JSON file powers our internal deployment of MITRE ATT&CK Navigator.
Now that we’ve covered the general structure of our repository and the different stages involved in our CI/CD pipeline, let’s take a look at how it all comes together when developing a detection rule on our team.
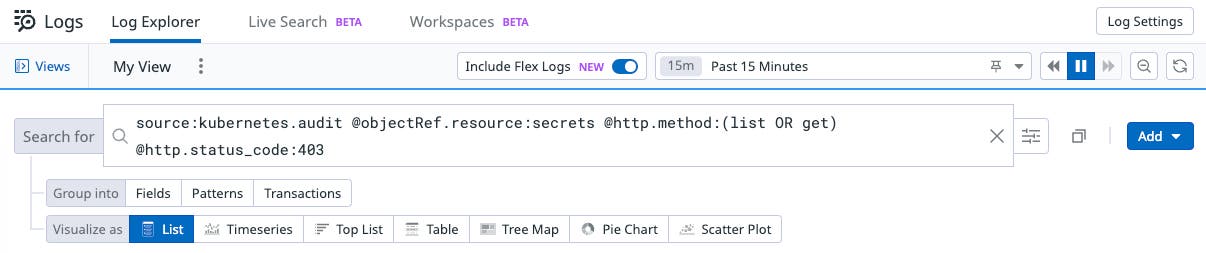
This starts off as a Log Search query, where the engineer filters and narrows down the search results of the action(s) we’d like to detect.
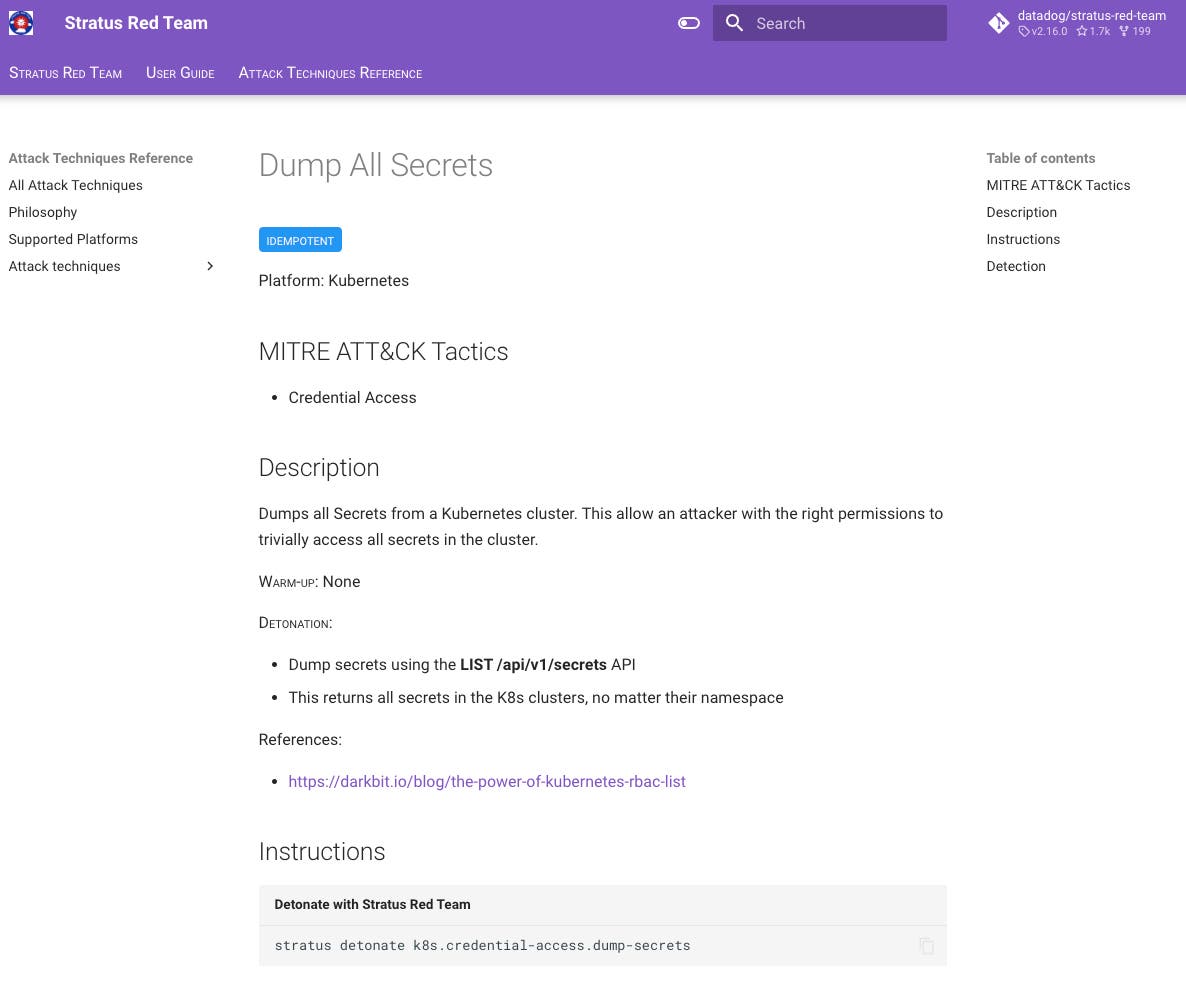
To test our query, we craft a JSON blob or utilize existing test data to forward to the logs intake endpoint. If supported, we also test with Stratus Red Team to validate the detection will fire on real actions occurring in our environment.
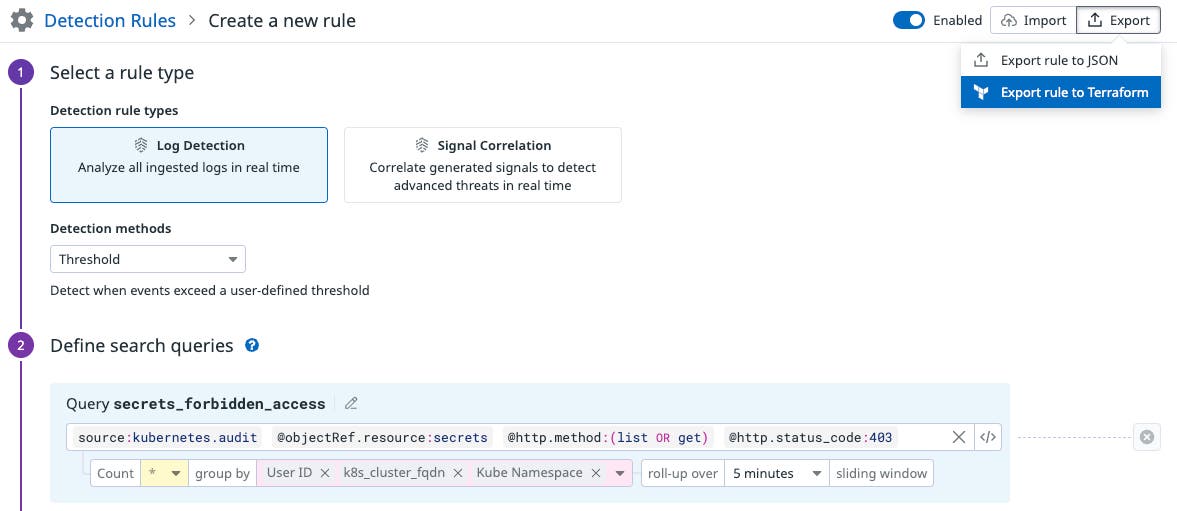
Once we have run the initial tests and are satisfied with the results of the query, we create a detection rule directly in the Datadog UI.
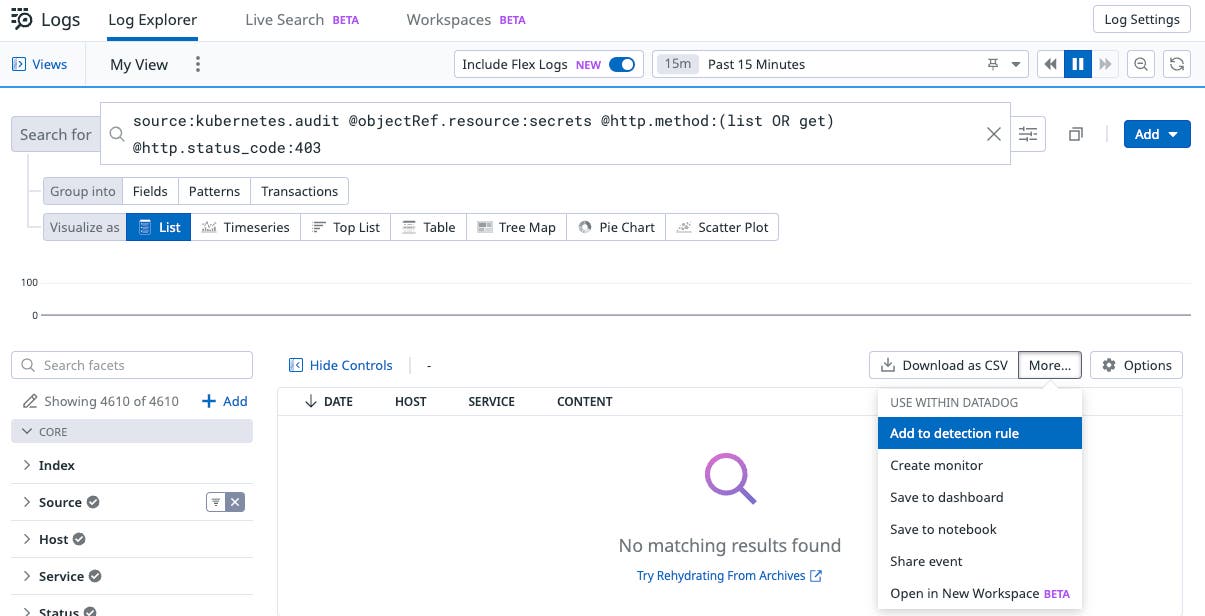
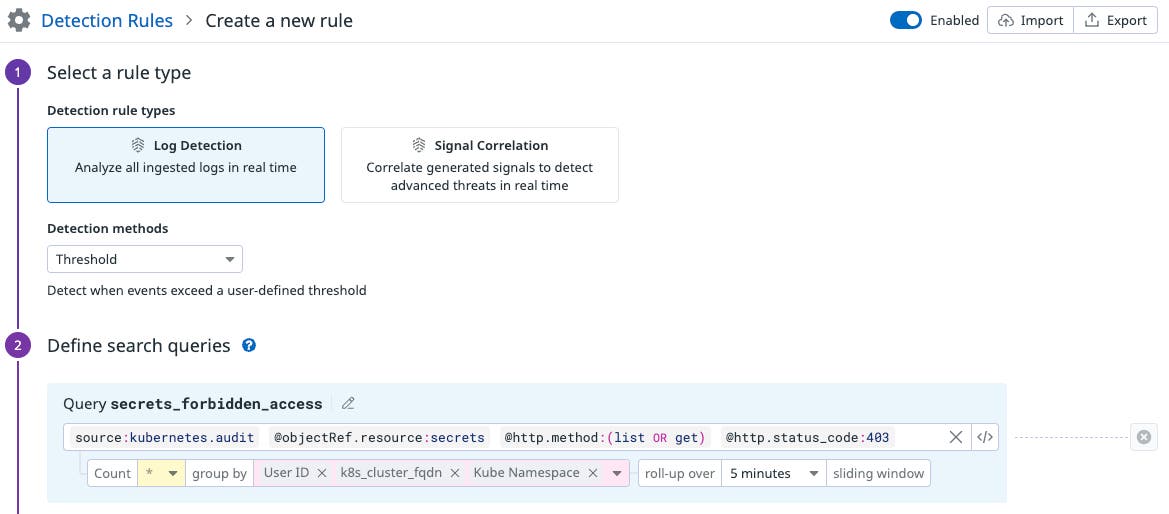
We then export the rule itself as a Terraform file directly from the UI, which is the expected format in our repository.
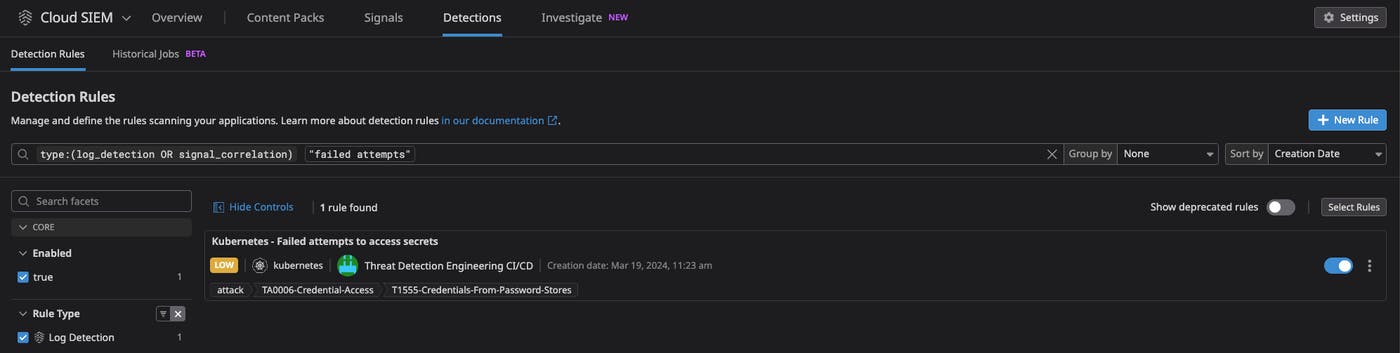
Finally, we create a pull request in our rules repository, which triggers a set of checks, including linting, testing, and generating a Terraform plan. Upon approval during code review, we then merge our new rule into the repository, which triggers another set of CI/CD jobs to deploy our rule to the specified Datadog orgs.
In this post, we discussed the key benefits that led us to adopt a detection as code methodology at Datadog. We walked you through how we put DaC concepts into practice from repository structure to CI/CD and our detection development flow. Along the way, we highlighted the critical role that Datadog Cloud SIEM, AAP, and Workload Protection play in helping us organize and simplify the rule creation process so we can create the right detections and implement them at scale across our organization.
If you want to get started building detection rules in Datadog using Cloud SIEM, AAP, or Workload Protection, check out our documentation. If you’re new to Datadog, sign up for a 14-day free trial.
此内容由惯性聚合(RSS阅读器)自动聚合整理,仅供阅读参考。 原文来自 — 版权归原作者所有。