











Emily Chang
Amazon OpsWorks is a service that is designed to simplify management of applications hosted on AWS. Based on Opscode’s Chef framework, OpsWorks helps you automate and customize the way you use Chef recipes to configure, update, and deploy applications in AWS cloud environments.
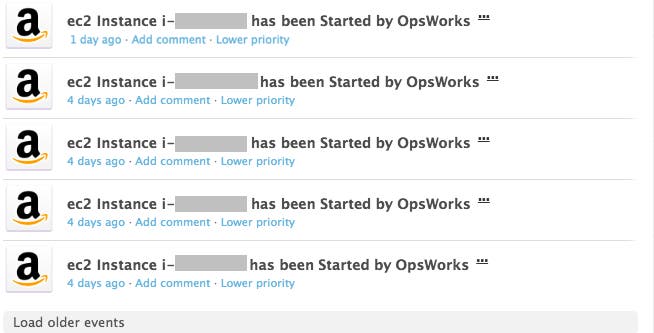
With Datadog, you’ll start to see OpsWorks events appear in your event stream, as shown in the screenshot below. You will see when OpsWorks starts or terminates instances, attaches or detaches resources to and from your stacks, and more.
AWS OpsWorks organizes your applications’ infrastructure in three tiers:
Stack: The highest-level grouping of AWS resources (EC2 instances, RDS database instances, and more) that you would like to manage collectively. For example, a web application stack might consist of three layers: your application servers, a load balancer, and a database.
Layer: A stack is composed of one or more layers that serve different functions in your application. For example, a layer might be your HAProxy load balancer, and another layer might consist of your Node.js servers. You can assign OpsWorks to automatically run different recipes on each layer based on its current lifecycle event, from setup to shutdown.
Instance: A single computing resource, such as an EC2 instance. In OpsWorks, you initialize instances as one of three types, based on your needs: 24/7, time-based, or load-based.
AWS recommends using a mix of all three instance types to handle incoming traffic efficiently and economically: a set of 24/7 instances to handle the base level of activity, time-based instances that are scheduled to kick in during periods of higher traffic, and load-based instances that will automatically scale up or down based on CPU, memory, or load-based thresholds you specify.
Once you’ve configured your OpsWorks instances, layers, and stacks, you can start to monitor their metrics. After you’ve set up the integration, Datadog will begin collecting CloudWatch metrics about your OpsWorks resources that fall into four categories:
CPU: percentage of time that CPU is handling system, user, and input/output operations.
Load: averaged over 1-, 5-, or 15-minute windows.
Memory: amount of memory that is buffered, cached, free, in use, etc.
Processes: the number of active processes.
OpsWorks automatically tags each resource with the name of its stack and layer. You can filter or aggregate your metrics by stack, layer, or instance in order to gain multiple perspectives of how effectively OpsWorks is managing your AWS resources.
You may want to graph the average CPU on your OpsWorks application server layer in a timeseries graph, to find out if you have enough resources to handle the volume of requests. This can also help you determine how to specify sensible thresholds for your load-based instances.

In the screenshot above, the user has configured OpsWorks to create instances (marked by the pink bars on the graph) whenever the layer’s average CPU utilization exceeds about 50 percent. Correlating these events with metrics from your OpsWorks layers and stacks can help you determine the best strategy for using OpsWorks to manage load-based instances as your applications continue to scale.
By integrating OpsWorks with Datadog, you can also correlate metrics with event data if, for example, you want to verify that your recipes are being executed as planned.
If you have already set up the main AWS integration in Datadog, adding OpsWorks to the mix is easy. Navigate to the AWS Integration tile and click the AWS OpsWorks checkbox under “Limit metric collection.”
Once you’ve enabled OpsWorks, Datadog will automatically begin gathering your metrics. To pull OpsWorks events into Datadog, you can set up our AWS CloudTrail integration as well. If you’re not yet a Datadog customer, start a free 14-day trial here.
此内容由惯性聚合(RSS阅读器)自动聚合整理,仅供阅读参考。 原文来自 — 版权归原作者所有。