




Software development and delivery requires cross-team collaboration and cross-service orchestration—all while ensuring that organizational standards for quality, security, and compliance are consistently met. Without careful monitoring, you risk a lack of visibility into delivery workflows, making it difficult to evaluate how they impact release velocity and stability, developer experience, and application performance.
To monitor this important aspect of the software development life cycle (SDLC), many organizations are tracking and evaluating DevOps Research and Assessment (DORA) metrics. These metrics can be useful for any team that develops and ships software, but because they provide a holistic view into the entire SDLC, they are especially valuable to teams engaged in both DevOps practices like automating builds, tests, and deployments via CI/CD pipelines and SRE practices designed to improve reliability.
At the same time, collecting these metrics presents its own set of challenges, with decisions about which data points to collect and how to collect them often left to individual team leads. Additionally, once the data is gathered, it can be difficult to translate these findings into actionable insights that engineering teams and leaders can use to enact meaningful change.
In this post, we’ll explore:
The basics of DORA metrics
Strategies for measuring DORA metrics at your organization
How you can use DORA metrics to improve your development workflows
How Datadog can help you monitor DORA metrics and streamline software delivery
To help engineering teams better understand how software delivery practices are being implemented across the industry, Google’s DORA team conducts annual surveys of working IT professionals. Based on these findings, the DORA team has identified four key metrics that act as indicators of developer team performance, particularly when it comes to deploying software quickly and reliably. You can learn more about them in the table below:
| Metric | What it measures |
|---|---|
| Deployment frequency | How often do your teams deploy code to production or otherwise release it to end users? |
| Lead time for changes | How long does it take for code commits to successfully be deployed into production? |
| Time to restore services | How long does it take to restore services when failures occur? |
| Change failure rate | What’s the rate of changes released to production that contain issues or lead to failures in production? |
DORA metrics bridge the gap between production system-based metrics and development-based ones, giving you quantitative measurements that complement qualitative insights when studying engineering performance and experience. Indeed, DORA metrics can help you understand two key aspects of your engineering processes: speed and stability. Generally speaking, deployment frequency and change lead time correspond with throughput, while time to restore service and change failure rate measure stability.
Contrary to how many teams have viewed speed and stability in the past—as competing trade-offs—the DORA team has found that they strongly correlate with each other when looking at overall performance. The DORA team also found that DORA metrics tend to correlate with certain measures of system success, especially availability. Therefore, DORA metrics can generate insights that benefit your application in more ways than one: yes, your delivery workflows and developer experience, but also your overall app performance and reliability.
While DORA metrics may seem clear-cut at first glance, there is often ambiguity in how organizations measure them. As a result, many teams have to make challenging decisions about exactly which data points to use. Even though these decisions can vary based on the team or organization’s goals for using DORA Metrics, there are some practical guidelines that can be followed in order to streamline data collection and ensure that DORA metrics are accurate and actionable.
Establishing a unified process of monitoring DORA metrics at your organization can be challenging. You need to create a set of standardized definitions to help you collect these metrics, but differing internal procedures, priorities, and tooling across your teams can complicate this.
To make this effort easier, you should consider the scope of your analyses. Perhaps you only want to track performance within a specific department—if this is the case, you can focus your standardization efforts on only those specific teams. Or maybe you’d like to look at certain aspects of your software delivery processes, such as your testing strategy. Additionally, you should consider the amount and type of work required by different kinds of analyses. For example, cross-team studies often involve translating data points from the many different platforms and tools that teams use in their workflows into data points that can be easily applied to how you define DORA metrics for the scope you have chosen.
Once you’ve decided on the appropriate scope, you can answer a few key questions to come up with a common set of data points that your team should use. This will likely involve determining what data is most meaningful for your team, departmental, or organizational goals. Additionally, you can use the scope you’ve established to determine how you want to prioritize insights based on the needs of each team. For example, as platform engineering teams often dedicate much of their time to streamlining delivery workflows and removing deployment blockers, they may be more concerned with velocity. As a result, they might be more interested in findings relating to deployment frequency and change lead time. On the other hand, SRE teams generally focus on application stability, so it may make sense for them to prioritize change failure rate and time to restore service.
In either case, scoping your metrics to specific repositories, services, and teams can give you more granular information about where and how to prioritize impactful changes. For example, you may want to define the scope of your analysis based on the criticality of certain services or size of a repository. Doing so might highlight an outdated, difficult-to-debug legacy service that’s severely impacting your teams’ processes and help you justify devoting resources to improving it. If your goal is to prove that best practices are indeed best practices, you can select a team that isn’t following best practices or using tools in the golden path and a team that is, so that you can compare the differences in results. And if you know you want to roll out DORA across the organization at some point, you can scope your initial analysis to what will produce the most robust results with the resources you have in order to demonstrate their value. That being said, this is truly about prioritization, not about which metrics should be included or excluded from your analyses.
After you’ve developed a unified approach to how you scope your DORA metrics, you can ask a few key questions to confirm that everyone at your organization is collecting useful, compatible data points.
What counts as a successful deployment?
To calculate metrics such as deployment frequency, you need to arrive at a standard definition for what your organization considers a successful deployment. While this question can seem straightforward, many teams have different standards for what counts as a deployment worth measuring. For example, at what point do you consider progressive releases “executed”: when the deployments first begin, when they reach a certain threshold of users, or when they reach all users? Additionally, different teams may have different requirements for the deployments they want to measure. Some may want to include every merge to development, staging, and production environments, while other teams may only want to focus on merges to production. Note that teams across an organization can easily use varying definitions, they will just need to take any differences into account when interpreting their metrics.
What counts as a failure or a response?
As with deployments, many teams also have different definitions for what counts as a system failure. Determining this is essential for calculating metrics such as the change failure rate. It might be tempting to consider any issue that could affect end users as a failure, but many teams will likely want to exclude incidents in otherwise stable environments from factoring into DORA metrics. These incidents—which could be caused by unforeseeable infrastructure issues, such as faulty hardware—often don’t have any connection to the code your developers release and therefore don’t speak directly to the reliability of your delivery processes. The distinction between incidents and failures can be tricky to define—many organizations consider them one and the same, while others look at signals from application performance, SLOs, and user experience impacts in place of (or in addition to) incidents. You’ll want to make sure the way a failure is defined is clearly established and communicated across teams.
When does an incident start? When is it considered resolved?
With regard to failures, incidents can bring their own collection of considerations. Teams that don’t have established, organization-wide incident management processes often struggle to document exactly when incidents begin or end—or even what counts as an incident. Even in the best-case scenarios when organizations have comprehensive tooling and procedures established for handling incidents alongside reliable sources of truth, teams can still struggle to make decisions about exactly which data points to use.
For example, there are many ways to measure when an incident starts:
When the issue is first detected in the system
When the incident is formally created in the system
When the developer starts working on a fix
For that matter, there are multiple points at which you could consider an incident resolved:
When the fix is deployed
When the issue is closed
When the customer impact is resolved
Figuring out which data points are most relevant to your teams’ performance is essential to calculating the time to restore services metric. Do you want to measure how quickly incidents are detected and acted upon, or do you want to focus on how quickly your teams can perform root cause analysis and deploy a solution?
What time spans should you base your analysis on?
Lastly, you’ll want to consider the time spans you’ll use when analyzing your data. Determining the size of your time spans is essential for calculating deployment frequency. This will depend on factors such as the size of your organization, the age of your tech stack, your delivery methodology (e.g., agile, waterfall, etc.), and your KPIs. For instance, teams with more modern tech stacks who deliver software more frequently will likely want to use a shorter time span—such as the daily deployment rate—whereas teams that deliver less often may want to track weekly or monthly deployments. You’ll want to create a bucket that’s realistic given how often your teams actually deploy, but not one that is so large that issues go undetected. This will often involve taking into account considerations that might affect metrics for your specific team, service, or repository, such as recent migrations.
By identifying aspects of your development and delivery processes that are inefficient, DORA metrics can help you adjust your CI/CD tooling to create more effective processes. This is particularly true for teams that are attempting to automate certain aspects of their delivery workflows, as DORA metrics can reveal problems that teams may be unaware of due to not being involved in day-to-day upkeep. Alternatively, these metrics can also reveal areas where automation can be used to promote greater efficiency by handling rote, time-consuming tasks.
Let’s say that while analyzing your DORA metrics, you realize that your team has a long change lead time, resulting in lengthy delays between releases. To address this, you can look at the duration of your CI pipelines and tests. Tests and pipelines that are needlessly long may need reevaluating, particularly with an eye towards removing unnecessary steps or automating steps that involve manual approvals. If you discover that your test suite is too complex, you may also want to determine exactly what you want to test for each deployment.
On the other hand, if you notice a high change failure rate, you may want to start requiring automated tests and scans in order to reduce the likelihood of issues slipping into production. You might also want to look for flaky tests and error-prone jobs, which can impact your ability to accurately and reliably detect issues in your deployments. DORA metrics might not provide the exact solution for each pipeline issue, but by acting as indicators of where your teams are struggling, they give you starting points for further analysis.
To help you optimize your developer workflows based on your DORA metrics findings, Datadog offers a wide variety of performance monitoring, continuous integration, code quality, and incident response tools. Our DORA metrics page makes it easy to monitor the four key metrics from one centralized location, with color-coded change rates and timeseries graphs that enable you to quickly spot variations in performance over time. Additionally, with breakdowns by characteristics such as service, environment, and teams, you can easily change the scope of your analyses based on the variables you’re most interested in.
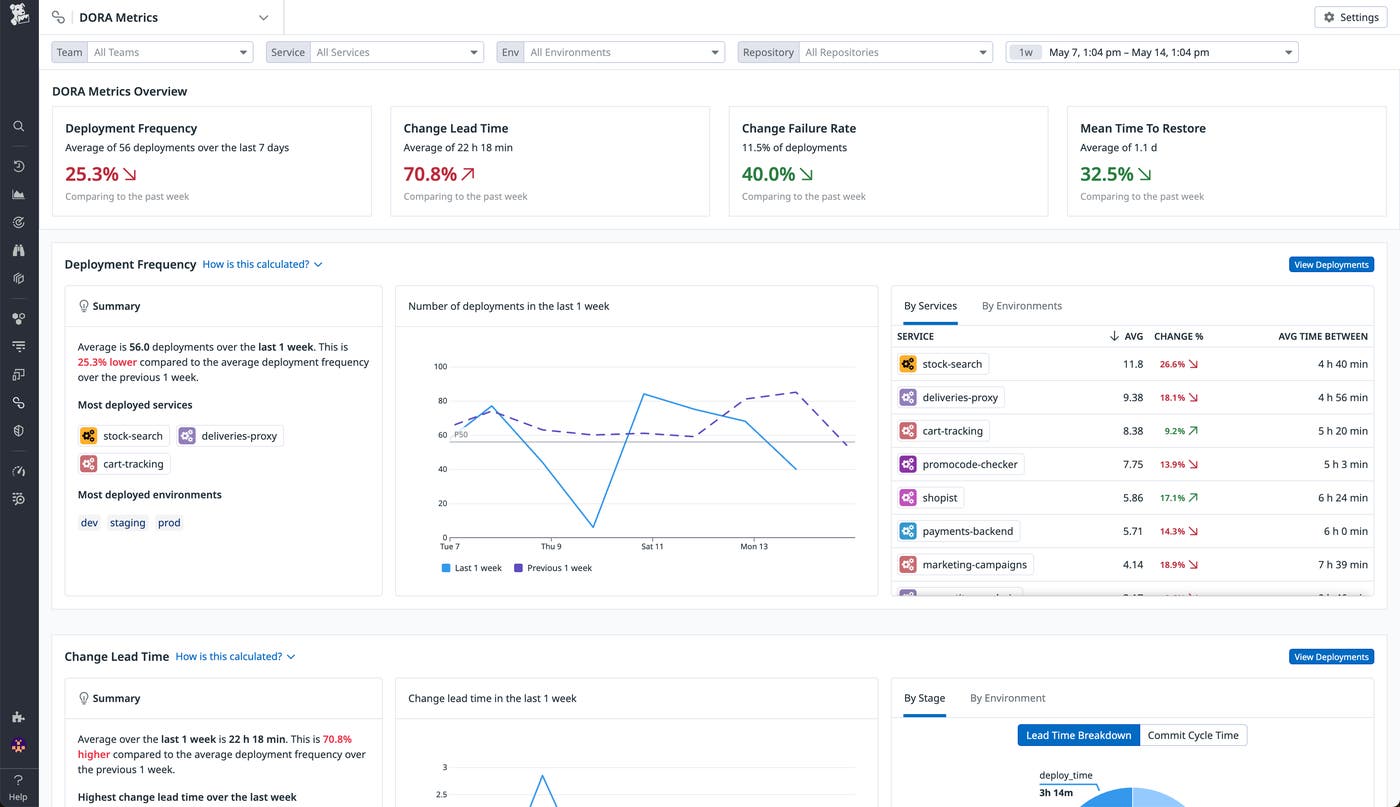
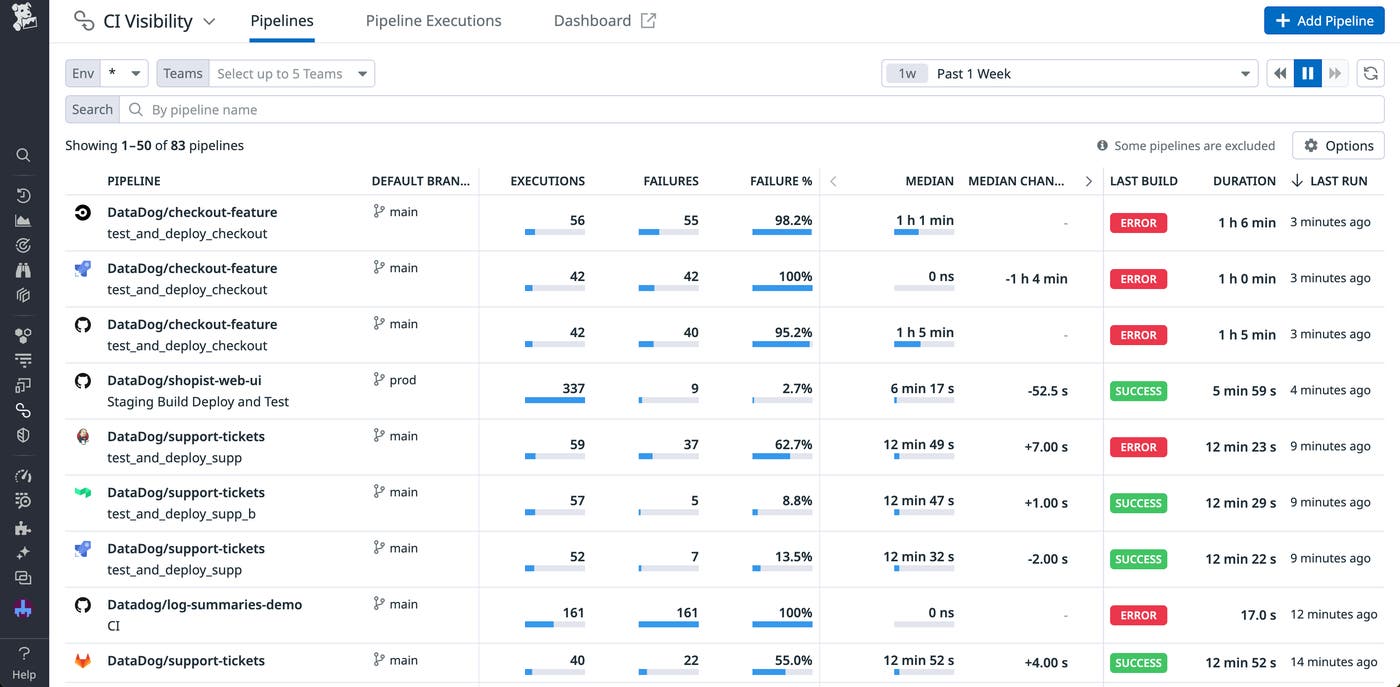
Once you’ve identified problem areas from these metrics, you can then easily pivot to Datadog features that enable you to optimize each step of your delivery workflows. With CI Visibility, you can monitor every step of your CI pipelines and quickly spot inefficiencies, including lengthy or high-failure jobs as well as flaky or irrelevant tests. You can even quickly narrow down individual stages or jobs that could be causing failures, slowing down productivity, and increasing CI costs. You can also reduce test flakiness and lower the test failure rate with Test Visibility, as well as save time and resources by using Intelligent Test Runner to execute only the most relevant tests for each deployment. Additionally, CI Visibility integrates with features such as Quality Gates, which enables you to stop problematic code from getting to production in the first place.
If an error-filled release does end up reaching users, Datadog offers tools that help you quickly identify the issue and improve your overall time to restore service. For fast, context-enriched root cause analysis, Datadog provides you with automatic correlations between traces, metrics, logs, security signals, and more. Dynamic Instrumentation enables you to add telemetry to your code without the need to restart services, saving you time during critical investigations, and you can use continuous code profiling to quickly pinpoint problematic production code. For larger issues, Incident Management makes it easy to create, investigate, and resolve incidents collaboratively.
You can get started with all these features in Datadog today. If you’re not yet a Datadog user, you can also try out these features by signing up for a 14-day free trial.
此内容由惯性聚合(RSS阅读器)自动聚合整理,仅供阅读参考。 原文来自 — 版权归原作者所有。