








This post is part 1 of a 3-part series on monitoring Amazon ElastiCache performance. Part 2 explains how to collect ElastiCache performance metrics, and Part 3 describes how Coursera monitors ElastiCache performance.
ElastiCache is a fully managed in-memory cache service offered by AWS. A cache stores often-used assets (such as files, images, css) to respond without hitting the backend and speed up requests. Using a cache greatly improves throughput and reduces latency of read-intensive workloads.
AWS allows you to choose between Redis and Memcached as caching engine that powers ElastiCache. Among the thousands of Datadog customers using ElastiCache, Redis is much more commonly used than Memcached. But each technology presents unique advantages depending on your needs. AWS explains here how to determine which one is more adapted to your usage.
An efficient cache can significantly increase your application’s performance and user navigation speed. That’s why key performance metrics need to be well understood and continuously monitored, using both generic ElastiCache metrics collected from AWS CloudWatch but also native metrics from your chosen caching engine. The metrics you should monitor fall into four general categories:
Client metrics
Cache performance
Memory metrics
Other host-level metrics
Metrics can be collected from ElastiCache through CloudWatch or directly from your cache engine (Redis or Memcached). Many of them can be collected from both sources: from CloudWatch and also from the cache. However, unlike CloudWatch metrics, native cache metrics are usually collected in real-time at higher resolution. For these reasons you should prefer monitoring native metrics, when they are available from your cache engine.
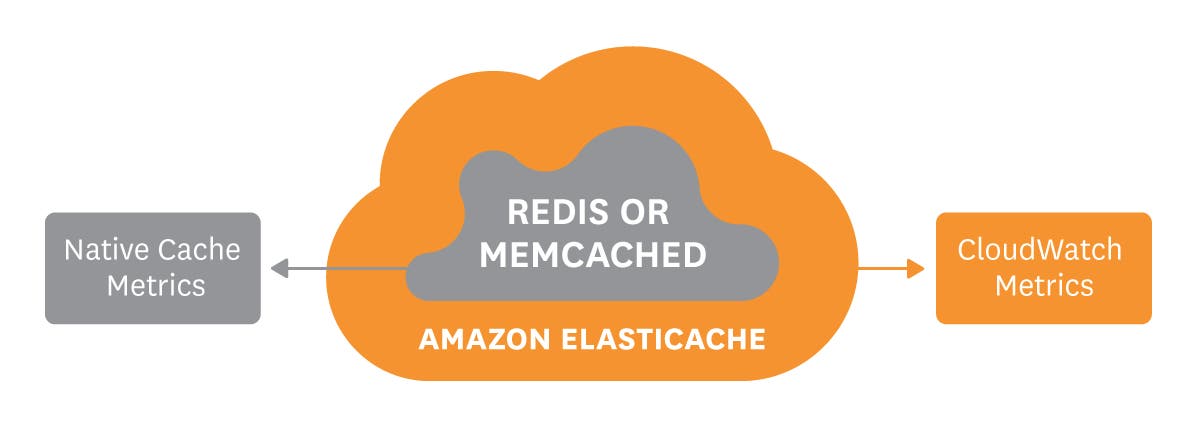
For each metric discussed in this publication, we provide its name as exposed by Redis and Memcached, as well as the name of the equivalent metric available through AWS CloudWatch, where applicable.
If you are using Redis, we also published a series of posts focused exclusively on how to monitor Redis native performance metrics.
This article references metric terminology introduced in our Monitoring 101 series, which provides a framework for metric collection and alerting.
Client metrics measure the volume of client connections and requests.
| Metric description | Redis | Memcached | CloudWatch | Metric Type |
|---|---|---|---|---|
| Number of current clientconnections to the cache | connected_clients | curr_connections | CurrConnections | Resource: Utilization |
| Number of Get commands received by the cache | - | cmd_get | GetTypeCmds (Redis), CmdGet (Memcached) | Work: Throughput |
| Number of Set commands received by the cache | - | cmd_set | SetTypeCmds (Redis), CmdSet (Memcached) | Work: Throughput |
Number of commands processed is a throughput measurement that will help you identify latency issues, especially with Redis, since it is single threaded and processes command requests sequentially. Unlike Memcached, native Redis metrics don’t distinguish between Set or Get commands. ElastiCache provides both for each technology.

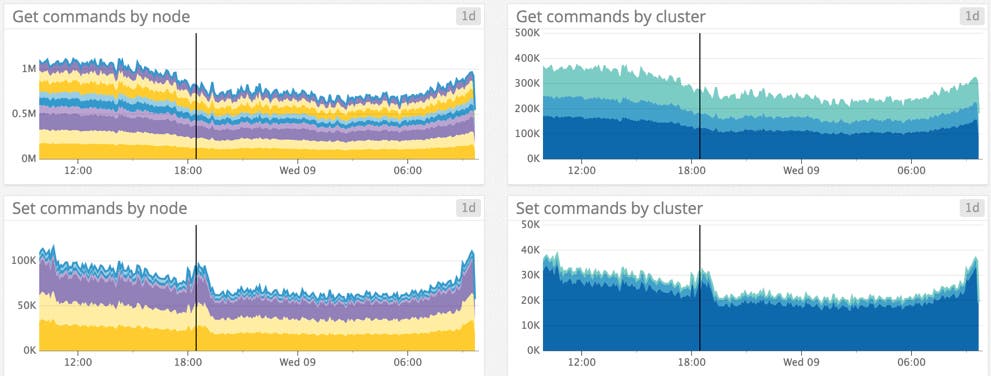
Current connections: While sudden changes might indicate application issues requiring investigation, you should track this metric primarily to make sure it never reaches the connections limit. If that happens new connections will be refused, so you should make sure your team is notified and can scale up way before that happens. If you are using Memcached, make sure the parameter maxconns_fast has its default value 0 so that new connections are queued instead of being closed, as they are if maxconns_fast is set to 1. AWS fixes the limit at 65,000 simultaneous connections for Redis (maxclients) and Memcached (max_simultaneous_connections).
NOTE: ElastiCache also provides the NewConnections metric measuring the number of new connections accepted by the server during the selected period of time.
By tracking Elasticache performance metrics you will be able to know at a glance if your cache is working properly.
| Metric description | Redis | Memcached | CloudWatch | Metric Type |
|---|---|---|---|---|
| Hits: Number of requested files that were served from the cache without requesting to the backend | keyspace_hits | get_hits | CacheHits (Redis), GetHits (Memcached) | Other |
| Misses: Number of times a request was answered by the backend because the item was not cached | keyspace_misses | get_misses | CacheMisses (Redis), GetMisses (Memcached) | Other |
| Replication Lag: Time taken for a cache replica to update changes made in the primary cluster | - | - | ReplicationLag (Redis) | Other |
| Latency: Time between the request being sent and the response being received from the backend | See * below | - | - | Work: Performance |
Tracking replication lag, available only with Redis, helps to prevent serving stale data. Indeed, by automatically synchronizing data into a secondary cluster, replication ensures high availability, read scalability, and prevents data loss. Replicas contain the same data as the primary node so they can also serve read requests. The replication lag measures the time needed to apply changes from the primary cache node to the replicas. You can also look at the native Redis metric master_last_io_seconds_ago which measures the time (in seconds) since the last interaction between slave and master.
Cache hits and misses measure the number of successful and failed lookups. With these two metrics you can calculate the hit rate: hits / (hits+misses), which reflects your cache efficiency. If it is too low, the cache’s size might be too small for the working data set, meaning that the cache has to evict data too often (see evictions metric below). In that case you should add more nodes which will increase the total available memory in your cluster so more data can fit in the cache. A high hit rate helps to reduce your application response time, ensure a smooth user experience and protect your databases which might not be able to address a massive amount of requests if the hit rate is too low.
* NOTE: Latency is not available like other classic metrics, but still attainable: you will find all details about measuring latency for Redis in this post, part of our series on Redis monitoring. Latency is one of the best ways to directly observe Redis performance. Outliers in the latency distribution could cause serious bottlenecks, since Redis is single-threaded—a long response time for one request increases the latency for all subsequent requests. Common causes for high latency include high CPU usage and swapping. This publication from Redis discusses troubleshooting high latency in detail.
Unfortunately, Memcached does not provide a direct measurement of latency, so you will need to rely on throughput measurement via the number of commands processed, described below.
Memory is the essential resource for any cache, and neglecting to monitor ElastiCache’s memory metrics can have critical impact on your applications.
| Metric description | Redis | Memcached | CloudWatch | Metric Type |
|---|---|---|---|---|
| Memory usage: Total number of bytes allocated by the cache engine | used_memory | bytes | BytesUsedForCache (Redis), BytesUsedForCacheItems (Memcached) | Resource: Utilization |
| Evictions: Number of (non-expired) items evicted to make space for new writes | evicted_keys | evictions | Evictions | Resource: Saturation |
| The amount of free memory available on the host. | - | - | FreeableMemory | Resource: Utilization |
| Swap Usage | - | - | SwapUsage | Resource: Saturation |
| Memory fragmentation ratio: Ratio of memory used (as seen by the operating system) to memory allocated by Redis | memfragmentationratio | - | - | Resource: Saturation |
Memory usage is critical for your cache performance. If it exceeds the total available system memory, the OS will start swapping old or unused sections of memory (see next paragraph). Writing or reading from disk is up to 100,000x slower than writing or reading from memory, severely degrading the performance of the cache.
Evictions happen when the cache memory usage limit (maxmemory for Redis) is reached and the cache engine has to remove items to make space for new writes. Unlike the host memory, which leads to swap usage when exceeded, the cache memory limit is defined by your node type and number of nodes. The evictions follow the method defined in your cache configuration, such as LRU for Redis. Evicting a large number of keys can decrease your hit rate, leading to longer latency times. If your eviction rate is steady and your cache hit rate isn’t abnormal, then your cache has probably enough memory. If the number of evictions is growing, you should increase your cache size by migrating to a larger node type (or adding more nodes if you use Memcached).
FreeableMemory, tracking the host’s remaining memory, shouldn’t be too low, otherwise it will lead to Swap usage (see next paragraph).
SwapUsage is a host-level metric that increases when the system runs out of memory and the operating system starts using disk to hold data that should be in memory. Swapping allows the process to continue to run, but severely degrades the performance of your cache and any applications relying on its data. According to AWS, swap shouldn’t exceed 50MB with Memcached. AWS makes no similar recommendation for Redis.
The memory fragmentation ratio metric (available only with Redis) measures the ratio of memory used as seen by the operation system (used_memory_rss) to memory allocated by Redis (used_memory). The operating system is responsible for allocating physical memory to each process. Its virtual memory manager handles the actual mapping, mediated by a memory allocator. For example, if your Redis instance has a memory footprint of 1GB, the memory allocator will first attempt to find a contiguous memory segment to store the data. If it can’t find one, the allocator divides the process’s data across segments, leading to increased memory overhead. A fragmentation ratio above 1.5 indicates significant memory fragmentation since Redis consumes 150 percent of the physical memory it requested. If the fragmentation ratio rises above 1.5, your memory allocation is inefficient and you should restart the instance. A fragmentation ratio below 1 means that Redis allocated more memory than the available physical memory and the operating system is swapping (see above).
Host-level metrics for ElastiCache are only available through CloudWatch.
| Metric description | Name in CloudWatch | Metric Type |
|---|---|---|
| CPU utilization | CPUUtilization | Resource: Utilization |
| Number of bytes read from the network by the host | NetworkBytesIn | Resource: Utilization |
| Number of bytes written to the network by the host | NetworkBytesOut | Resource: Utilization |
CPU Utilization at high levels can indirectly indicate high latency. You should interpret this metric differently depending on your cache engine technology.
All AWS cache nodes with more than 2.78GB of memory or good network performance are multicore. Be aware that if you are using Redis, the extra cores will be idle since Redis is single-threaded. The actual CPU utilization will be equal to this metric’s reported value multiplied by the number of cores. For example a four-core Redis instance reporting 20 percent CPU utilization actually has 80 percent utilization on one core. Therefore you should define an alert threshold based on the number of processor cores in the cache node. AWS recommends that you set the alert threshold at 90 percent divided by the number of cores. If this threshold is exceeded due to heavy read workload, add more read replicas to scale up your cache cluster. If it’s mainly due to write requests, increase the size of your Redis cache instance.
Memcached is multi-threaded so the CPU utilization threshold can be set at 90%. If you exceed that limit, scale up to a larger cache node type or add more cache nodes.
Most of these key Elasticache performance metrics are directly linked together. For example, high memory usage can lead to swapping, increasing latency. That’s why you need to correlate these metrics in order to properly monitor ElastiCache performance.
Correlating metrics with events sent by ElastiCache, such as node addition failure or cluster creation, will also help you to investigate and to keep an eye on your cache cluster’s activity.

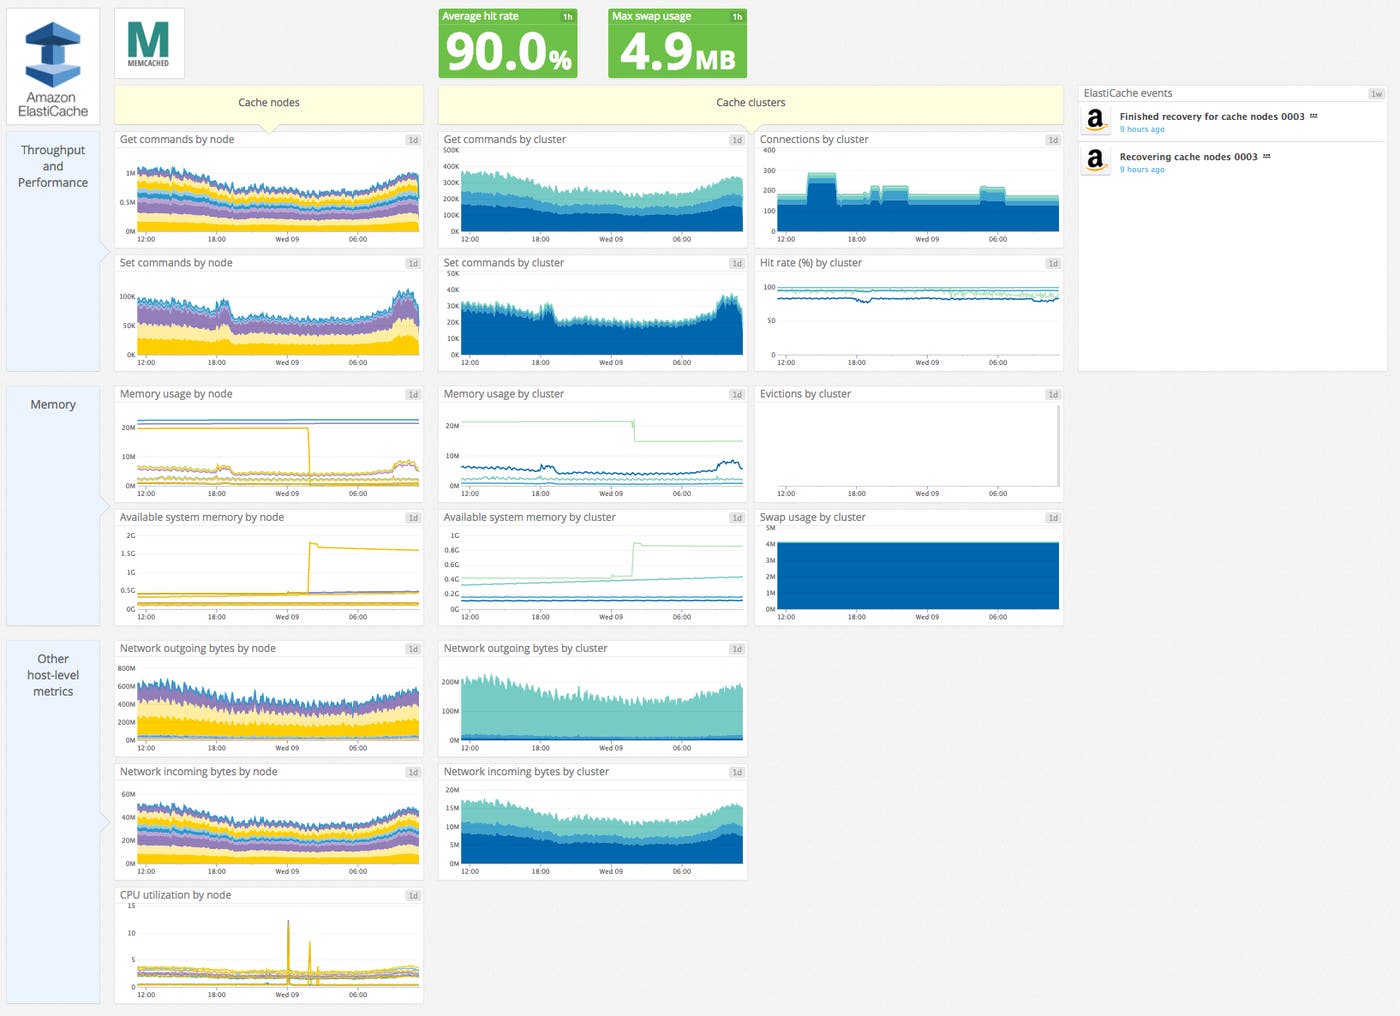
In this post we have explored the most important ElastiCache performance metrics. If you are just getting started with Amazon ElastiCache, monitoring the metrics listed below will give you great insight into your cache’s health and performance:
Number of current connections
Hit rate
Memory metrics (especially evictions and swap usage)
CPU Utilization
Part 2 of this series provides instructions for collecting all the metrics you need to monitor ElastiCache.
此内容由惯性聚合(RSS阅读器)自动聚合整理,仅供阅读参考。 原文来自 — 版权归原作者所有。