


惯性聚合 高效追踪和阅读你感兴趣的博客、新闻、科技资讯
阅读原文 在惯性聚合中打开

推荐订阅源

S
SegmentFault 最新的问题
G
Google Developers Blog
H
Help Net Security
月光博客
月光博客
阮一峰的网络日志
阮一峰的网络日志
钛媒体:引领未来商业与生活新知
钛媒体:引领未来商业与生活新知
P
Proofpoint News Feed
Cyber Security Advisories - MS-ISAC
B
Blog RSS Feed
爱范儿
爱范儿
酷 壳 – CoolShell
酷 壳 – CoolShell
博客园 - 三生石上(FineUI控件)
大猫的无限游戏
大猫的无限游戏
人人都是产品经理
人人都是产品经理
GbyAI
GbyAI
D
Docker
Hugging Face - Blog
Hugging Face - Blog
I
InfoQ
博客园 - 司徒正美
Last Week in AI
Last Week in AI
Microsoft Security Blog
美团技术团队
Stack Overflow Blog
Stack Overflow Blog
M
MIT News - Artificial intelligence

Datadog | The Monitor blog

Introducing our open source AI-native SAST Instrument and monitor Boomi integration flows with OpenTelemetry and Datadog Not all index scans are equal: How we cut query latency by over 99% Platform engineering metrics: What to measure and what to ignore Integrate Recorded Future threat intelligence with Datadog Cloud SIEM CI/CD security: threat modeling using a MITRE-style threat matrix CI/CD security: How to secure your GitHub ecosystem Ingress NGINX is EOL: A practical guide for migrating to Kubernetes Gateway API Operating agentic AI with Amazon Bedrock AgentCore and Datadog LLM Observability: Lessons from NTT DATA Introducing the Datadog Code Security MCP Capture and analyze custom heatmaps in Session Replay Understand session replays faster with AI summaries and smart chapters Monitor ClickHouse query performance with Datadog Database Monitoring How we designed empathetic alert sounds for on-call engineers Search and act across Datadog to resolve issues faster with Bits Assistant Measure the business impact of every product change with Datadog Experiments Analyzing round trip query latency Configuring JavaScript caches for better performance Introducing Bits AI Dev Agent for Code Security Datadog achieves ISO 42001 certification for responsible AI Monitor Nutanix clusters, hosts, and VMs with Datadog Monitor Juniper Mist in Datadog A new Host Map for modern infrastructure Annotate traces to improve LLM quality with Datadog LLM Observability What’s new in Cloud SIEM: AI-powered investigations, enhanced threat intelligence, and scalable security operations Explore Kubernetes with native OpenTelemetry data Monitor Oracle Fusion Cloud Applications with Datadog Announcing the Datadog Terraform provider v4.0.0 Scaling Kubernetes workloads on custom metrics How to design cloud environments for AI-powered threat analysis
Monitor your AWS Lambda functions’ ephemeral storage usage
Thomas Sobolik, Alex Cuoci · 2022-03-24 · via Datadog | The Monitor blog
Thomas Sobolik

Thomas Sobolik

Senior Technical Content Writer

Alex Cuoci

Alex Cuoci

AWS Lambda is AWS’s solution for highly portable, serverless computing. With Lambda functions, you can deploy and run business logic code without managing the underlying servers. Today, AWS announced that Lambda customers can now provision up to 10 GB of ephemeral storage for each of their functions, making them well-suited for new, data-intensive workloads—including machine learning inference, large media file processing, financial analysis, and more.

Datadog is supporting this new announcement by enriching existing Datadog metrics with a new tag to help you keep track of your functions’ ephemeral storage usage and capacity. In this post, we’ll show you how to provision your Lambda functions with increased ephemeral storage, as well as monitor their configurations in Datadog.

Configuring your functions’ ephemeral storage

You can quickly and easily provision your Lambda functions’ ephemeral storage capacity by using the AWS console. The function configuration page now includes a new option for “ephemeral storage,” which is located under the General Configuration tab. You can edit the field to specify a storage amount—any value between 512 and 10240 MB is acceptable.
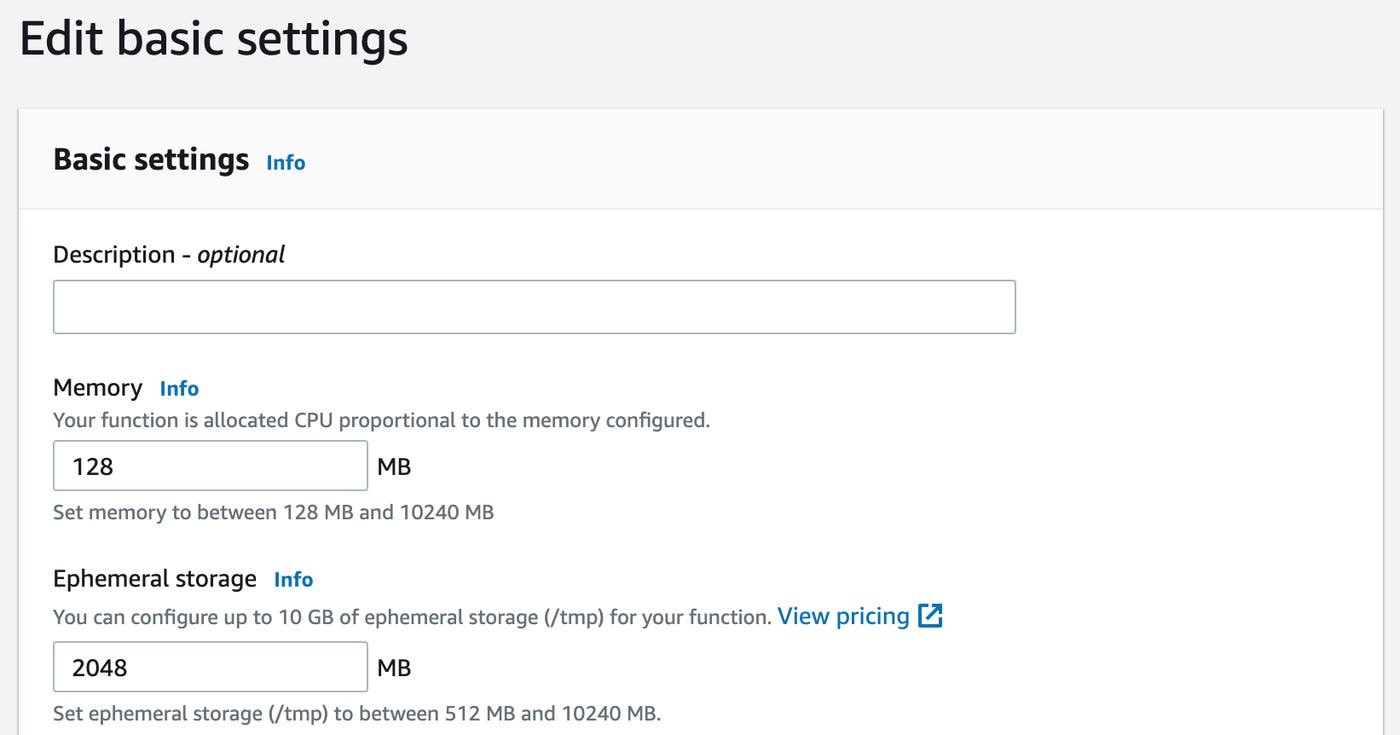
Setting the ephemeral storage capacity of a function in the AWS console

You can also configure your functions programmatically with the Lambda API or the AWS SDK, or use the AWS CLI to edit your functions’ settings from the command line. This ensures that you can manage your functions’ ephemeral storage without any adjustments to your existing workflows. For more information on configuring your functions’ ephemeral storage, see the AWS Lambda documentation.

Monitor your storage configuration and usage in Datadog

To complement the Lambda ephemeral storage update, the Datadog Lambda extension now automatically tags all functions by storagesize, which enables you to query or filter them by storage configuration from within Datadog’s Serverless view. For example, you may want to isolate functions with the minimum allocated storage capacity, so you can drill into their memory usage and determine if it’s worthwhile to configure more storage.
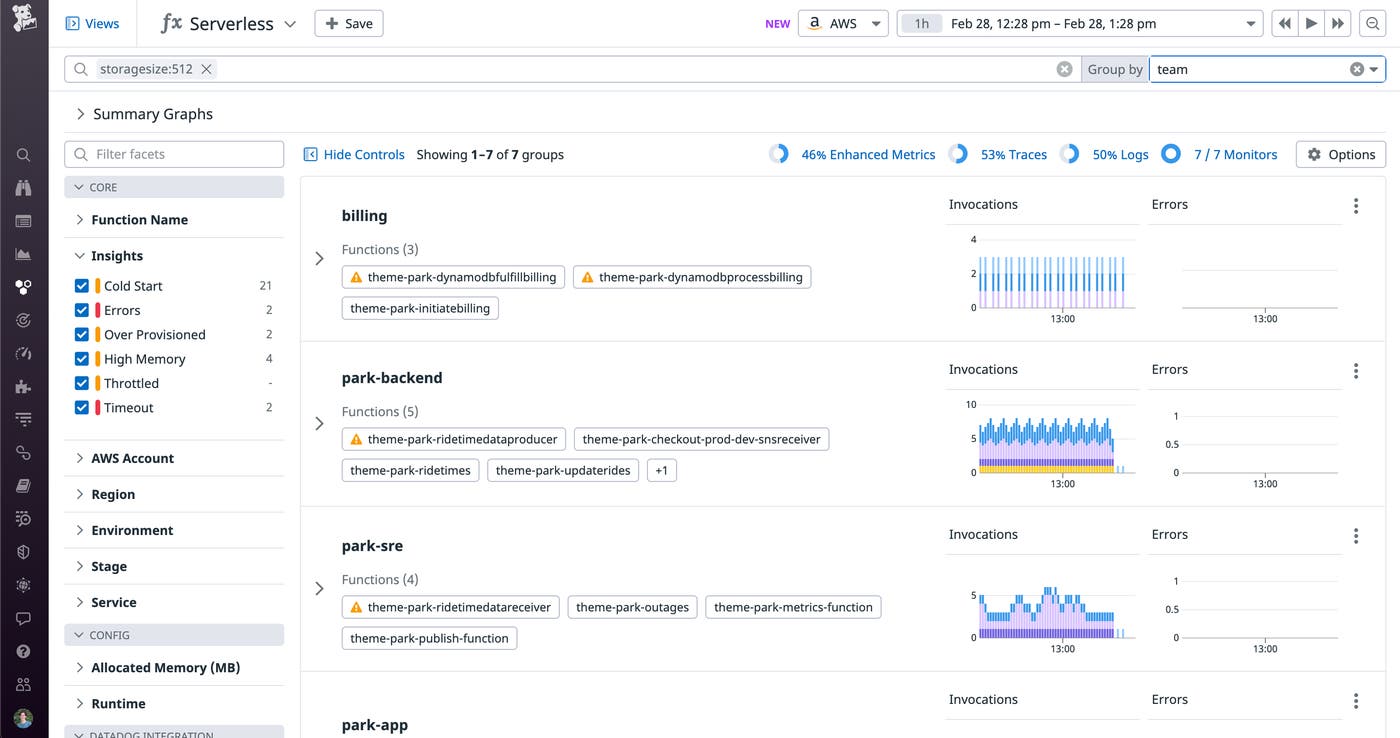
Querying functions in the serverless view using the ephemeral storage capacity tag

Get more Lambda storage

AWS has announced support for up to 10 GB of ephemeral storage for Lambda functions, which will enable them to handle new data-intensive workloads. To support this launch, Datadog’s Lambda extension now allows you to easily track your new configurations to ensure your functions are well-provisioned and highly performant.

For more information about this update, see AWS’s documentation. You can also refer to our own documentation for more information about the Datadog Lambda extension. Or, if you’re brand new to Datadog, get started with a 14-day free trial.