


Kubernetes continues to be a popular platform for deploying containerized applications, but securing Kubernetes environments as you scale up is challenging. Each new container increases your application’s attack surface, or the number of potential entry points for unauthorized access. Without complete visibility into every managed container and application request, you can easily overlook gaps in your application’s security as well as malicious activity.
Kubernetes audit logs provide a complete record of activity (e.g., the who, where, when, and how) in your Kubernetes control plane. Monitoring your audit logs can be invaluable in helping you detect and mitigate misconfigurations or abuse of Kubernetes resources before confidential data is compromised. However, Kubernetes components and services can generate millions of log events per day, so knowing which logs to focus on is difficult.
In this post, we’ll cover:
how to interpret Kubernetes audit logs
some key audit logs for monitoring Kubernetes cluster security
how Datadog can help you monitor your audit logs and alert you to suspicious activity in your environments
First, we’ll briefly look at audit log policies and how Kubernetes uses them to generate audit logs.
When a request comes in to the Kubernetes API server, it can create one of several different audit events such as creating a new pod or service account. The server filters these events through an audit policy. An audit policy is a set of rules that specifies which audit events should be recorded and where they should be sent, for example to either a JSON log file or an external API backend for storage.
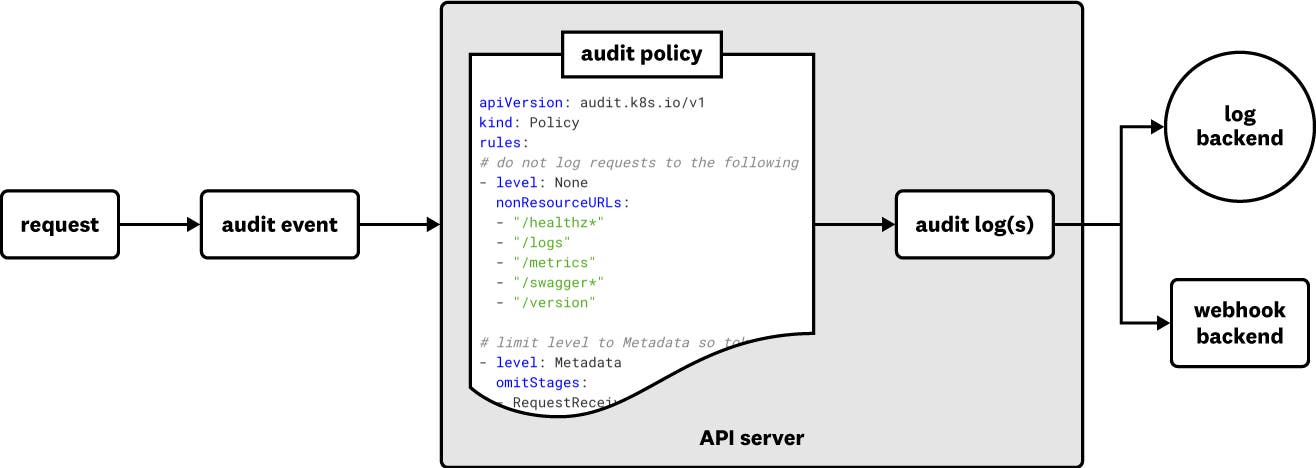
The scope of cluster activity that Kubernetes will capture with audit logs depends on your audit policy’s configuration and the levels you set for each of your resources, so it’s important that the policy collects the data you need for monitoring Kubernetes security. Otherwise, you may not be able to easily surface legitimate threats to your applications. For instance, a policy that doesn’t collect data about pod activity makes it more difficult to know when an unauthorized account creates new pods with privileged containers. On the other hand, policies that collect audit events from endpoints not directly related to cluster activity, such as /healthz or /version, create noise.
In addition to capturing the right audit logs, knowing how to interpret log entries is necessary for pinpointing flaws in your environment’s security settings. Let’s break down a sample audit log—which creates a new pod—to show you what information is most useful for Kubernetes security monitoring.
{
"kind":"Event",
"apiVersion":"audit.k8s.io/v1",
"metadata":{ "creationTimestamp":"2020-10-21T21:47:07Z" },
"level":"RequestResponse",
"timestamp":"2020-10-21T21:47:07Z",
"auditID":"20ac14d3-1214-42b8-af3c-31454f6d7dfb",
"stage":"ResponseStarted",
"requestURI":"/api/v1/namespaces/default/pods",
"verb":"create",
"user": {
"username":"maddie.shepherd@demo.org",
"groups":[ "system:authenticated" ]
},
"sourceIPs":[ "172.20.66.233" ],
"objectRef": {
"resource":"pods",
"namespace":"default",
"apiVersion":"v1"
},
"requestReceivedTimestamp":"2020-10-21T21:47:07.603214Z",
"stageTimestamp":"2020-10-21T21:47:07.603214Z",
"annotations": {
"authorization.k8s.io/decision": "allow",
"authorization.k8s.io/reason": "RBAC: allowed by RoleBinding 'demo/test-account' of Role 'cluster-admin' to ServiceAccount 'demo/test-account'"
}
}
The requestURI and verb attributes show the request path (i.e., which API endpoint the request targets) and action (e.g., list, create, watch) that are used to make the request. The API server maps the action to a corresponding HTTP method. In the example entry above, you can see that a user made a POST request to create a new pod in the “default” namespace.
The request path can also capture commands that users run inside a container via the kubectl exec command, giving you more context for how a user or service interacts with your application. For example, you can detect when a user account is passing an ls command to a pod to list and explore its directories.
The user, sourceIPs, and authorization.k8s.io/reason attributes provide more details about who made the request, their permission groups within your organization, and the specific RBAC permissions that allowed the request (e.g., RBAC Role, ClusterRoles). This data can help you audit a user’s level of access or determine if an account was compromised if it is making requests from an unknown IP address. It can also help you identify misconfigurations that could leave your application vulnerable to attacks.
Next, we’ll highlight some of the key types of Kubernetes audit logs you should monitor to make sure that you have the right security policies in place and can quickly identify security gaps in your containerized environment.
There are several techniques an attacker can use to access and modify Kubernetes resources, accounts, and services. Many of these techniques focus on exposing simple misconfigurations in your Kubernetes environment or RBAC policies. We’ll look at some important audit logs you can monitor to easily surface suspicious activity in your cluster and detect a few of the techniques used in the following areas:
access to your Kubernetes environment
changes to Kubernetes resources
user and service account activity
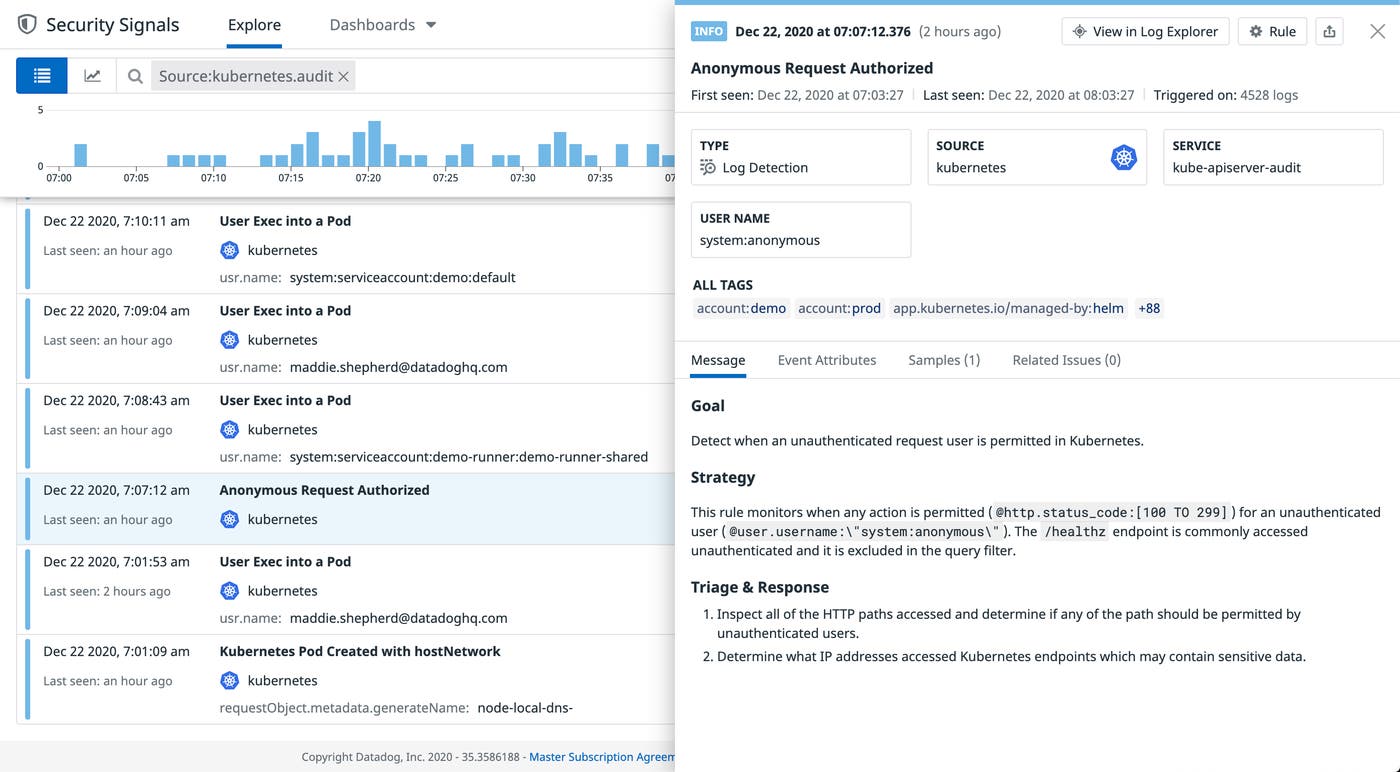
The Kubernetes API server manages all requests from users and other Kubernetes resources in your environment and is one of the first components an attacker may try to access. With access to the API server, an attacker will attempt to find and control other resources in your environment, such as service accounts and pods. Monitoring your audit logs for the following activity can help you identify vulnerabilities as well as detect an attack before it escalates to other parts of your Kubernetes environment.
Anonymous requests allowed
Kubernetes’s default settings allow anonymous requests to the API server. Additionally, by default each node’s kubelet also allows anonymous requests. CIS Benchmarks recommends disabling these settings because, for example, they potentially give attackers full access to the kubelet API to run commands in a pod, escalate privileges, and more.
If your API server and kubelets allow anonymous access, the username and groups attributes in your audit logs will show system:anonymous and system:unauthenticated, respectively.
"user": {
"username":"system:anonymous",
"groups":["system:unauthenticated"]
},
"sourceIPs":[ "172.20.66.233" ],
If you see these types of calls, you should troubleshoot further and determine if you need to disable this setting for your environment. To mitigate this, you can disable anonymous access and review your role-based access control (RBAC) policies to ensure they are configured correctly.
It’s important to note that managed Kubernetes services (e.g., Google Kubernetes Engine, Amazon Elastic Kubernetes Service) generally disable anonymous access, but it is still an important configuration to check. A sudden increase in anonymous requests—even denied anonymous requests—could mean that an attacker is probing the kubelet and API server to discover what kinds of service data they can retrieve.
Arbitrary execution in pod
Attempt to get secrets from a cluster, namespace, or a pod in a namespace
Once attackers know they have access to the kubelet and API server, they will often start running arbitrary commands in a pod—such as launching an interactive shell in a pod—or listing secrets via kubectl to see if they can broaden their access. If you see an unauthorized IP address (e.g., in the sourceIPs, username, and group audit log attributes) running commands in a pod such as listing a pod’s directories (e.g., in the requestURI and verb attributes), it could be an indicator that an attacker already has access to your environment and is finding ways to create, modify, or control Kubernetes resources, which we’ll look at in the next section.
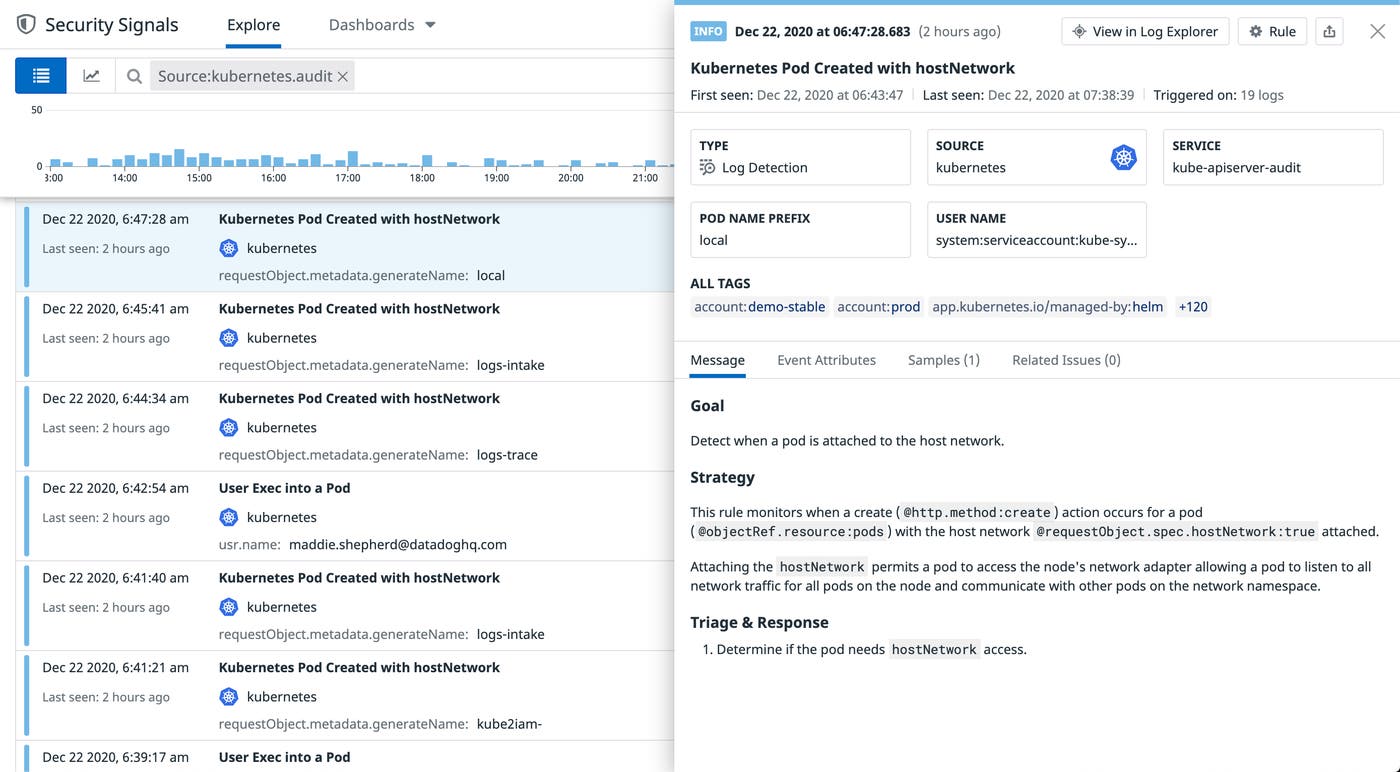
Changes to your environment are not always indicative of malicious activity, but they are still important to monitor, especially if that activity is coming from an unusual IP address or service account. The following activity is common when attackers are trying to gain more control over your clusters.
Pod created in a preconfigured namespace
Pod created with a sensitive mount
Pod attached to the host network
Attackers will often look for a service account (or create a new account) that has the ability to attach pods to the host network or create new pods in a preconfigured namespace, such as kube-system or kube-public. This allows them to communicate with other pods in the namespace, create pods with privileged containers, mount hostPath volumes on a node for unrestricted access to the host’s file system, or deploy a DaemonSet to easily control every node in a cluster.
If you notice the same service account or IP address creating new pods or host mounts on a node, you may need to scale back that account’s permissions or update your admission controllers—such as a Pod Security Policy—to limit what pod features can be used. Privileged containers are particularly valuable to attackers because they provide unfettered access to other malicious activity, such as privilege escalation.
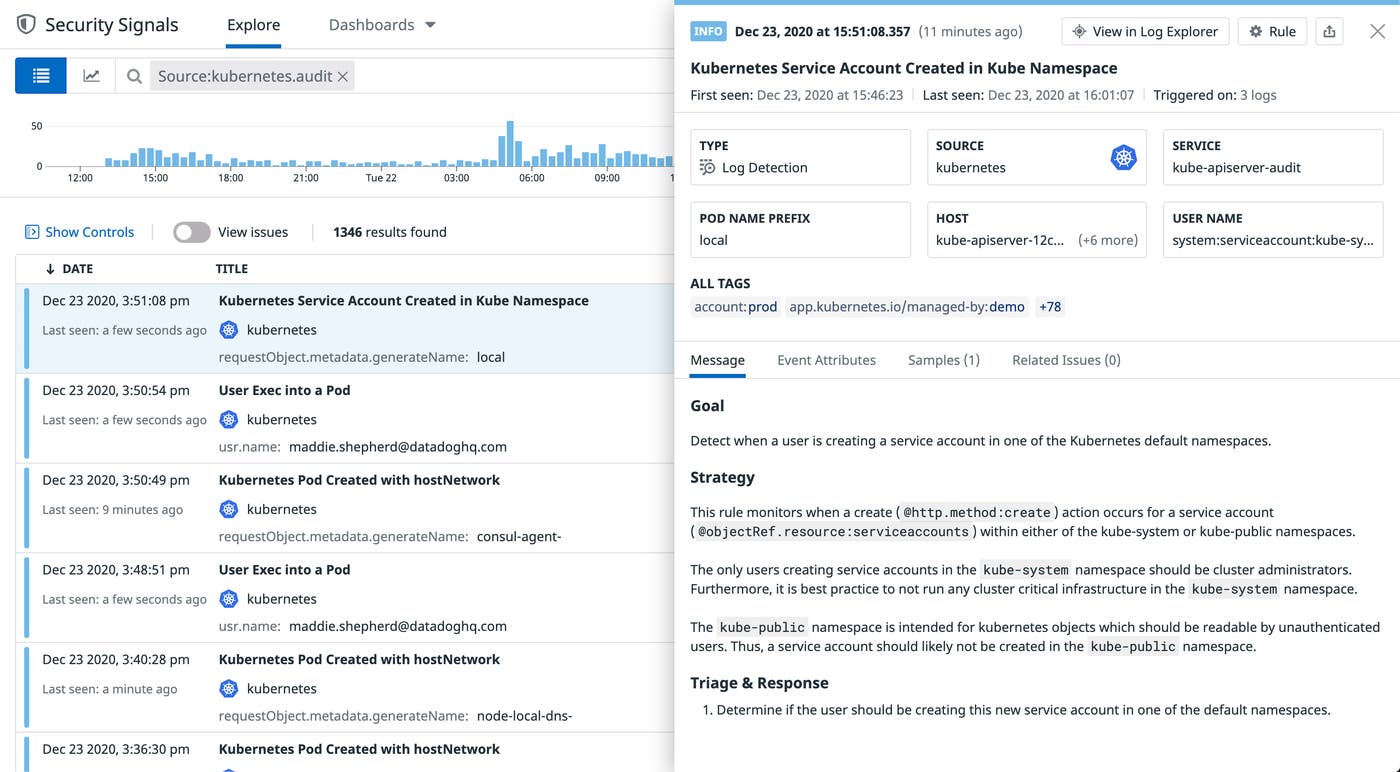
Privilege escalation is another technique attackers use to gain control over Kubernetes resources. Tactics often include attempts to create new accounts (or modify existing ones) with elevated privileges for full access to a resource. Monitoring the following activity can help you identify efforts to modify an account’s permissions or create new accounts with admin privileges.
A cluster-admin role attached to an account
The cluster-admin role in RBAC policies gives accounts super-user access to any resource. As a general rule, accounts should only have the permissions they need to perform their specific tasks, so most accounts do not need this level of access. You should follow up to ensure the role is needed for the account in question if you see audit logs for any service account that indicate it’s using the cluster-admin role.
You should also monitor for attempts to create a ClusterRoleBinding that attaches an account to the cluster-admin role. An account with this role binding has full control over every resource in the cluster and in all namespaces. If you see this activity in your audit logs, you should investigate further to ensure that the account isn’t compromised. You can find all of this information in your audit logs’ authorization.k8s.io/reason attribute.
Service account created in a preconfigured namespace
Logs for new service accounts do not always indicate a security threat, but you should investigate newly created accounts to ensure they are legitimate, especially if they have a role that allows write privileges or super-user access. As with your other audit logs, you can find more information about the service account in the requestURI attribute, and look at the user and sourceIPs attributes to determine if the activity is coming from a known source.
Datadog offers a built-in Kubernetes audit log integration, so you can easily track environment activity in real time. To start collecting your audit logs, you will need to deploy the Datadog Agent to your Kubernetes environment, then enable log collection.
Once you’re collecting Kubernetes audit logs with Datadog, you can create facets from attributes in your ingested logs and use them to build visualizations to explore and focus on the most important log data—check out some real life examples in Datadog’s KubeCon North America 2019 talk, Making the Most Out of Kubernetes Audit Logs. And Datadog’s out-of-the-box threat detection rules automatically monitor your audit logs and identify critical security and compliance issues in your environments.
Datadog’s detection rules cover common techniques attackers use to access Kubernetes environments, many of which can be identified in the audit logs we looked at earlier. Datadog also provides rules mapped to compliance frameworks, such as CIS, to detect changes in your Kubernetes environment that may leave your applications vulnerable.
When audit logs trigger a rule, Datadog creates a Security Signal that you can review in the Security Signals explorer, where it’s retained for 15 months. Each rule includes a description of the identified vulnerability and remediation steps, so you can quickly address any issues before they become more serious.
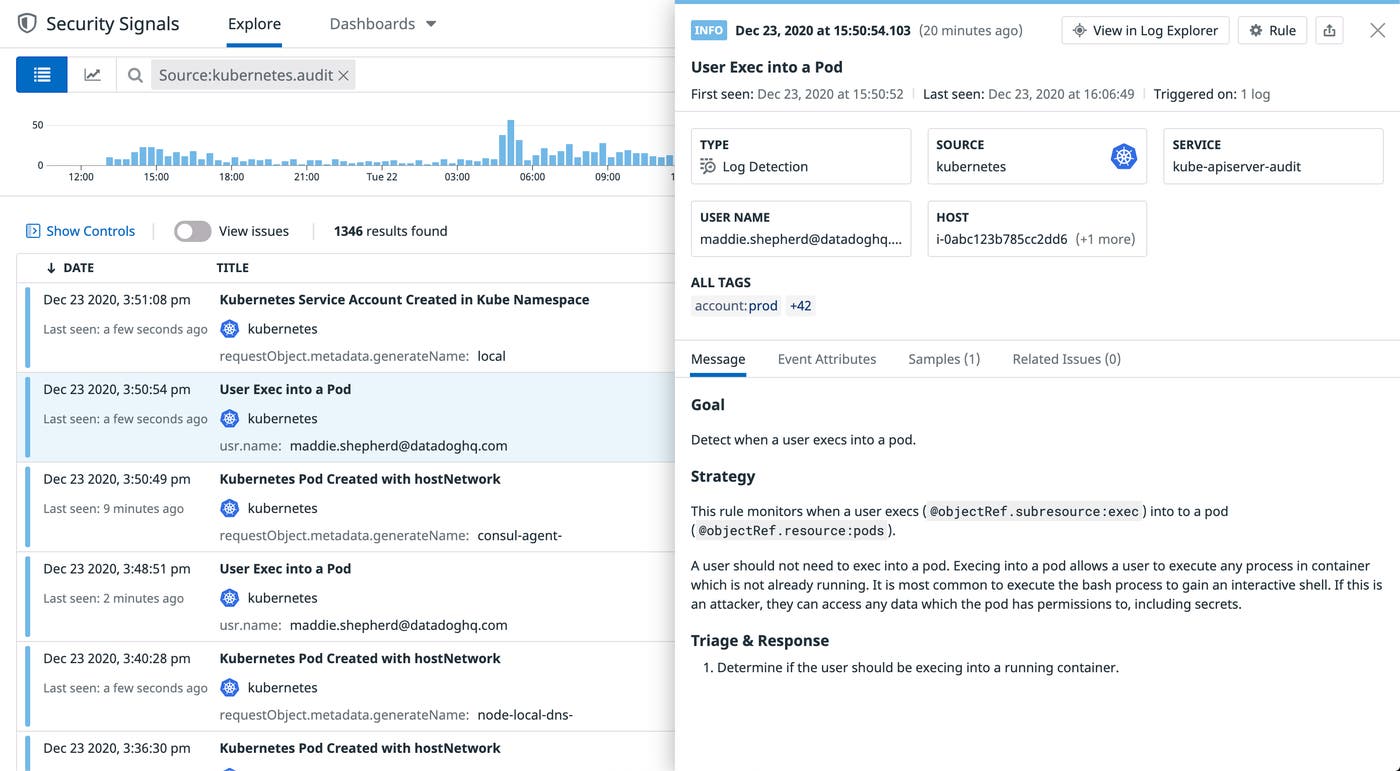
In the screenshot above, Datadog detected a user’s attempt to launch an interactive shell in a running pod via the kubectl exec command. Most users should not need to run commands in a pod, so you should investigate further to ensure that the user’s account isn’t compromised.
Datadog also gives you full visibility into all of your Kubernetes resources, so you can easily investigate a resource that triggered a Security Signal. For example, you can review the configurations of a new pod to determine if it has privileged access to your cluster (e.g., a service account with the cluster-admin role or hostPath volume mounts).
In this post, we looked at some key Kubernetes audit logs and how they can help you detect unusual activity in your clusters. We also walked through how Datadog can provide better visibility into Kubernetes environment security. Check out our documentation to learn more about Datadog’s Kubernetes audit log integration, or sign up for a free trial to start monitoring your Kubernetes applications today.
此内容由惯性聚合(RSS阅读器)自动聚合整理,仅供阅读参考。 原文来自 — 版权归原作者所有。