












Performance issues with Amazon Web Services’ Elastic Block Storage (EBS) are complex to understand because EBS is an instance of networked storage. Unlike attached storage, your EBS volumes are sharing some infrastructure with other customers’. So when one of your EBS volumes gets slow, it’s hard to understand why. Actual behavior can sometimes run counter to your intuition.
Here is an example of latency observed on a standard EBS volume compared to the number of IOPS, a measure of i/o throughput. Each graph represents about 13 hours’ worth of measurements.
The first graph depicts the time it takes in milliseconds for requests to be serviced by the EBS volume, as measured by the operating system of the instance. This is a measure of latency.
The second graph depicts the Volume Queue Length of that same EBS volume, presumably as measured by the hypervisor of the instance. This is a measure of latency.
The third graph depicts the number of IOPS performed on that same EBS volume, again measured by the operating system of the instance. This is a measure of throughput.

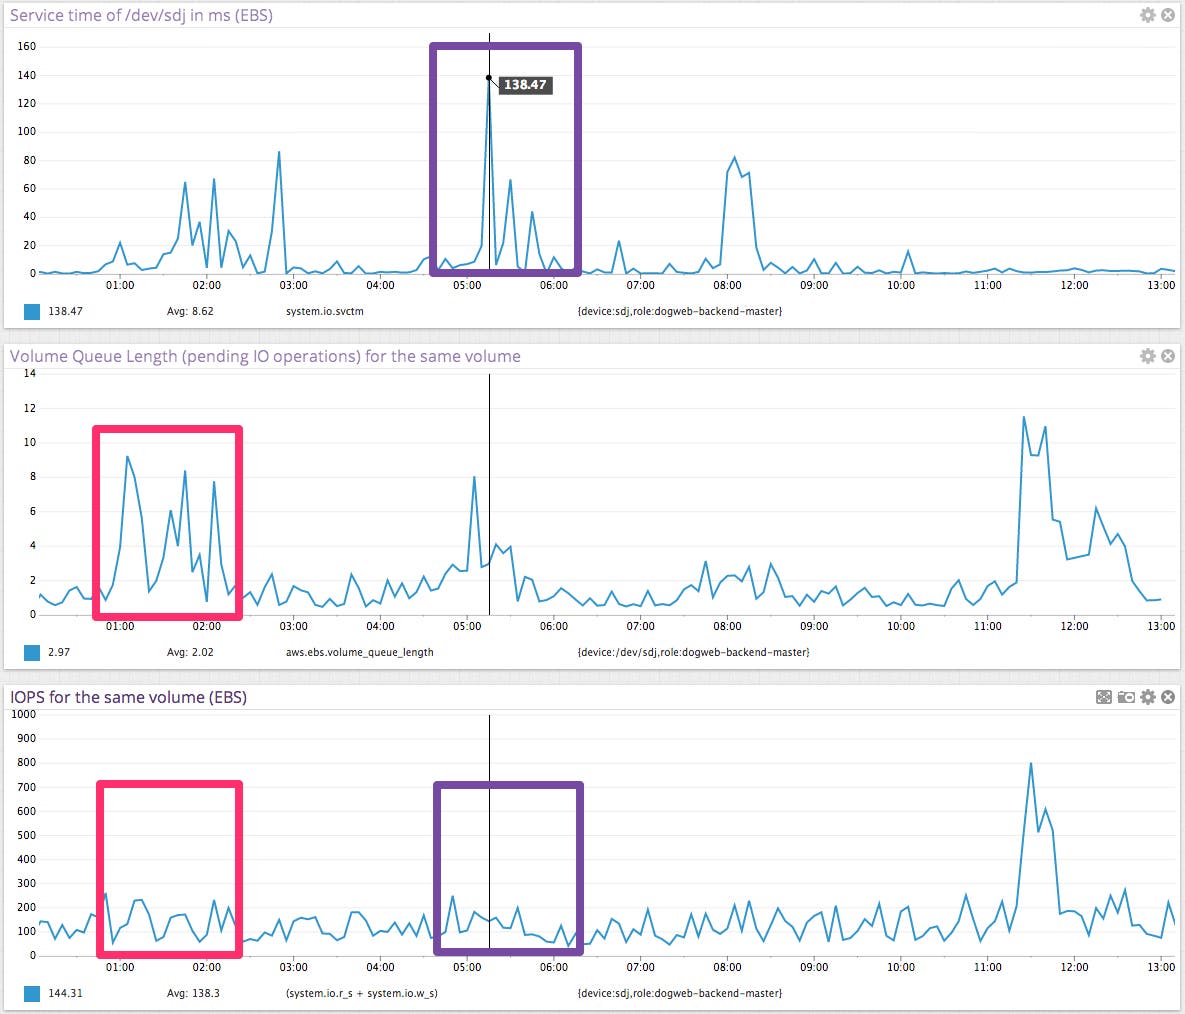
Notice the relative lack of correlation between IOPS (3rd graph) and the observed service time in ms for the same EBS device (1st graph), highlighted in purple. You would expect to have consistent EBS latency for the same throughput.
Notice also the weak correlation between pending EBS requests (2nd graph) and IOPS (3rd graph), highlighted in red. The interesting pattern happens on the left of the graph, where IOPS stay roughly around 150, while the Volume Queue Length varies widely.
The only strong correlation occurs once the EBS volume is completely saturated. Trying to send 700 IOPS to the standard EBS volume overwhelms it and causes the Volume Queue Length to rise sharply on the right side of the graph.
If IOPS were a great predictor of EBS performance you would expect to have a strong correlation between IOPS and Volume Queue Length, independent of other factors. The 2nd and 3rd graph show this is clearly not the case.
Even if your EC2 instances were using dedicated volumes (known as “provisioned IOPS volumes”? in AWS parlance), the physical disks behind EBS may still be shared with other AWS customers. Their workloads may consume a great share of disk bandwidth when you need it most.
Ultimately, due to AWS’ opacity, there is simply no way to know how much throughput (from the physical disks and from the network that sits in-between) to expect for a given EBS volume. Provisioned IOPS only offer a partial solution to this issue, at a higher hourly cost.
For more information on this and other AWS EBS Performance issues, check out our free eBook: The Top 5 Ways to Improve Your AWS EC2 Performance
此内容由惯性聚合(RSS阅读器)自动聚合整理,仅供阅读参考。 原文来自 — 版权归原作者所有。