








Alex Cuoci

Maxim Brown
Technical Content Writer
AWS Graviton2 processors use the Arm architecture to provide high-efficiency, low-cost computing. AWS already offers the ability to provision EC2 instances powered by Graviton2, and Datadog is proud to partner with them for the launch of new Graviton2 compute resources for Lambda functions. In this post, we’ll discuss how Datadog can provide deep visibility into your Lambda functions across whichever platform you’re using. This enables you to monitor function performance alongside telemetry data from the rest of your stack—and determine whether Graviton2 is a good fit for your serverless workloads.
Datadog’s Lambda extension fully supports Arm-based architectures. This means that, once you’ve instrumented your functions with the appropriate library, Datadog can collect telemetry from your Lambda functions running on Graviton2.
Datadog automatically tags your functions with key metadata, including architecture, which enables you to visualize and compare their performance across different platforms. For example, you can deploy a new version of an existing function using Graviton2, and then easily analyze its performance alongside that of its x86-based counterpart. This can help you assess whether it makes sense to continue migrating functions to the new platform.
AWS reports that Graviton2-powered functions can experience up to 34 percent reduced duration, and the cold start time for functions we ran during our testing executed approximately nine percent faster when using Graviton2. This is because our Graviton2 functions compiled into packages that are smaller by about seven to nine percent, which can improve cold start performance, as Lambda has to pull less data to initialize a function.
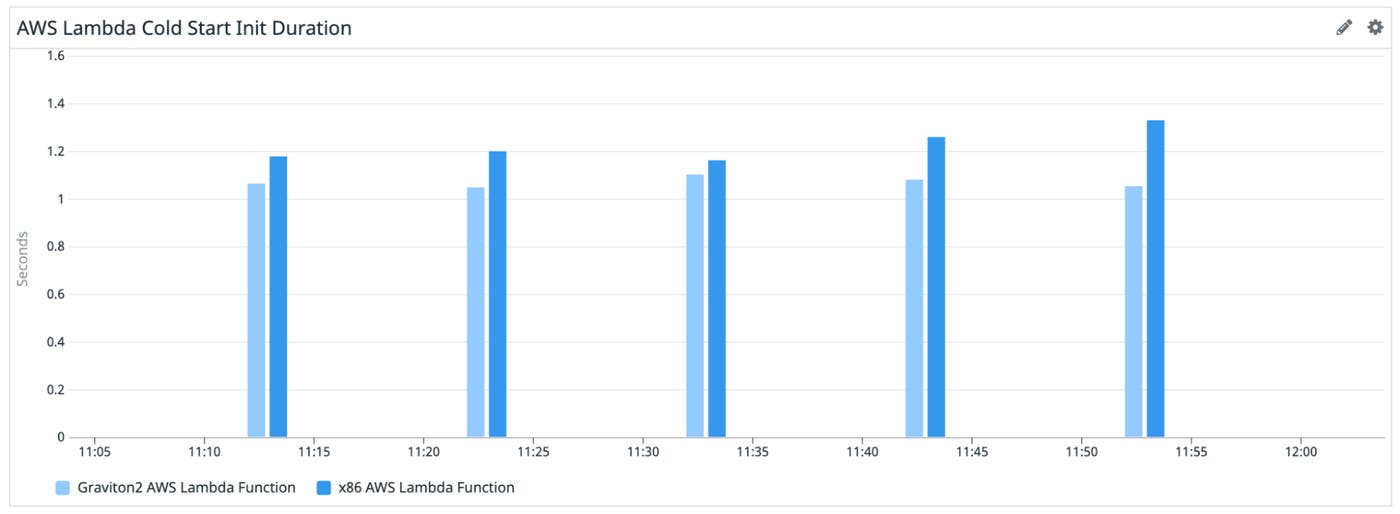
Faster cold starts can reduce both customer-facing latency and costs. Graviton2 could therefore be an ideal choice for functions that are susceptible to frequent or long cold starts, such as those that are invoked often or have many dependencies. Alternatively, Graviton2 might not be well suited for certain workloads, such as video encoding, which benefit from x86 architecture.
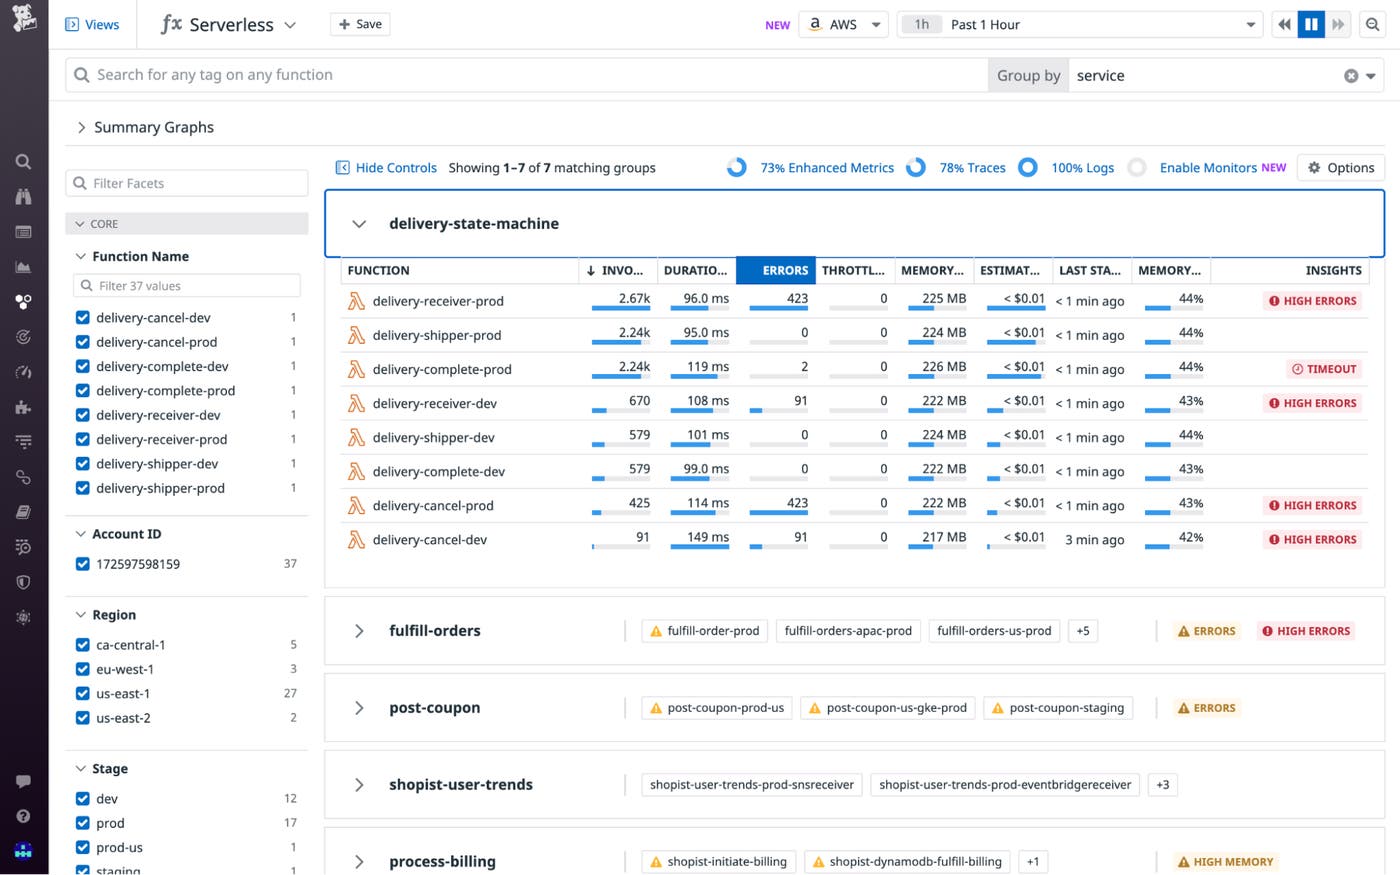
Once you instrument your Lambda functions, Datadog will begin ingesting their metrics, logs, and traces, which you can monitor and correlate with data from the rest of your stack. For instance, you can use the Serverless view to track function performance alongside metrics from your other serverless resources, such as API Gateway. This makes it easy to surface problems with your functions like long durations or high error rates, which might be related to issues with the services that invoke them.
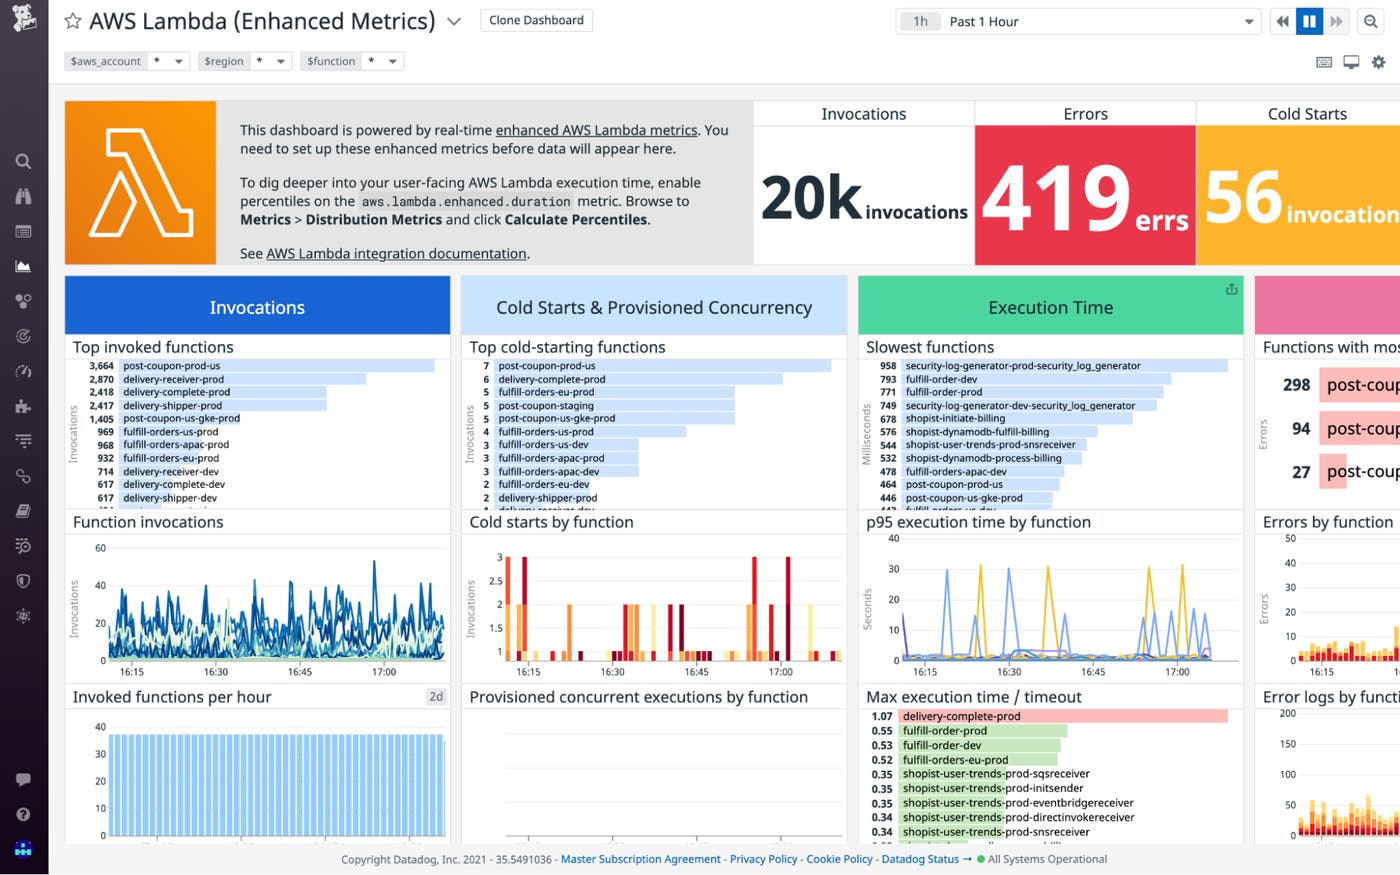
Datadog will also generate real-time enhanced Lambda metrics, including the number of cold starts, function memory usage, and estimated cost. You can monitor these metrics using a customizable, out-of-the-box dashboard, giving you even more granular insights into function performance.
You can use Datadog to monitor all of your AWS Lambda functions, whether they are running on x86 or Arm architecture. This makes it easy to visualize performance and determine whether you should continue to migrate your serverless applications to this new platform. See our documentation for more details on getting started. Or, sign up for a free 14-day trial.
此内容由惯性聚合(RSS阅读器)自动聚合整理,仅供阅读参考。 原文来自 — 版权归原作者所有。