




This post is the final part of a 4-part series on monitoring Elasticsearch performance. Part 1 provides an overview of Elasticsearch and its key performance metrics, Part 2 explains how to collect these metrics, and Part 3 describes how to monitor Elasticsearch with Datadog.
Like a car, Elasticsearch was designed to allow its users to get up and running quickly, without having to understand all of its inner workings. However, it’s only a matter of time before you run into engine trouble here or there. This article will walk through five common Elasticsearch challenges, and how to deal with them.
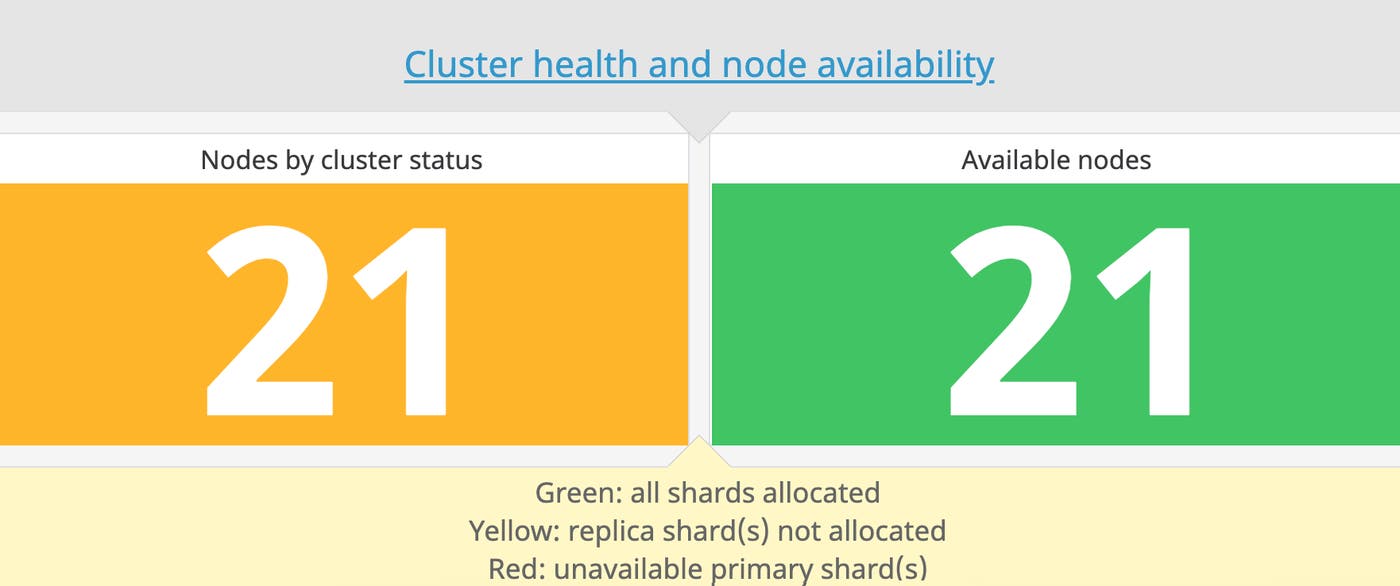
If you recall from Part 1, cluster status is reported as red if one or more primary shards (and its replicas) is missing, and yellow if one or more replica shards is missing. Normally, this happens when a node drops off the cluster for whatever reason (hardware failure, long garbage collection time, etc.). Once the node recovers, its shards will remain in an initializing state before they transition back to active status.
The number of initializing shards typically peaks when a node rejoins the cluster, and then drops back down as the shards transition into an active state, as shown in the graph below.
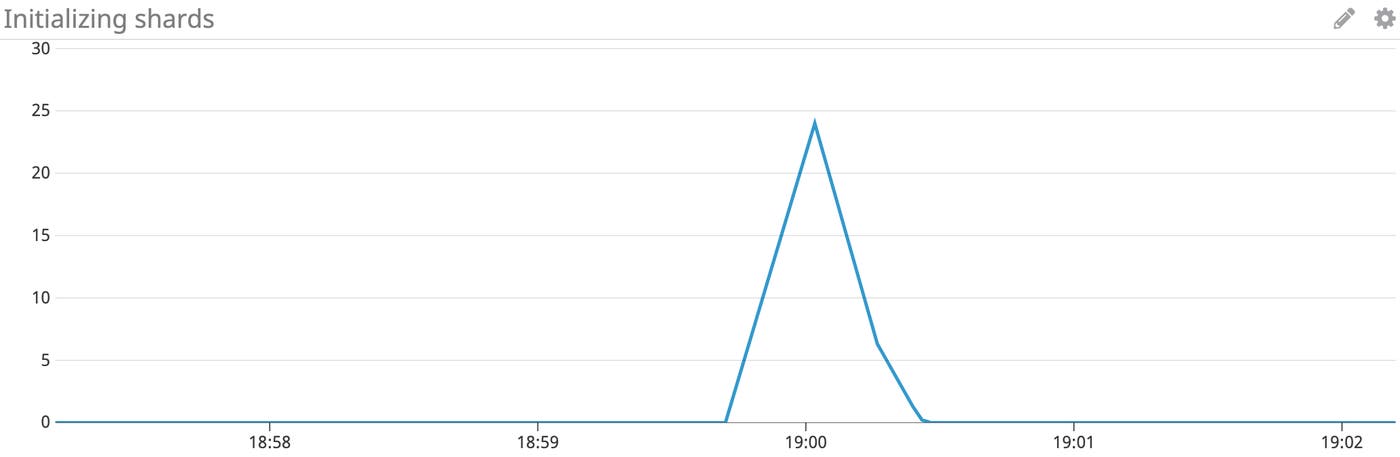
During this initialization period, your cluster state may transition from green to yellow or red until the shards on the recovering node regain active status. In many cases, a brief status change to yellow or red may not require any action on your part.

However, if you notice that your cluster status is lingering in red or yellow state for an extended period of time, verify that the cluster is recognizing the correct number of Elasticsearch nodes, either by consulting Datadog’s dashboard or by querying the Cluster Health API detailed in Part 2.
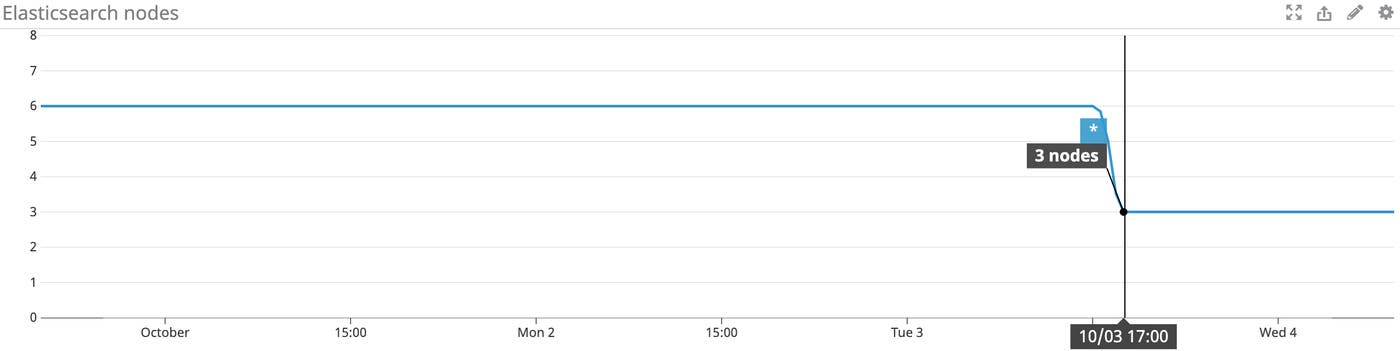
If the number of active nodes is lower than expected, it means that at least one of your nodes lost its connection and hasn’t been able to rejoin the cluster. To find out which node(s) left the cluster, check the logs (located by default in the logs folder of your Elasticsearch home directory) for a line similar to the following:
[TIMESTAMP] ... Cluster health status changed from [GREEN] to [RED]
Reasons for node failure can vary, ranging from hardware or hypervisor failures, to out-of-memory errors. Check any of the monitoring tools outlined here for unusual changes in performance metrics that may have occurred around the same time the node failed, such as a sudden spike in the current rate of search or indexing requests. Once you have an idea of what may have happened, if it is a temporary failure, you can try to get the disconnected node(s) to recover and rejoin the cluster. If it is a permanent failure, and you are not able to recover the node, you can add new nodes and let Elasticsearch take care of recovering from any available replica shards; replica shards can be promoted to primary shards and redistributed on the new nodes you just added.
However, if you lost both the primary and replica copy of a shard, you can try to recover as much of the missing data as possible by using Elasticsearch’s snapshot and restore module. If you’re not already familiar with this module, it can be used to store snapshots of indices over time in a remote repository for backup purposes.
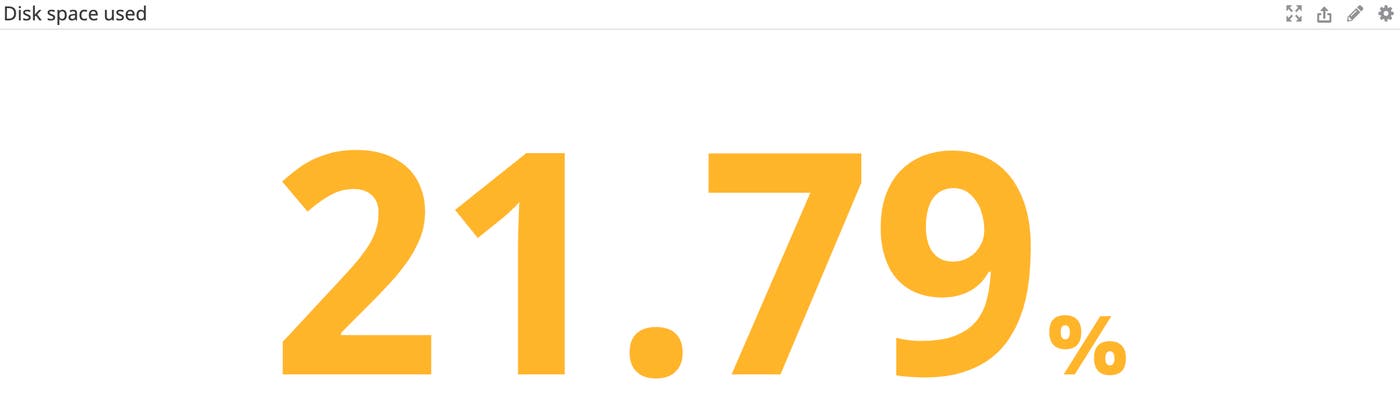
If all of your data nodes are running low on disk space, you will need to add more data nodes to your cluster. You will also need to make sure that your indices have enough primary shards to be able to balance their data across all those nodes.
However, if only certain nodes are running out of disk space, this is usually a sign that you initialized an index with too few shards. If an index is composed of a few very large shards, it’s hard for Elasticsearch to distribute these shards across nodes in a balanced manner.
Elasticsearch takes available disk space into account when allocating shards to nodes. By default, it will not assign shards to nodes that have over 85 percent disk in use. In Datadog, you can set up a threshold alert to notify you when any individual data node’s disk space usage approaches 80 percent, which should give you enough time to take action.
There are two remedies for low disk space. One is to remove outdated data and store it off the cluster. This may not be a viable option for all users, but, if you’re storing time-based data, you can store a snapshot of older indices’ data off-cluster for backup, and update the index settings to turn off replication for those indices.
The second approach is the only option for you if you need to continue storing all of your data on the cluster: scaling vertically or horizontally. If you choose to scale vertically, that means upgrading your hardware. However, to avoid having to upgrade again down the line, you should take advantage of the fact that Elasticsearch was designed to scale horizontally. To better accommodate future growth, you may be better off reindexing the data and specifying more primary shards in the newly created index (making sure that you have enough nodes to evenly distribute the shards).
Another way to scale horizontally is to roll over the index by creating a new index, and using an alias to join the two indices together under one namespace. Though there is technically no limit to how much data you can store on a single shard, Elasticsearch recommends a soft upper limit of 50 GB per shard, which you can use as a general guideline that signals when it’s time to start a new index.
Search performance varies widely according to what type of data is being searched and how each query is structured. If you’re using an application performance monitoring service like Datadog, you can inspect individual request traces to see which types of Elasticsearch queries are creating bottlenecks, and navigate to related logs and metrics to get more context.
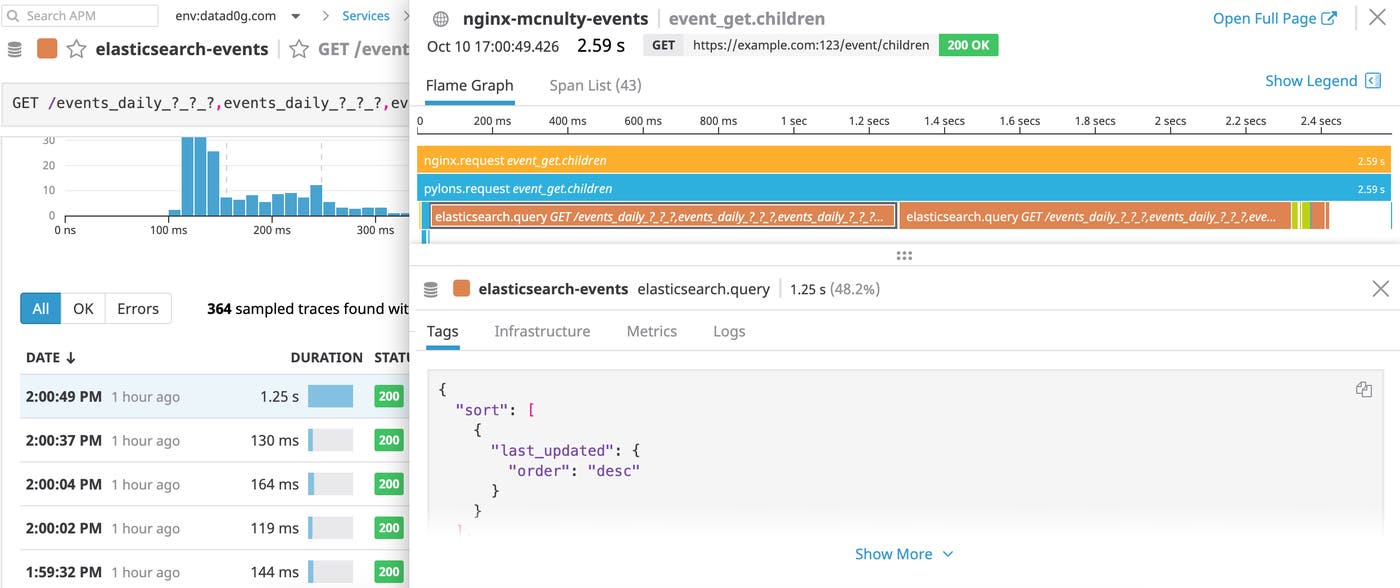
Depending on the way your data is organized, you may need to experiment with a few different methods before finding one that will help speed up search performance. We’ll cover two of them here: custom routing and force merging.
Typically, when a node receives a search request, it needs to communicate that request to a copy (either primary or replica) of every shard in the index. Custom routing allows you to store related data on the same shard, so that you only have to search a single shard to satisfy a query.
For example, you can store all of blogger1’s data on the same shard by specifying a _routing value in the mapping for the blogger type within your index, blog_index.
First, make sure _routing is required so that you don’t forget to specify a custom routing value whenever you index information of the blogger type.
curl -XPUT "localhost:9200/blog_index" -d '
{
"mappings": {
"blogger": {
"_routing": {
"required": true
}
}
}
}'
When you’re ready to index a document pertaining to blogger1, specify the routing value:
curl -XPUT "localhost:9200/blog_index/blogger/1?routing=blogger1" -d '
{
"comment": "blogger1 made this cool comment"
}'
Now, in order to search through blogger1’s comments, you will need to remember to specify the routing value in the query like this:
curl -XGET "localhost:9200/blog_index/_search?routing=blogger1" -d '
{
"query": {
"match": {
"comment": {
"query": "cool comment"
}
}
}
}'
In Elasticsearch, every search request has to check every segment of each shard it hits. So once you have reduced the number of shards you’ll have to search, you can also reduce the number of segments per shard by triggering the Force Merge API on one or more of your indices. The Force Merge API (or Optimize API in versions prior to 2.1.0) prompts the segments in the index to continue merging until each shard’s segment count is reduced to max_num_segments (1, by default). It’s worth experimenting with this feature, as long as you account for the computational cost of triggering a high number of merges.
When it comes to shards with a large number of segments, the force merge process becomes much more computationally expensive. For instance, force merging an index of 10,000 segments down to 5,000 segments doesn’t take much time, but merging 10,000 segments all the way down to one segment can take hours. The more merging that must occur, the more resources you take away from fulfilling search requests, which may defeat the purpose of calling a force merge in the first place. In any case, it’s usually a good idea to schedule a force merge during non-peak hours, such as overnight, when you don’t expect many search or indexing requests.
Elasticsearch comes pre-configured with many settings that try to ensure that you retain enough resources for searching and indexing data. However, if your usage of Elasticsearch is heavily skewed towards writes, you may find that it makes sense to tweak certain settings to boost indexing performance, even if it means losing some search performance or data replication. Below, we will explore a number of methods to optimize your use case for indexing, rather than searching, data.
Shard allocation: As a high-level strategy, if you are creating an index that you plan to update frequently, make sure you designate enough primary shards so that you can spread the indexing load evenly across all of your nodes. The general recommendation is to allocate one primary shard per node in your cluster, and possibly two or more primary shards per node, but only if you have a lot of CPU and disk bandwidth on those nodes. However, keep in mind that shard overallocation adds overhead and may negatively impact search, since search requests need to hit every shard in the index. On the other hand, if you assign fewer primary shards than the number of nodes, you may create hotspots, as the nodes that contain those shards will need to handle more indexing requests than nodes that don’t contain any of the index’s shards.
Disable merge throttling: Merge throttling is Elasticsearch’s automatic tendency to throttle indexing requests when it detects that merging is falling behind indexing. It makes sense to update your cluster settings to disable merge throttling (by setting indices.store.throttle.type to “none”) if you want to optimize indexing performance, not search. You can make this change persistent (meaning it will persist after a cluster restart) or transient (resets back to default upon restart), based on your use case.
Increase the size of the indexing buffer: This setting (indices.memory.index_buffer_size) determines how full the buffer can get before its documents are written to a segment on disk. The default setting limits this value to 10 percent of the total heap in order to reserve more of the heap for serving search requests, which doesn’t help you if you’re using Elasticsearch primarily for indexing.
Index first, replicate later: When you initialize an index, specify zero replica shards in the index settings, and add replicas after you’re done indexing. This will boost indexing performance, but it can be a bit risky if the node holding the only copy of the data crashes before you have a chance to replicate it.
Refresh less frequently: Increase the refresh interval in the Index Settings API. By default, the index refresh process occurs every second, but during heavy indexing periods, reducing the refresh frequency can help alleviate some of the workload.
Tweak your translog settings: As of version 2.0, Elasticsearch will flush translog data to disk after every request, reducing the risk of data loss in the event of hardware failure. If you want to prioritize indexing performance over potential data loss, you can change index.translog.durability to async in the index settings. With this in place, the index will only commit writes to disk upon every sync_interval, rather than after each request, leaving more of its resources free to serve indexing requests.
For more suggestions on boosting indexing performance, check out this guide from Elastic.
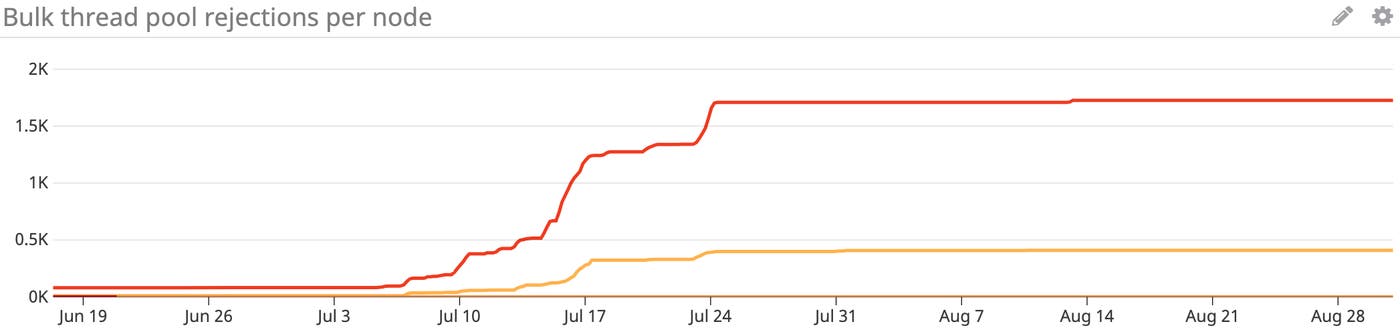
Thread pool rejections are typically a sign that you are sending too many requests to your nodes, too quickly. If this is a temporary situation (for instance, you have to index an unusually large amount of data this week, and you anticipate that it will return to normal soon), you can try to slow down the rate of your requests. However, if you want your cluster to be able to sustain the current rate of requests, you will probably need to scale out your cluster by adding more data nodes. In order to utilize the processing power of the increased number of nodes, you should also make sure that your indices contain enough shards to be able to spread the load evenly across all of your nodes.
Even more performance tips are available in Elasticsearch’s learning resources and documentation. Since results will vary depending on your particular use case and setup, you can test out different settings and indexing/querying strategies to determine which approaches work best for your clusters.
As you experiment with these and other optimizations, make sure to watch your Elasticsearch dashboards closely to monitor the resulting impact on your clusters’ key Elasticsearch performance metrics.
With an out-of-the-box Elasticsearch dashboard that highlights key cluster metrics, Datadog enables you to effectively monitor Elasticsearch in real time. Datadog APM’s open source clients for Java, Python, and other languages include built-in support for auto-instrumenting popular frameworks and data stores, so you can monitor Elasticsearch query performance in full context with the rest of your services. If you already have a Datadog account, you can set up the Elasticsearch integration in minutes. If you don’t yet have a Datadog account, sign up for a free trial today.
此内容由惯性聚合(RSS阅读器)自动聚合整理,仅供阅读参考。 原文来自 — 版权归原作者所有。