





DNS is a critical component of your infrastructure, enabling your services to reach the endpoints they rely on and connecting your users to your web applications from anywhere in the world. In order to keep your DNS healthy and performant, you need complete visibility into both internal and external DNS resolution.
Datadog is excited to announce new DNS monitoring features that help you troubleshoot DNS end-to-end, so you can ensure your applications’ performance and availability. Cloud Network Monitoring’s DNS view provides insight into the health of your internal DNS servers and service discovery, and Synthetic DNS tests help you proactively detect DNS failures and misconfigurations.
In this post, we’ll show you how you can:
The new DNS view—part of Datadog Cloud Network Monitoring—surfaces monitoring data from all of your DNS servers and managed services in one place, so you can analyze network-wide DNS performance without having to SSH into individual machines. The DNS view graphs key DNS-specific health metrics, such as volume, response time, and failure rate of your DNS requests. These visualizations can help you spot DNS performance problems like an individual server receiving a higher-than-normal rate of requests or responding with increasing latency. Below the graphs, a list presents the details of each DNS request flow—a discrete path between a DNS client in your environment and an internal or external DNS server.
You can use facets such as pod_name and container_id to isolate a subset of flows. Click on any flow listed in the DNS view to see additional data—including the flow’s source and destination IP addresses and ports, as well as PIDs. You can also view distributed trace data from the client that sent the request in order to check for code-level application errors, as well as infrastructure metrics at the process level, which can point to particular software consuming the client’s CPU and memory.
If your application slows down as it makes more DNS requests, the cause may be much harder to identify than the correlation itself. You can filter your DNS view to show metrics from a subset of clients—or even a single client—to see which of your services or pods are generating a high rate of requests or volume of errors, which could be the cause of the latency.
If you look at where those requests are going—for example, to an internal DNS service or out to the internet to resolve a request to an external API—you might spot a problem with an upstream dependency that’s sending invalid DNS requests.
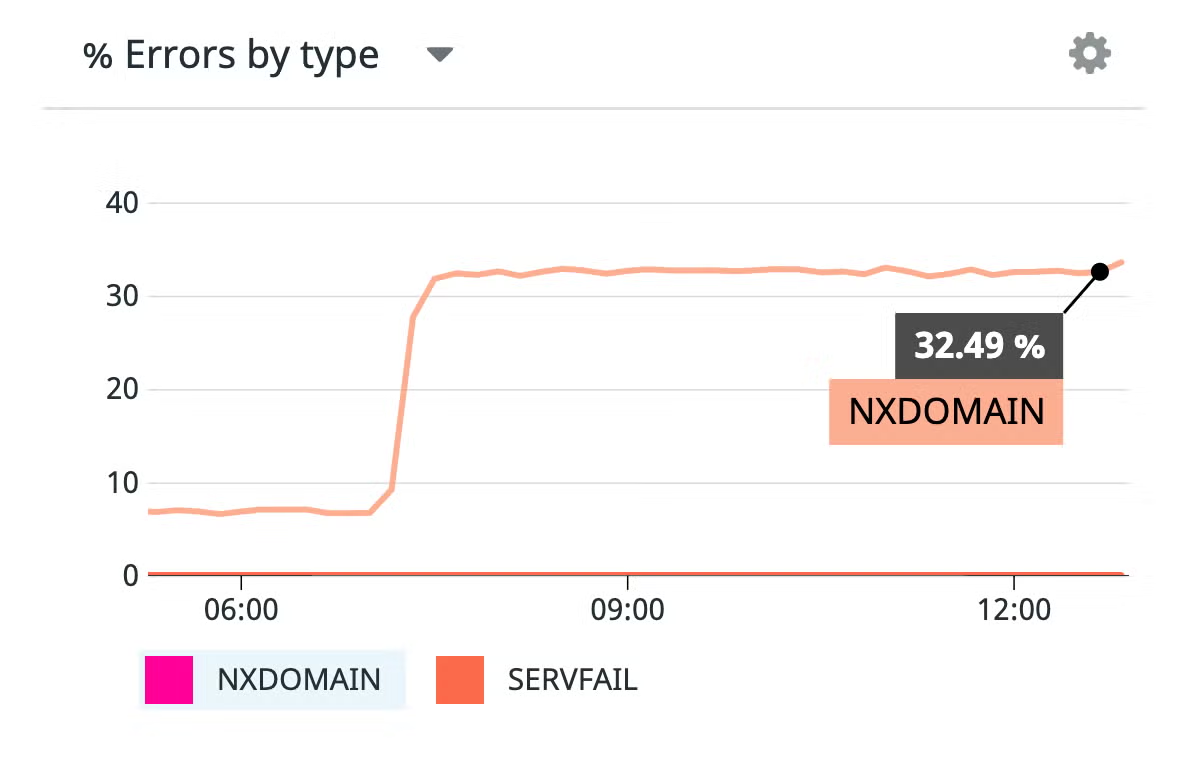
You can also graph DNS errors by type—NXDOMAIN or SERVFAIL—to help determine the cause of failed requests. The screenshot below shows a sharp rise in NXDOMAIN errors, which could indicate a misconfigured client sending requests to a nonexistent domain.
The DNS view also displays three graphs that allow you to quickly correlate your client’s activity with the behavior of your servers. Once you filter by source—to isolate a particular host, service, or pod—you can easily see how the rate of requests from that source corresponds to your DNS servers’ performance. The graphs in the screenshot below show a spike in the response time for requests from a single source IP address, but no corresponding spike in the number of requests from that address. This indicates that a misconfigured DNS server or poor network connectivity—which you can investigate using CNM—may be responsible for the latency.
The performance of each of your DNS servers can be affected by issues with your load balancer, your network, or your DNS cache. The DNS view enables you to isolate metrics from a single server in order to track its performance over time, which can help you diagnose problems and identify their potential sources.
If you use load balancers to distribute DNS requests across your DNS servers, you can validate their health by comparing the number of DNS requests to each server in a load-balanced group. If one server is handling more requests than the others, this could indicate load balancer failure or misconfiguration. You should resolve any problems with your load balancer before you take the more costly step of scaling up your existing DNS servers or adding more servers to the group.
If you identify a DNS server with increased response latency, you can compare its performance to that of similar servers by filtering the DNS view—for example, to isolate all the DNS servers in a single region.
If multiple servers are exhibiting increased latency, a regional network connectivity issue could be to blame. You can use the Cloud Network Monitoring overview to see more information, which can help you determine whether these response delays may be a result of low throughput or a high number of TCP retransmits within the server’s region.
Your DNS servers can also slow down as a result of a low cache hit rate, which you can track by monitoring your DNS service with Datadog. If you determine that an ineffective cache is contributing to DNS latency, you can resolve the issue by adjusting your servers’ TTL values so they can respond to requests more quickly.
Under-resourced DNS servers can become saturated and fail to respond to incoming queries, which can cause your application to slow down or fail sporadically. Datadog provides out-of-the-box integrations with DNS services like CoreDNS, PowerDNS, and Amazon Route 53, which, when used in tandem with the DNS view, allow you to correlate the health and resource usage of your DNS service with the volume of requests from your DNS clients.
The screenshot below shows the Request count and Response time graphs from the DNS view, which indicate that an increase in the rate of requests from the source application tagged source_app:stackdriver-metadata-agent corresponds with a spike in the response time to requests from that application at the same moments in time.
This correlation suggests that if the applications in this environment slow down as traffic increases, it could be the result of an under-resourced DNS server. In a case like this, you could refer to the dashboard for your DNS service to determine whether a resource constraint is responsible for the slow responses.
DNS records play a critical role in ensuring that servers route traffic to your applications and services properly, and proactively monitoring them can help you detect misconfigurations and surface potential problems in an external or internal DNS server before they significantly affect your users. A misconfigured mail exchange (MX) record, for example, could mean that users are no longer able to email you at your company domain. Or, a sudden spike in resolution times for a record could indicate an issue with an underlying DNS server.
Datadog Synthetic Monitoring complements debugging DNS with CNM by enabling you to proactively monitor your DNS records and get a high-level overview of DNS server performance with built-in DNS tests. Similar to an nslookup or dig query, Datadog’s DNS tests fetch and verify the records mapped to a domain name or IP address you specify while also capturing their resolution time.
Datadog supports the commonly used A, AAAA, CNAME, MX, and TXT record types and allows you to check records against either an external DNS provider, such as Google Public DNS or Cloudflare, or an internal server, giving you greater flexibility in monitoring your DNS service. You can also test records using a large network of public testing locations—or your own group of private locations for internal-facing services—so you can ensure that records are mapped to DNS servers as expected for all of your users and quickly verify if a DNS issue is widespread or limited to one specific region.
If a DNS record does not match a specified value (e.g., IP addresses, hosts, strings), or if the response time is longer than expected, Datadog will alert you with a summary of which test assertions failed.
With this information, you can determine if the issue is related to servers propagating misconfigured DNS entries, serving stale DNS records, or simply no longer responding to requests. For any unexpected entries, you can contact your DNS administrator to resolve problems related to a misconfigured server or have them investigate a potential DNS cache poisoning attack. If you are seeing increased response times, you can use the DNS view in Cloud Network Monitoring to isolate server metrics and verify if an under-resourced server is to blame or if there is any other unusual server activity.
Datadog’s Cloud Network Monitoring and Synthetic DNS tests give you complete visibility into the health of both the internal and external DNS services your applications depend on. And because Datadog integrates with more than 1,000 technologies—including CoreDNS, PowerDNS, and Route 53—you’ll be able to correlate DNS flow data with performance metrics from across your entire environment.
See our documentation to learn more about monitoring your Linux- or Windows-based DNS service with Cloud Network Monitoring and testing your DNS records with Synthetics to ensure the resolvability and lookup times of your DNS records. If you haven’t yet started using Datadog, sign up for a free 14-day trial.
此内容由惯性聚合(RSS阅读器)自动聚合整理,仅供阅读参考。 原文来自 — 版权归原作者所有。