






Consolidation is reshaping the experimentation and feature management landscape. Tools are merging, and partnerships are being repackaged as platforms. But marketing a unified experience is not the same as building one.
Right now, engineering leaders and product managers are reassessing whether the tools they depend on are built for the long term. It’s irrelevant which vendor has the most products. The real question is: When your release workflow crosses six systems in a single afternoon, does your tooling cross with it? The difference between a stitched-together stack of integrations and a true platform built from the ground up is architectural, and its effects are cumulative.
In theory, stitched-together stacks are a quick solution. When your flag tool, analytics platform, warehouse, experimentation engine, and tracing system are connected, the data flows and the dashboard lights up. Integrations further extend what each tool can see and reduce some of the manual work. But there’s a ceiling.
Picture a gradual rollout with a stitched-together stack. Your team creates a feature flag in Tool A, ties it to an experiment to measure impact in Tool B, deploys it through CI/CD in Tool C, and starts the ramp. Your flag is in Tool A, your error rates are in Tool D, and your experiment scorecard and product funnel data are in Tool B. Within minutes, error tracking alerts fire, observability dashboards populate, synthetic tests run, and product analytics capture the first user interactions.
Now something looks wrong at 5% ramp, so you export a result from Tool C, pivot it in your warehouse, then cross-reference a trace from Tool D. Someone else needs to check data quality signals, and another person loops in the experiment scorecard owner. By the time you’ve correlated everything, 20 minutes have passed and three people are in the same Slack thread trying to agree on what they’re looking at. Suddenly, the single release requires multiple different workflows to maintain it.
Before you can confidently read a result, it’s important that data quality signals, application traces, user pathways, business metrics, and warehouse tables tell a coherent story. A trustworthy experiment starts with clean data. When data lives in separate systems, each handoff creates doubt about whether what you’re seeing is real or an artifact of the seam.
Tools that see only one slice of this picture create blind spots, and blind spots compound into slower decisions and higher error rates. While context switching is frustrating for individual users, the larger problem is that its costs accumulate. When fragmented tooling becomes part of every release workflow, the resulting coordination overhead creates a recurring, often invisible drag on every team that ships.
A unified platform is not about stacking as many tools into the same view as possible. It relies on a unified data model where observability, product signals, warehouse metrics, LLM evaluations, and release state coexist and correlate as parts of a larger, synthesized system.
Now imagine the same gradual rollout as above, where your team deploys a feature flag, it ramps to 5%, and it starts experiencing error rates ticking up. But this time, your team and tools are all in the same view, with your flag state, error rates, funnel data, session replays, distributed traces, warehouse metrics, and LLM evaluation scores sharing the same data model. When something looks off, one click from the scorecard surfaces the affected traces and another opens a session replay of a user who hit a slow path.
Within minutes, you already have the answer: A downstream API call is timing out only for users in the treatment group, and only when a specific configuration is active. Warehouse metrics confirm the affected segment is small but revenue-sensitive. You confidently hold the ramp at 5% and post a single message to the team channel with the trace and replay linked, so the team responsible for the fix can start immediately.
Every integration is a seam, and seams inevitably break, introduce latency, and require maintenance. More critically, they require context switching at exactly the moment you need a complete picture. Integration means the data model is still fragmented—correlation requires an export, and context requires a tab switch. With a unified platform, there are zero exports, minimal latency, and no pivots to disconnected data sources.
If you’re moving your experimentation stack onto a platform, you wonder about what happens if you need to move again. Platform depth should never come at the cost of owning your data or your code. The two can exist without tension, but it’s fair to demand proof at the implementation level instead of in a sales call.
Real platform depth includes data portability, which offers two non-negotiable principles for product teams: warehouse-native experimentation and the OpenFeature SDK. With warehouse-native experimentation, your business metrics stay in your Snowflake, BigQuery, or Databricks instance and not inside a vendor’s proprietary data store. You own the data, you can query it directly, and you can audit results. If you move, the data moves with you.
The OpenFeature SDK—the CNCF open source standard—works similarly in the sense that your flag code doesn’t lock you in either. It’s written against a portable, vendor-neutral API, and portability is preserved at the implementation level. Open standards and platform depth are not in tension. They should both be requirements of any vendor worth consolidating onto.
Having a stitched-together stack becomes significantly harder to work around with agentic AI. AI agents are taking on more of the release and experimentation workflow, and unlike humans, agents don’t have the judgment to navigate fragmented tooling. They don’t know which tab to open, who to ping, or what to check next. They operate across boundaries programmatically, and if those boundaries are seams between disconnected systems, every gap becomes a failure risk.
Datadog combines warehouse-native experimentation, application observability, product analytics, session replay, data observability, and LLM evaluations on a single data model. We’re exposing that full surface through MCP and CLI, with purpose-built clients for Claude, Codex, and Slack. And with these tools built into the same platform, new possibilities emerge when agents can operate across all of it at once without boundaries.
Let’s say your team is managing the same release ramp as our earlier examples with Datadog Feature Flags. It’s 2 a.m., and at 5% rollout the same downstream API times out in the treatment group.
This time, there’s no human on call for response. A Claude-based agent is monitoring the ramp through the Datadog MCP Server. When the error rate ticks up, the agent checks whether it’s above a certain guardrail metric and immediately correlates the spike against the flag’s exposure data. It then isolates affected traces and identifies that the timeout is only hitting users on a specific Android version. With warehouse metrics attached to Datadog, it queries Databricks to size the scope of affected users: 1.37%.
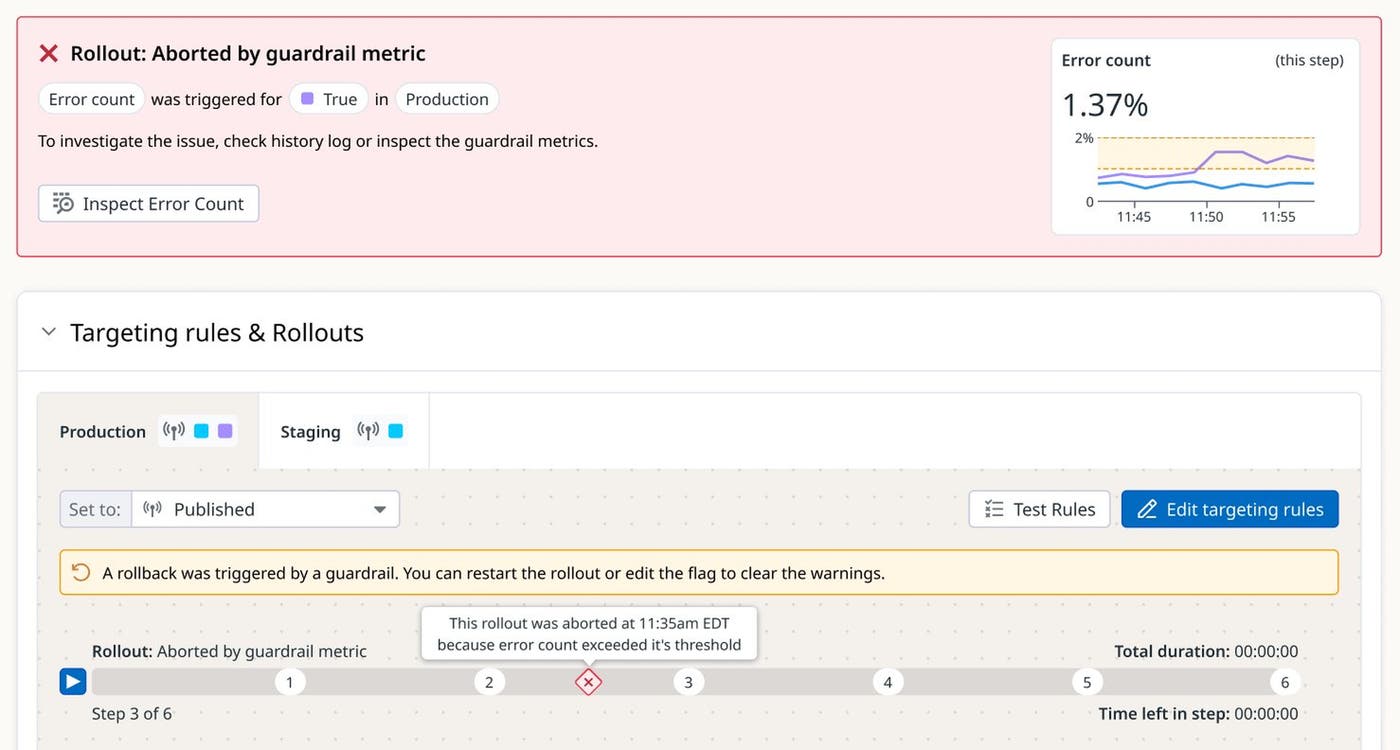
The agent makes a decision to hold the ramp for the 1.37% of users while continuing the rollout for the remaining 98.63%. It posts a message in Slack detailing the error, affected users, correlated telemetry data, action taken, and recommended fix, all ready for the team when they start the day.
That investigation isn’t possible on a stack where flag state, traces, session replays, and product data live in different systems. Stitching context across API calls, losing detail in seams, and operating with an incomplete picture cost a human team time, but they cost an AI agent its entire functionality. That’s an automated version of the swivel-chair problem and the reason why platform depth is the prerequisite for agentic workflows.
The market will keep consolidating, and more announcements are coming. The questions to keep in mind are whether tool consolidations actually unify your data model, whether open standards protect your data, and whether you can trust that an agent acting on your behalf has everything it needs in one place.
Datadog Experiments, Feature Flags, and Product Analytics are available today, built into the same data model as our observability platform. To learn more, check out our other blog posts about how these tools work together so that you can understand your data and ship faster.
If you’re new to Datadog, If you’re new to Datadog, sign up for a 14-day free trial..
此内容由惯性聚合(RSS阅读器)自动聚合整理,仅供阅读参考。 原文来自 — 版权归原作者所有。