








In Part 1, we looked at some best practices for creating effective test suites for critical application workflows. Many organizations prioritize browser tests in order to quickly expand their test suites. But these types of tests often take more time to implement and scale than teams initially expect. In this post, we’ll walk through best practices for making test suites easier to maintain over time, including:
Avoiding false positives in tests
Making tests easy to understand
Leveraging a unique test suite across environments
We’ll also show how Datadog Synthetic Monitoring can help you easily adhere to these best practices to keep test suites maintainable while ensuring a smooth troubleshooting experience for your team.
Before we walk through these best practices for maintaining tests over time, it’s important to understand why teams often spend more time updating existing tests than creating new ones. As an application’s UI evolves, expanding test coverage ensures that new features are validated. But creating new end-to-end tests is only a small part of making certain application workflows or features do not break. For most engineering and QA teams, the bulk of their testing time is spent maintaining existing tests—rather than creating new ones for new functionalities.
There are several different factors that can contribute to the difficulty of maintaining tests including:
Tests that generate false positives during critical releases
Suites that are disconnected from continuous integration workflows, disrupting both application development and other tests when a breaking change is deployed
Inefficient test steps that make failures more difficult to troubleshoot
Tests that do not accurately describe what is being validated, making onboarding more difficult
Next, we’ll look at each of these factors—as well as best practices for alleviating these pain points—in more detail.
Test flakiness—when tests randomly fail without any code changes—is one of the more common pain points for teams trying to maintain their suites. Tests can quickly become flaky if they do not use the right combination of UI locators to interact with application elements, and if they do not efficiently notify teams of legitimate failures. Interacting with the right UI elements and improving alerts is key to ensuring tests remain easy to maintain and that every single alert your team receives actually matters.
Test reliability is determined by the locators you use as the basis for test actions and verifications. For example, element IDs are often unique enough and more resilient to development changes, making them a primary choice for tests. If these IDs are not available, or not unique enough, then engineers may try to update frontend code to accommodate test automation. However, this requires substantial effort and risks breaking tests created by other teams. As an alternative, engineers often design tests to rely on CSS selectors or XPaths to interact with an application element.
Element locators, whether IDs, CSS selectors, or XPaths, can all change instantly as teams update and refactor their UIs (e.g., move elements to different areas of a page, add new page elements). As a result, tests that rely on single identifiers often fail, increasing maintenance efforts and reducing confidence in a test suite overall. Additionally, many popular development frameworks (e.g., React, Angular, Vue) dynamically generate (or update) random, complex element IDs and class names with each page render or release cycle. And modern, agile companies can deploy new application code several times a day, making it even harder for teams in charge of test automation to find robust identifiers for tests. They often have to collaborate with frontend developers to adapt automated tests to application changes and ensure they have reliable ways to locate elements.
A good way to improve the accuracy of your tests is by using a combination of locators, such as an element’s class name and its location within a certain div or span, instead of a single locator. This provides more context for an element’s location. Datadog browser tests address this pain point by using “multi-locator” algorithms to find UI elements. When a test searches for a specific element to interact with (e.g., a checkout button), Datadog looks at several different points of reference to help find it, including the XPath, text, classes, and what other elements are near it. These points of reference are turned into a set of locators, each uniquely defining the element.
If there is a UI change that modifies an element (e.g., moves it to another location), the test will automatically locate the element again based on the points of reference that were not affected by the change. Once the test completes successfully, Datadog will recompute, or “self-heal,” any broken locators with updated values. This ensures that your tests do not break because of a simple UI change and can automatically adapt to the evolution of your application’s UI.
In the next section, we’ll look at how you can fine-tune your test notifications to ensure that you are only notified of legitimate failures.
In Part 1, we discussed the importance of creating notifications that enable teams to respond faster to issues. Building reliable test suites also means knowing when to trigger alerts. Triggers can indeed be the result of legitimate bugs or they may simply be from changes in the testing environment. By designing alerts that are resilient to factors outside of your control, you can easily reduce false positives—and only be notified of real issues.
You can do this by fine-tuning your tests to have them automatically retry steps before sending a notification of a failure. This helps decrease the number of alerts that are triggered for issues that are not related to the tested workflow such as temporary network blips that do not directly impact your users.
Browser tests have a built-in wait and retry mechanism, making test steps resilient to potential network slowness. They also include customizable rules for “fast retries” and alerting on test failures, without the need for modifying any code. Adjusting these rules can help further reduce false positives. For example, increasing the number of locations that are included in the alert condition can improve the odds of triggering an alert for a legitimate failure.

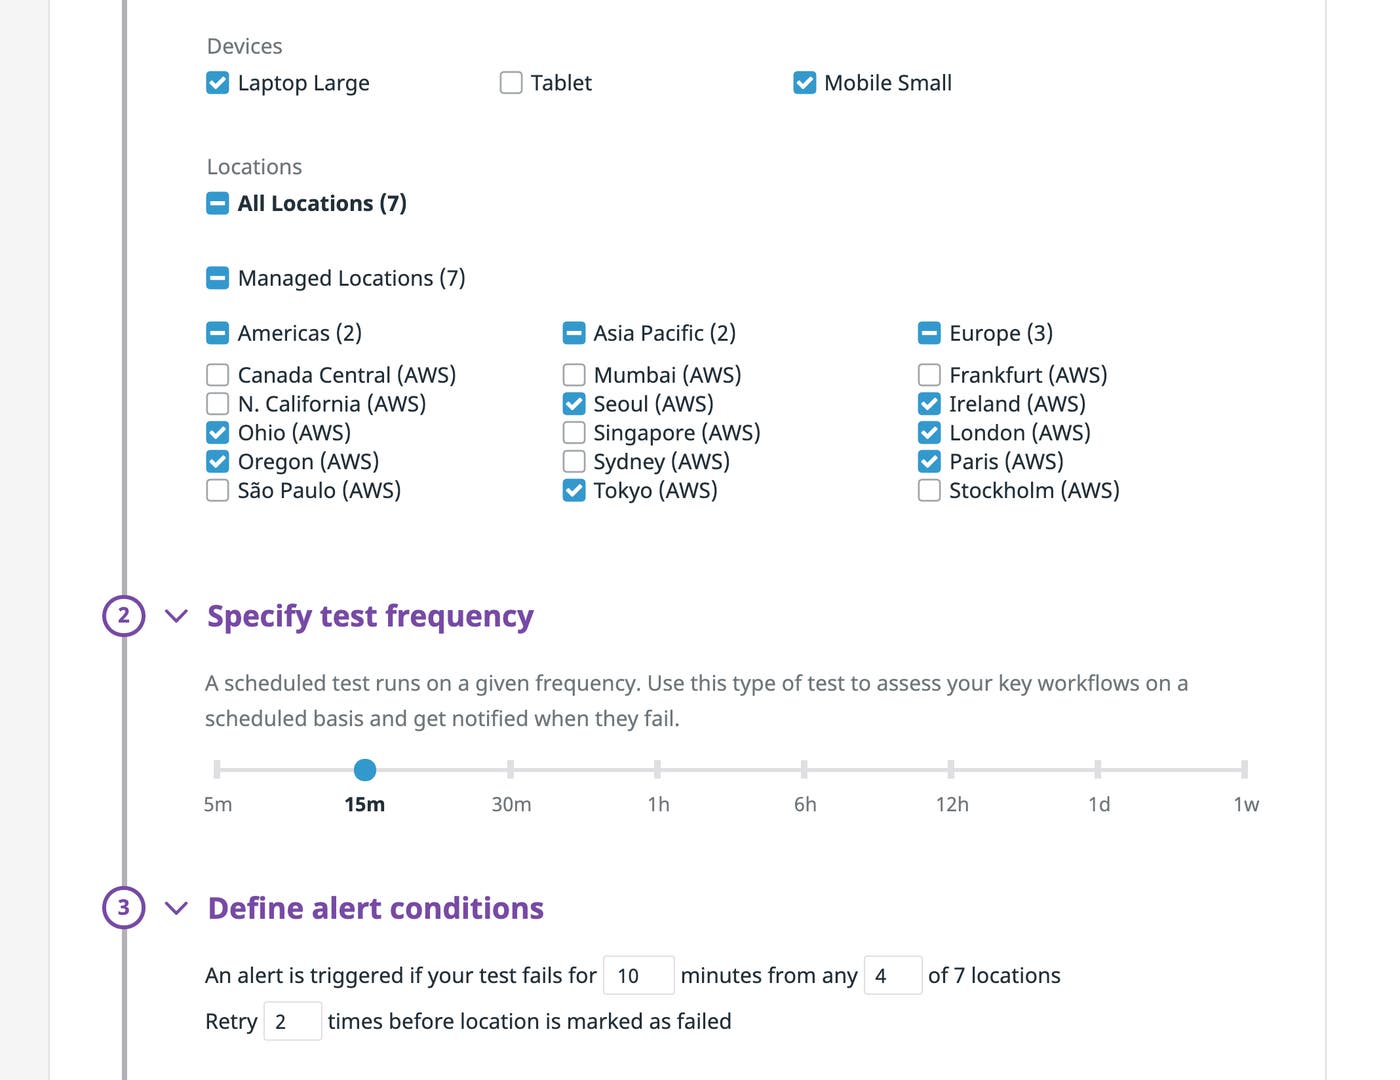
A failure in just one out of the seven configured locations seen in the example above could simply be a result of a network issue. In these cases, configuring Datadog’s fast retry feature to immediately run the test again is often a good way to distinguish a temporary network issue from an actual bug. Similarly, failures in four out of those seven locations is a greater indicator of an issue in the application.
As an application grows, you may need to adjust notifications to accommodate more complex testing environments. For example, you can fine-tune notifications to be a bit more permissive on issues in a staging environment than on those found in production by increasing the number of retries or the amount of time required before triggering the alert. This is useful if your staging environment is running on different hardware than what is used in production, which might mean increased latency.
Tests can fail for reasons outside of your control, and troubleshooting those failures is time consuming. By fine-tuning a test’s alerting conditions, you can ensure that all the alerts you get are reliable and deserve to be looked into. And when a test does fail, Datadog provides deep visibility into the cause by automatically including context—like screenshots, loaded resources, frontend errors, and backend traces—around the failure for accelerated troubleshooting.
Reducing test flakiness and building alerts that are resilient to unexpected changes in your environments will improve your confidence in your test suite and make it easier to maintain. Next, we’ll look at how you can make tests understandable, focused, and more descriptive in order to further simplify maintenance efforts.
A key part of test maintainability is ensuring that tests enable everyone on the team (from longtime members to newcomers) to quickly identify, investigate, and resolve errors. Some best practices for building accessible, easy-to-use (and easy-to-understand) tests include:
Eliminating unnecessary steps that complicate tests
Ensuring tests and test steps are descriptive enough to easily troubleshoot issues
Consolidating and reusing workflows to reduce points of maintenance
We’ll take a look at these best practices in more detail next.
It’s important to remove unnecessary steps that make it more difficult to maintain suites and identify legitimate issues in workflows. Two common examples of this are test steps that do not closely mimic how a user interacts with the application, and assertions that do not reflect what the user expects to see.
Tests with too many irrelevant steps and assertions increase execution times and scope, making it more difficult to identify the root cause of an issue in case of real failures. If any step does not mimic user behavior or expectations for the tested workflow, you can safely remove it from your test; you only need to verify actions or behavior relevant to the tested workflow. For example, a test that changes a mailing address in a user’s profile only needs to include the specific steps for making the change (e.g., navigating to the profile, filling in the input field, etc.) and a simple assertion to confirm that the profile was successfully updated with the correct address. This helps tests stay focused on one workflow at a time.
By removing unnecessary steps, tests have fewer points of maintenance, allowing you to identify legitimate bugs more efficiently.
When a test fails, you need to quickly identify where the failure occurred before you can understand its cause. If tests are too vague, then you may end up spending valuable time manually recreating workflow steps simply to understand what was tested. Additionally, vague test names make it more difficult for new team members to quickly get up to speed on the application they are testing. Spending some time to ensure your tests are sufficiently self-explanatory will aid in uncovering the root cause of a failure and streamlining the onboarding process for your team, so you can resolve issues faster.

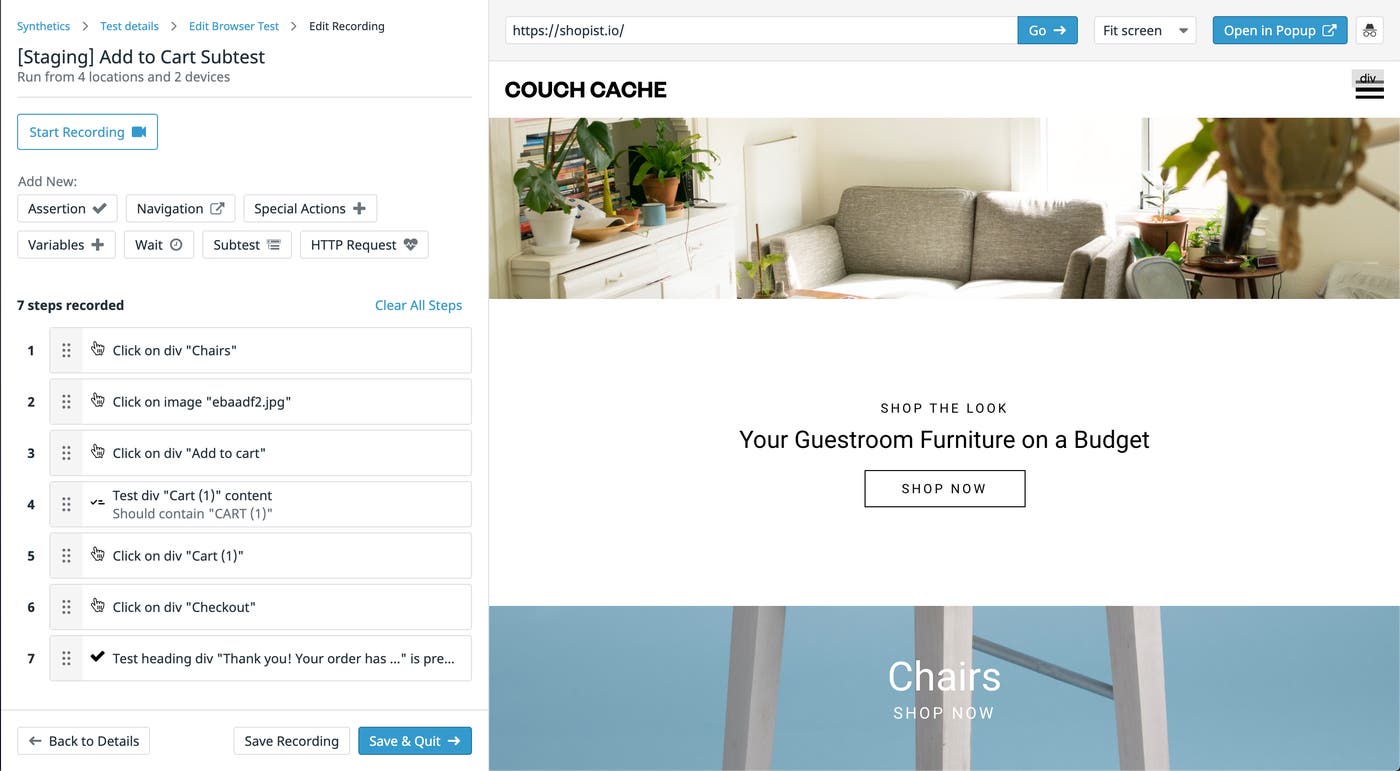
As seen in the example test above, step names can show the action a user would take as well as where they interact (e.g., button, input field). Datadog’s built-in recording tool automatically names steps based on the step action or assertion. These names are often descriptive enough to understand what is going on in the test, but you can edit them if you need to add more context.
Descriptive test and step names help you understand the workflow that is being tested at a high level as well as the specific interactions in each step, reducing the amount of time your team spends manually recreating test steps. And since browser tests automatically capture screenshots of the UI for each test step, you can easily visualize and connect test actions to specific sections of the application UI to troubleshoot failures.
Test duplication is another factor that contributes to tests that are difficult to understand and troubleshoot. Test (and step) duplication can easily happen as team members add to the test suites to quickly support new application features. This complicates the process for creating new tests and adds more points of maintenance when workflows are updated. For example, if you have a group of tests that contain the same four individual steps for logging into an application, when there’s a major change to the login process you have to spend time changing those steps for every single test.
A best practice for minimizing these types of issues is to consolidate tests and workflow steps where needed. As with creating new tests, you can use the DRY principle (i.e., “don’t repeat yourself”) to help you eliminate any redundant tests and test steps. This not only helps you maintain your tests but also ensures that they remain small in scope, focusing on testing one workflow at a time.
For example, Datadog browser tests enable you to group reusable steps together with subtests so that you can use them across multiple tests. By minimizing duplicate test steps, you can both reduce the number of changes required and isolate changes to a handful of specific steps. This keeps tests within the scope of a single workflow and drastically cuts down on the time it takes to update them. Using our previous login example, you can create a “login” subtest that includes the four steps required to log into an application, and then use it in your other tests.

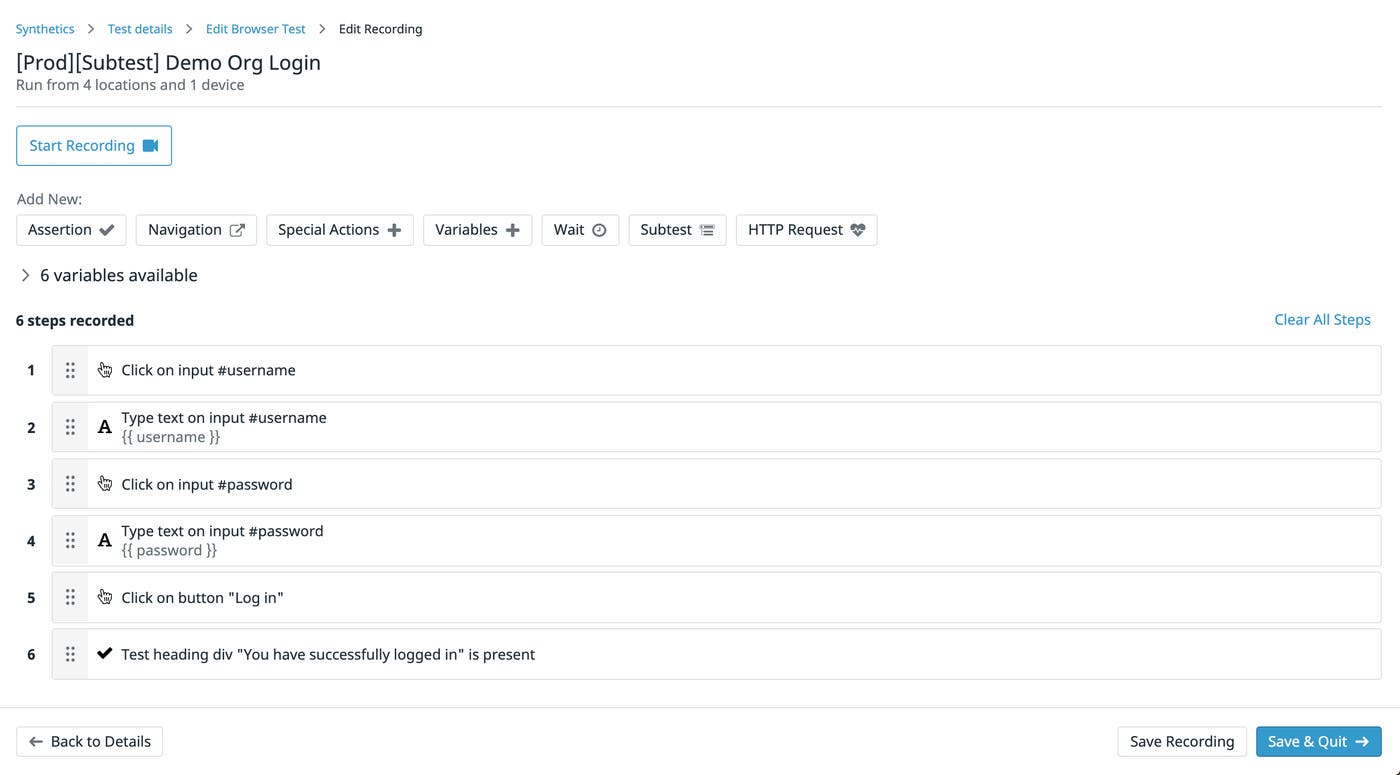
By consolidating workflows into reusable test components, similar to using a Page Object design pattern in test automation, you reduce the risk of creating several, disjointed tests for verifying the same functionality. And when an application’s UI or workflow is updated, you only have to update the shared components instead of individual tests.
Another benefit of consolidating application workflows is that it makes it easier to leverage your test suite across all your environments. Your teams can use the same efficient suite for their own development, ensuring that core functionality is always tested.
As your application grows in complexity, you may create different build environments (e.g., development, staging, production) to develop, stage, and ship features. Testing in all of these environments creates safeguards for your application, thereby ensuring that it continues to function as expected, even as your team deploys code across new environments.
A key aspect of testing in different environments is leveraging a unique test suite, meaning that every environment uses the same tests to verify core functionality. This not only simplifies testing for your team but also further reduces test duplication. Just like you would re-use a browser test as a subtest for a specific part of a journey in production (e.g., login), you can use subtests to run a full test scenario across multiple environments, without the need to recreate any individual test steps.
For instance, you can use a test running on production and test the exact same user journey on your staging environment using a subtest. With this setup, you will only need to modify the staging test’s starting URL to point to the appropriate environment, which will automatically propagate to the subtest.

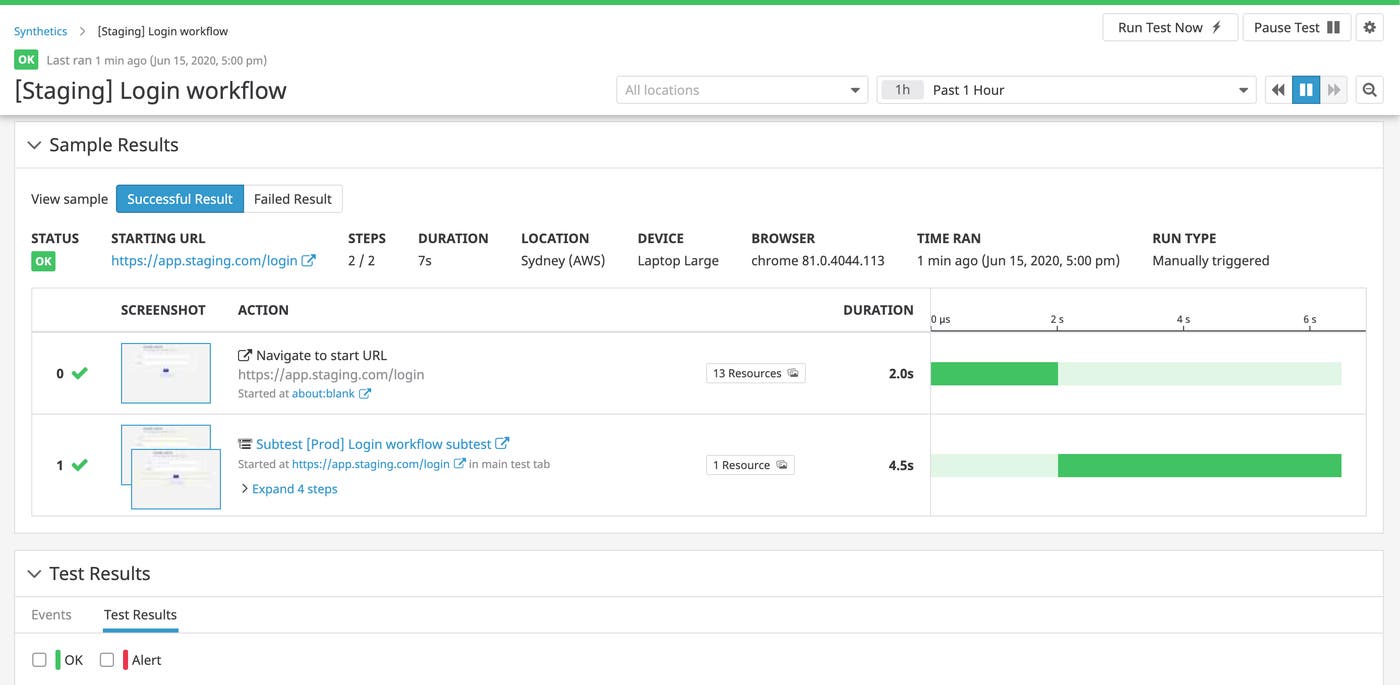
When changes are deployed to production that require updates to the associated tests, you will only need to update the steps in one subtest—instead of manually updating separate tests for each environment.
Next, we’ll show how your existing continuous integration (CI) workflows can help you go one step further by easily sharing and using the same core suite of tests directly within your CI pipelines
CI automates the processes teams use to rapidly package and deploy new features across environments, from development to production. Test suites that are not tightly integrated with CI workflows can make test maintenance and collaboration more difficult, as well as increase the risk of releasing broken features. Adding existing tests to CI reduces maintenance efforts by encouraging teams to use the same suite throughout development, instead of creating their own tests locally that may fall out of sync with others. Leveraging tests in CI pipelines is also a good way to increase test coverage, as it shifts functional testing to much earlier in the development process.
In addition to Datadog integrations with popular CI tools such as CircleCI, Jenkins, and Travis CI, Datadog CI/CD Testing now allows you to run tests directly with in your CI workflows to optionally block deployments in case of degraded user experience. Instead of creating a separate test suite for your CI pipelines, you can simply leverage your existing tests by referencing them in a local file located in your code repository. The CLI then auto-discovers the tests that should run with each new PR while giving you flexibility in test parameters to fully match your CI environment’s technical specifications.
Though leveraging a unique test suite across all environments can make maintenance easier, it can also quickly make it harder for teams using that test suite to collaborate as they work on different parts of the applications. Datadog browser tests ensure smooth collaboration between teams by allowing developers to quickly modify each test’s CI execution rules directly in the UI, without having to make a pull request. If a feature breaks in staging and fails tests, you can decide to directly skip those tests in that environment, allowing developers working on a different feature to continue their efforts while others investigate the bug.

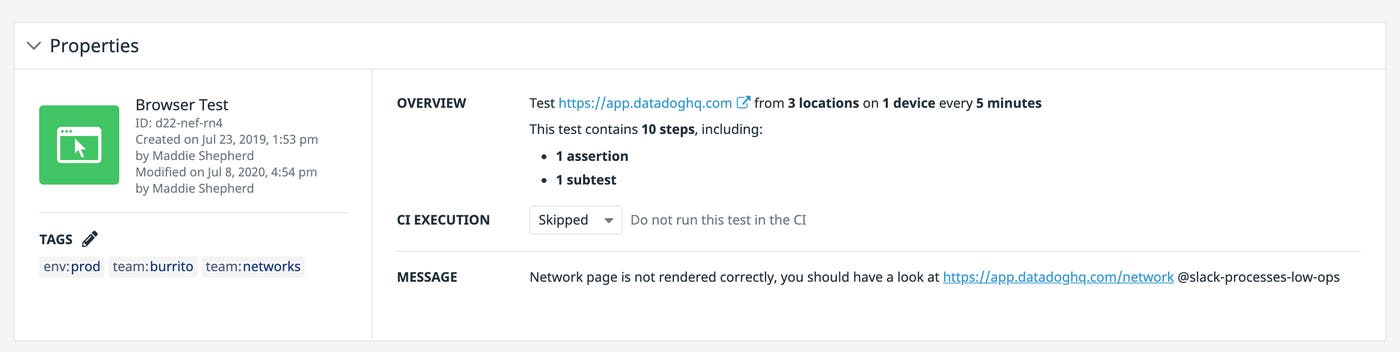
Once the bug is fixed, you can quickly switch the CI execution rules for those tests back to blocking. This will automatically block the CI pipeline if the test fails, so you can resolve the problem before you release the feature to your users.
You can configure CI execution rules for each test via the Datadog UI or the dedicated command line interface. This allows your teams to easily collaborate over unique, easily maintainable test suites while ensuring the rest of development is not halted. By adding the process of running test suites within your existing CI workflows, you promote collaboration across your teams and enable them to create a shared understanding of application behavior, use the same suites of tests for their features, and continue to increase test coverage. Integrating end-to-end tests with CI workflows also enables you to consistently verify that tests are up to date with application features and continue providing value for your team, which aids in maintenance efforts.
With these best practices, you promote test maintainability as well as ensure a consistent, reliable user experience for your customers. To learn more about how you can begin creating efficient browser tests, check out Part 1 or our documentation for more details. If you don’t have an account, you can sign up for a free trial and start creating tests today.
此内容由惯性聚合(RSS阅读器)自动聚合整理,仅供阅读参考。 原文来自 — 版权归原作者所有。